Review
. 2022 Sep;130(9):96003.
doi: 10.1289/EHP11185. Epub 2022 Sep 30.

Epidemiology Evidence for Health Effects of 150 per- and Polyfluoroalkyl Substances: A Systematic Evidence Map

Affiliations
Review

Epidemiology Evidence for Health Effects of 150 per- and Polyfluoroalkyl Substances: A Systematic Evidence Map

Elizabeth G Radke et al. Environ Health Perspect. 2022 Sep.

Abstract

Background: Per- and polyfluoroalkyl substances (PFAS) comprise a large class of chemicals with widespread use and persistence in the environment and in humans; however, most of the epidemiology research has focused on a small subset.

Objectives: The aim of this systematic evidence map (SEM) is to summarize the epidemiology evidence on approximately 150 lesser studied PFAS prioritized by the EPA for tiered toxicity testing, facilitating interpretation of those results as well as identification of priorities for risk assessment and data gaps for future research.

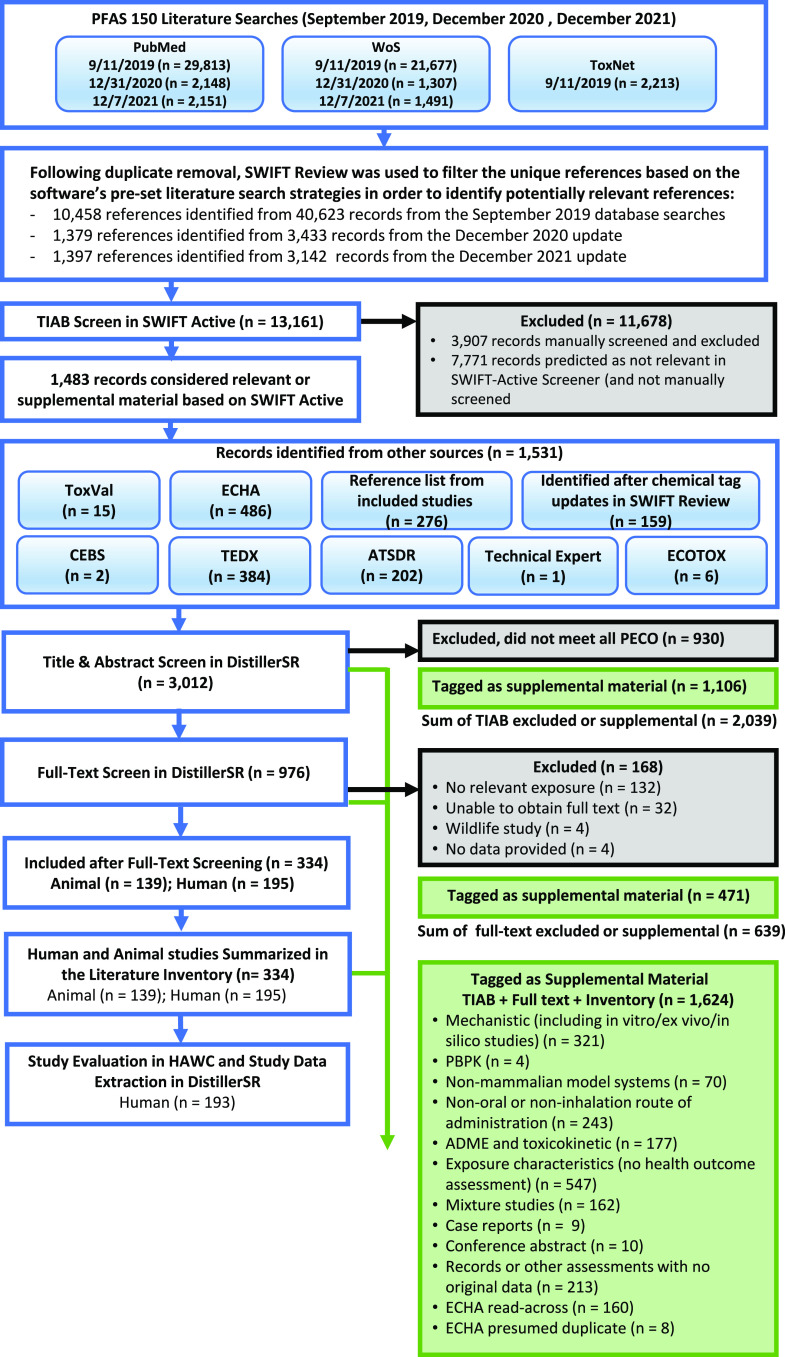
Methods: The Populations, Exposure, Comparators, and Outcomes (PECO) criteria were intentionally broad to identify studies of any health effects in humans with information on associations with exposure to the identified PFAS. Systematic review methods were used to search for literature that was screened using machine-learning software and manual review. Studies meeting the PECO criteria underwent quantitative data extraction and evaluation for risk of bias and sensitivity using the Integrated Risk Information System approach.

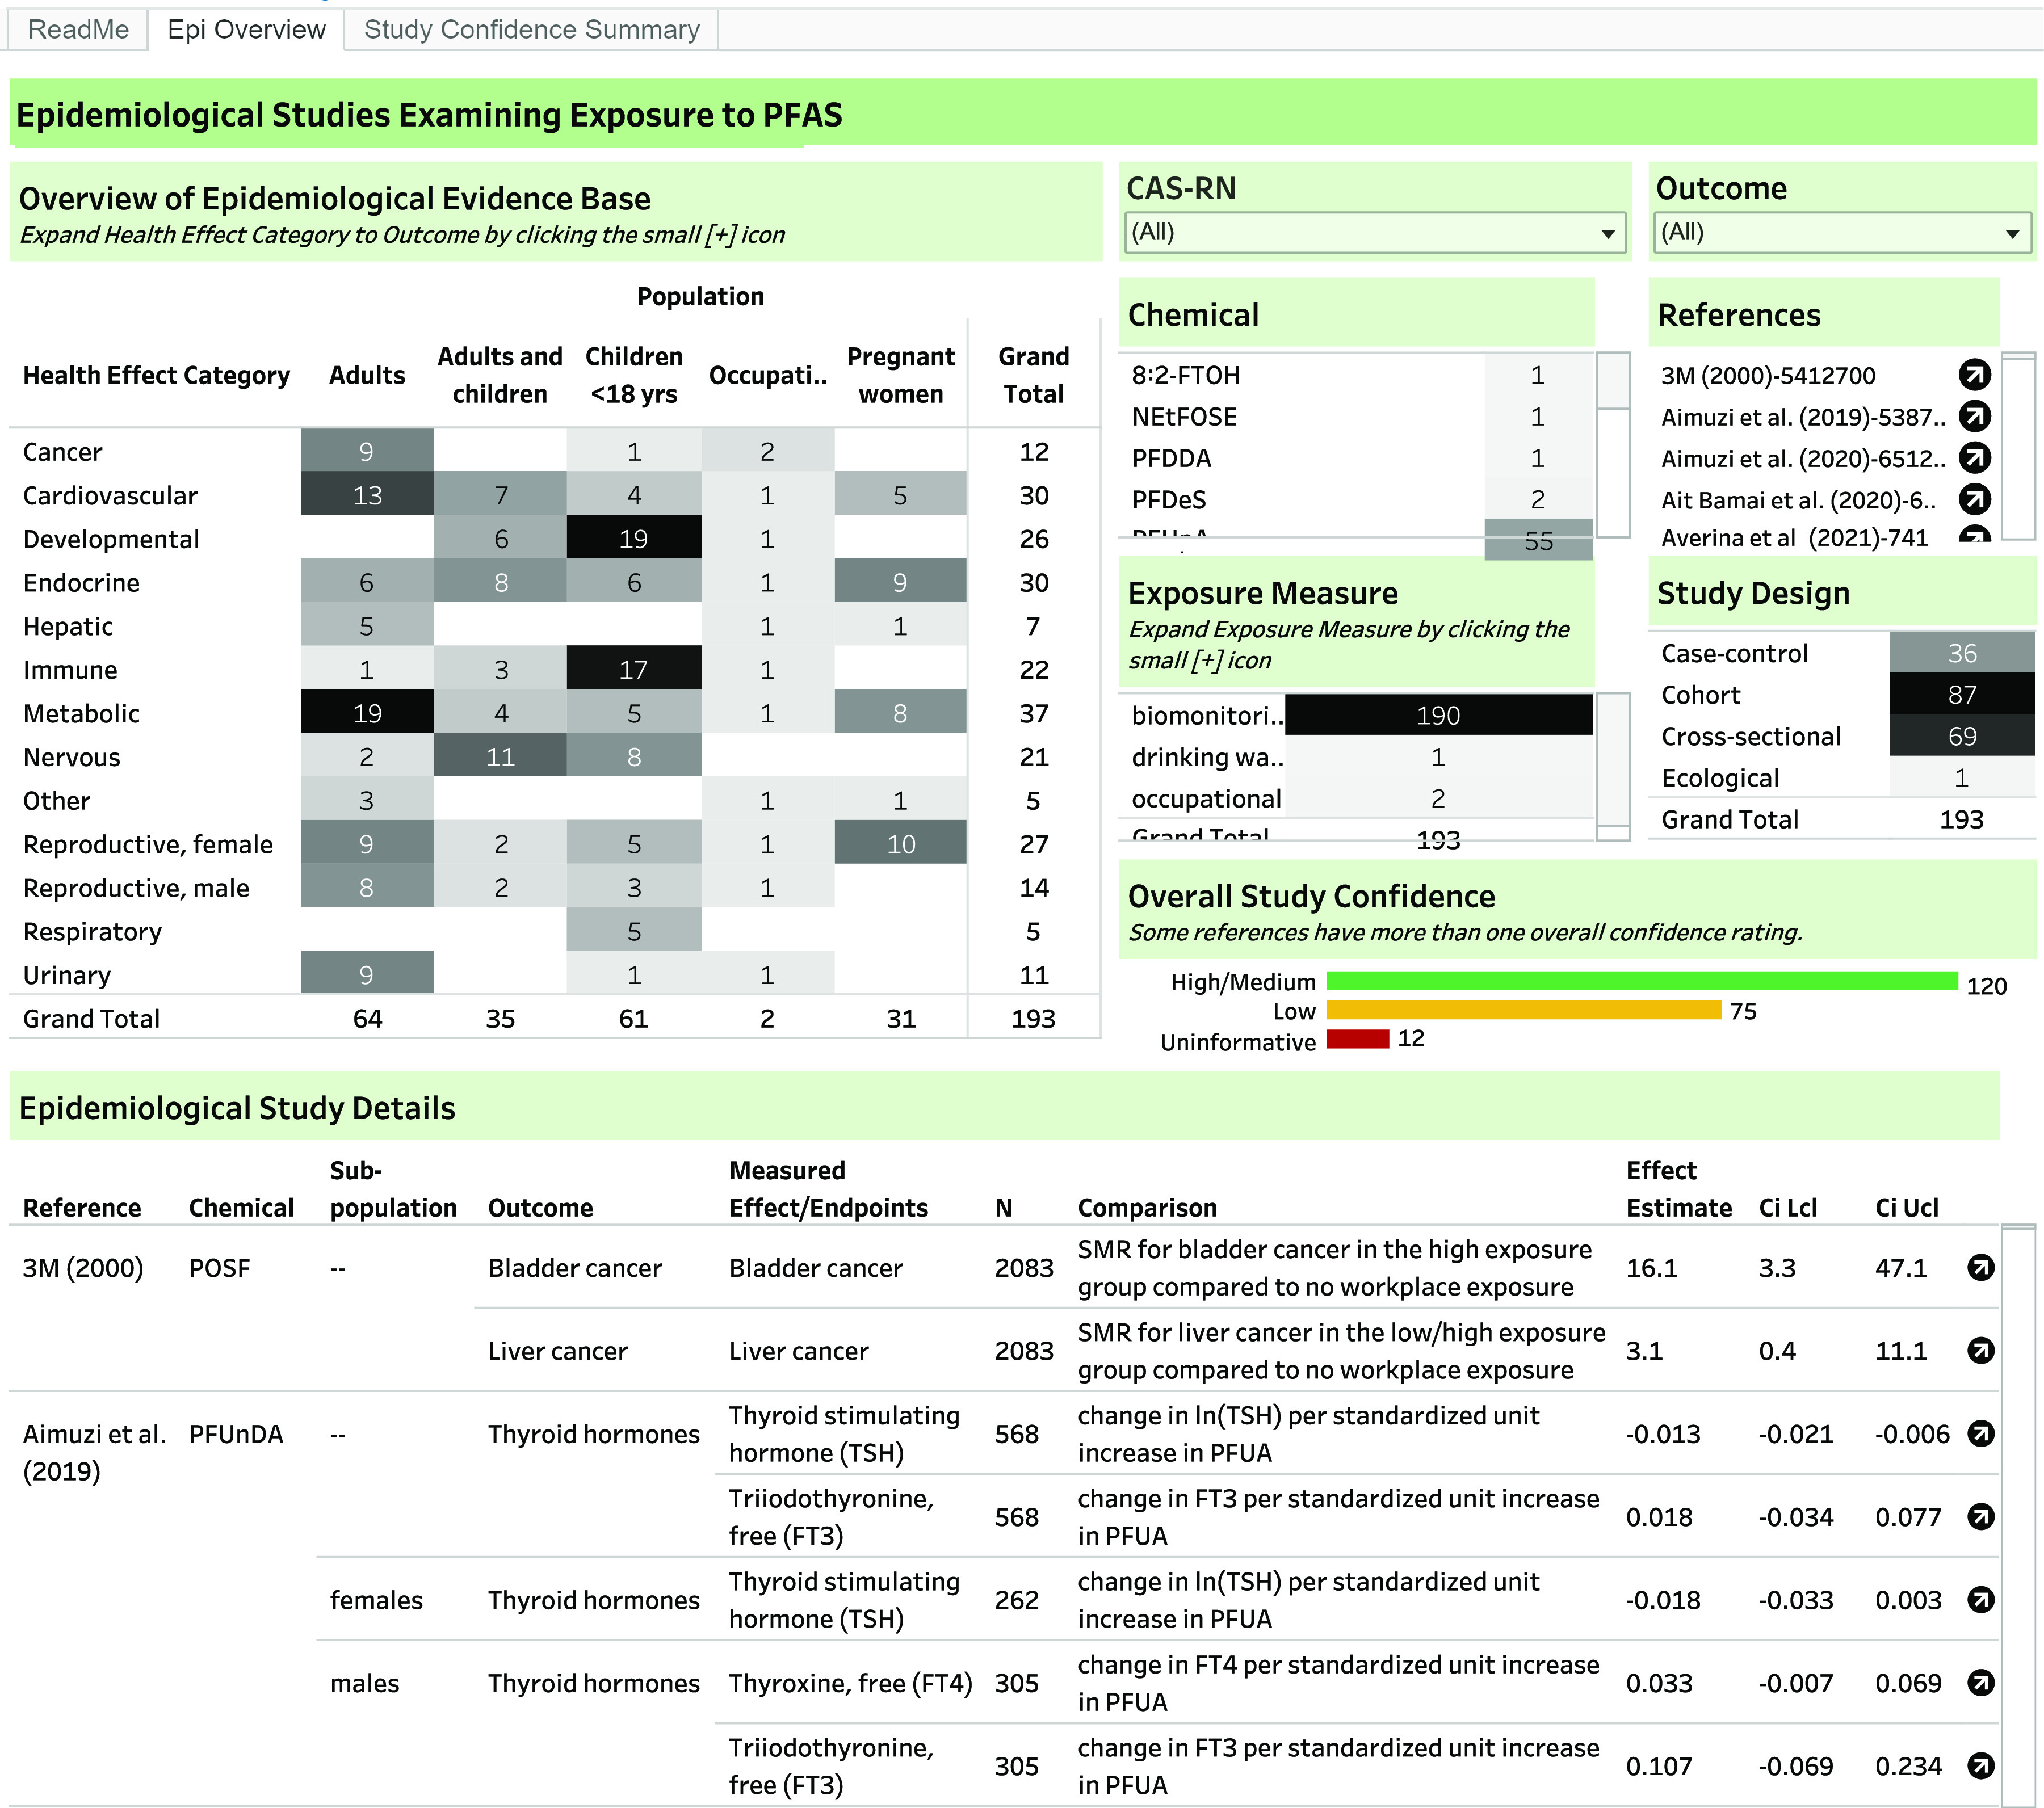
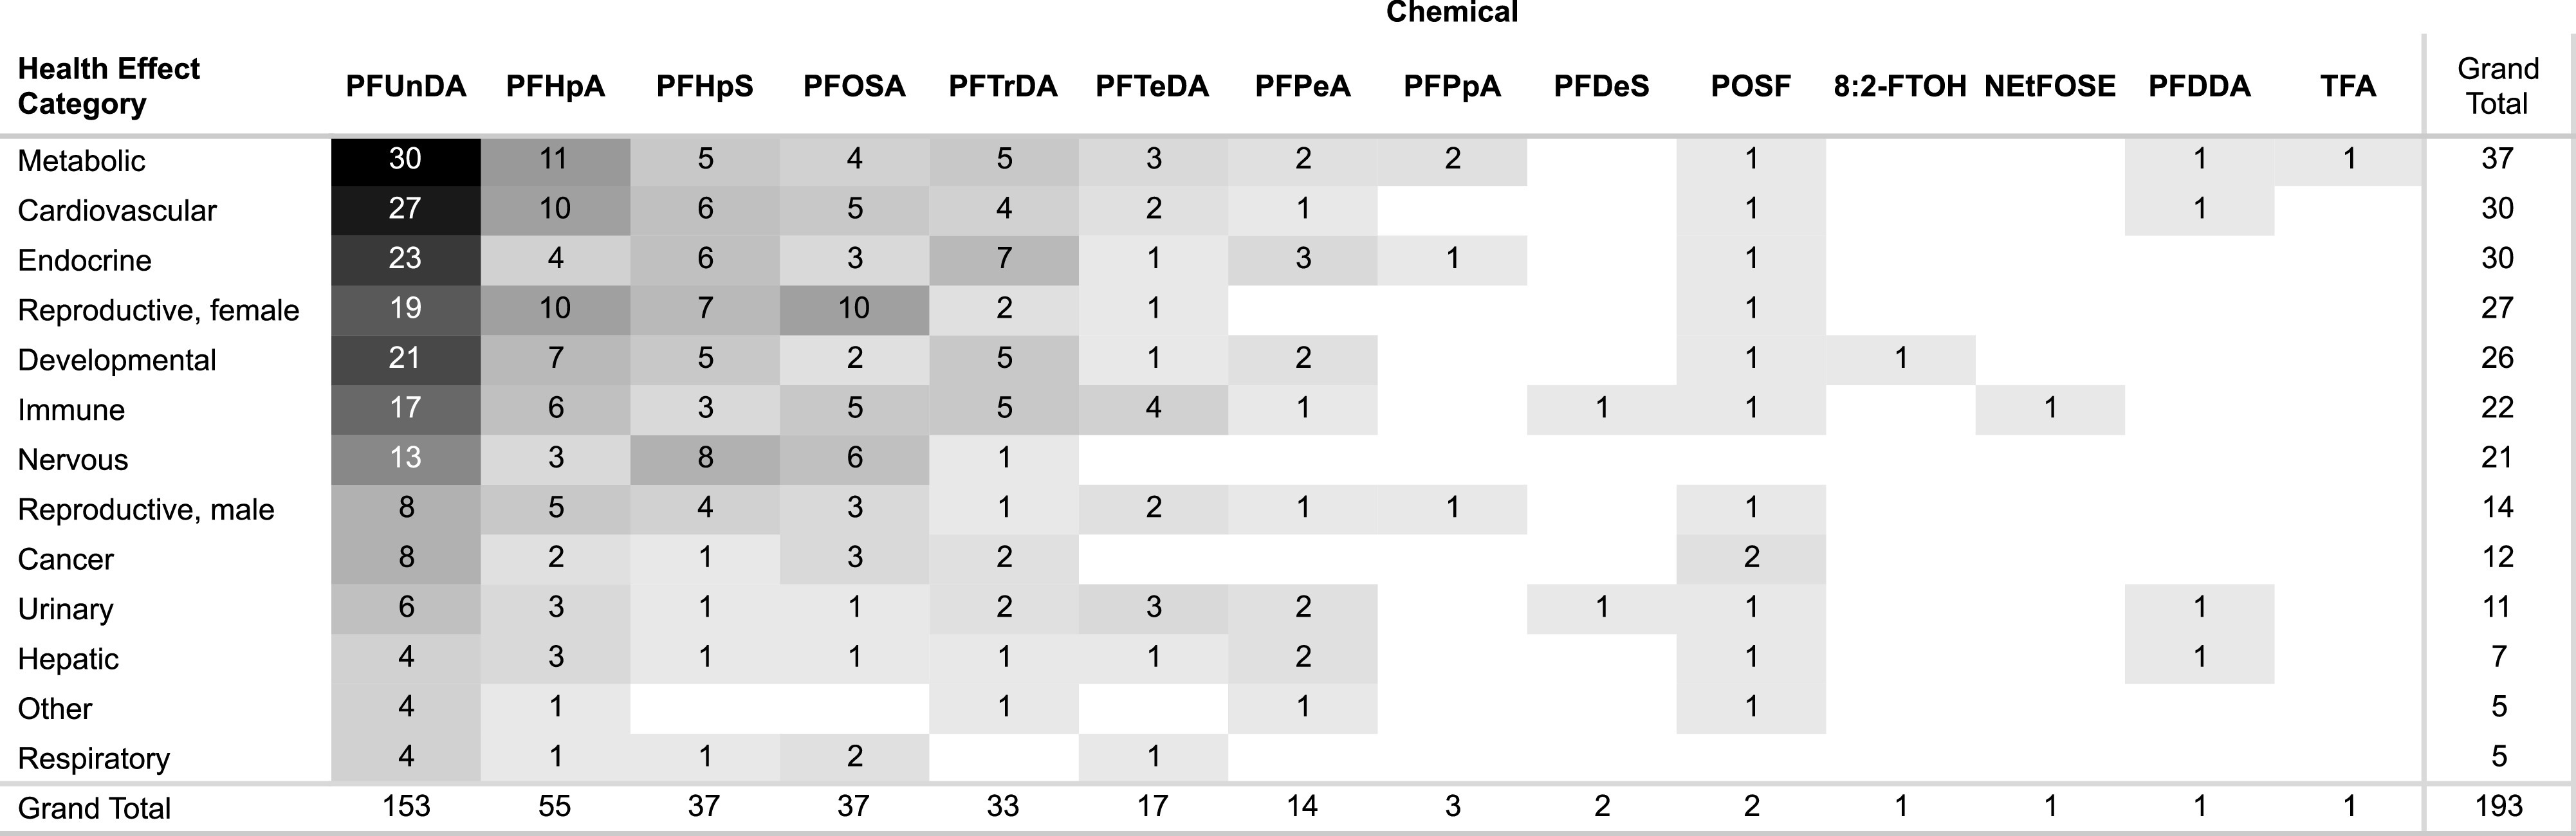
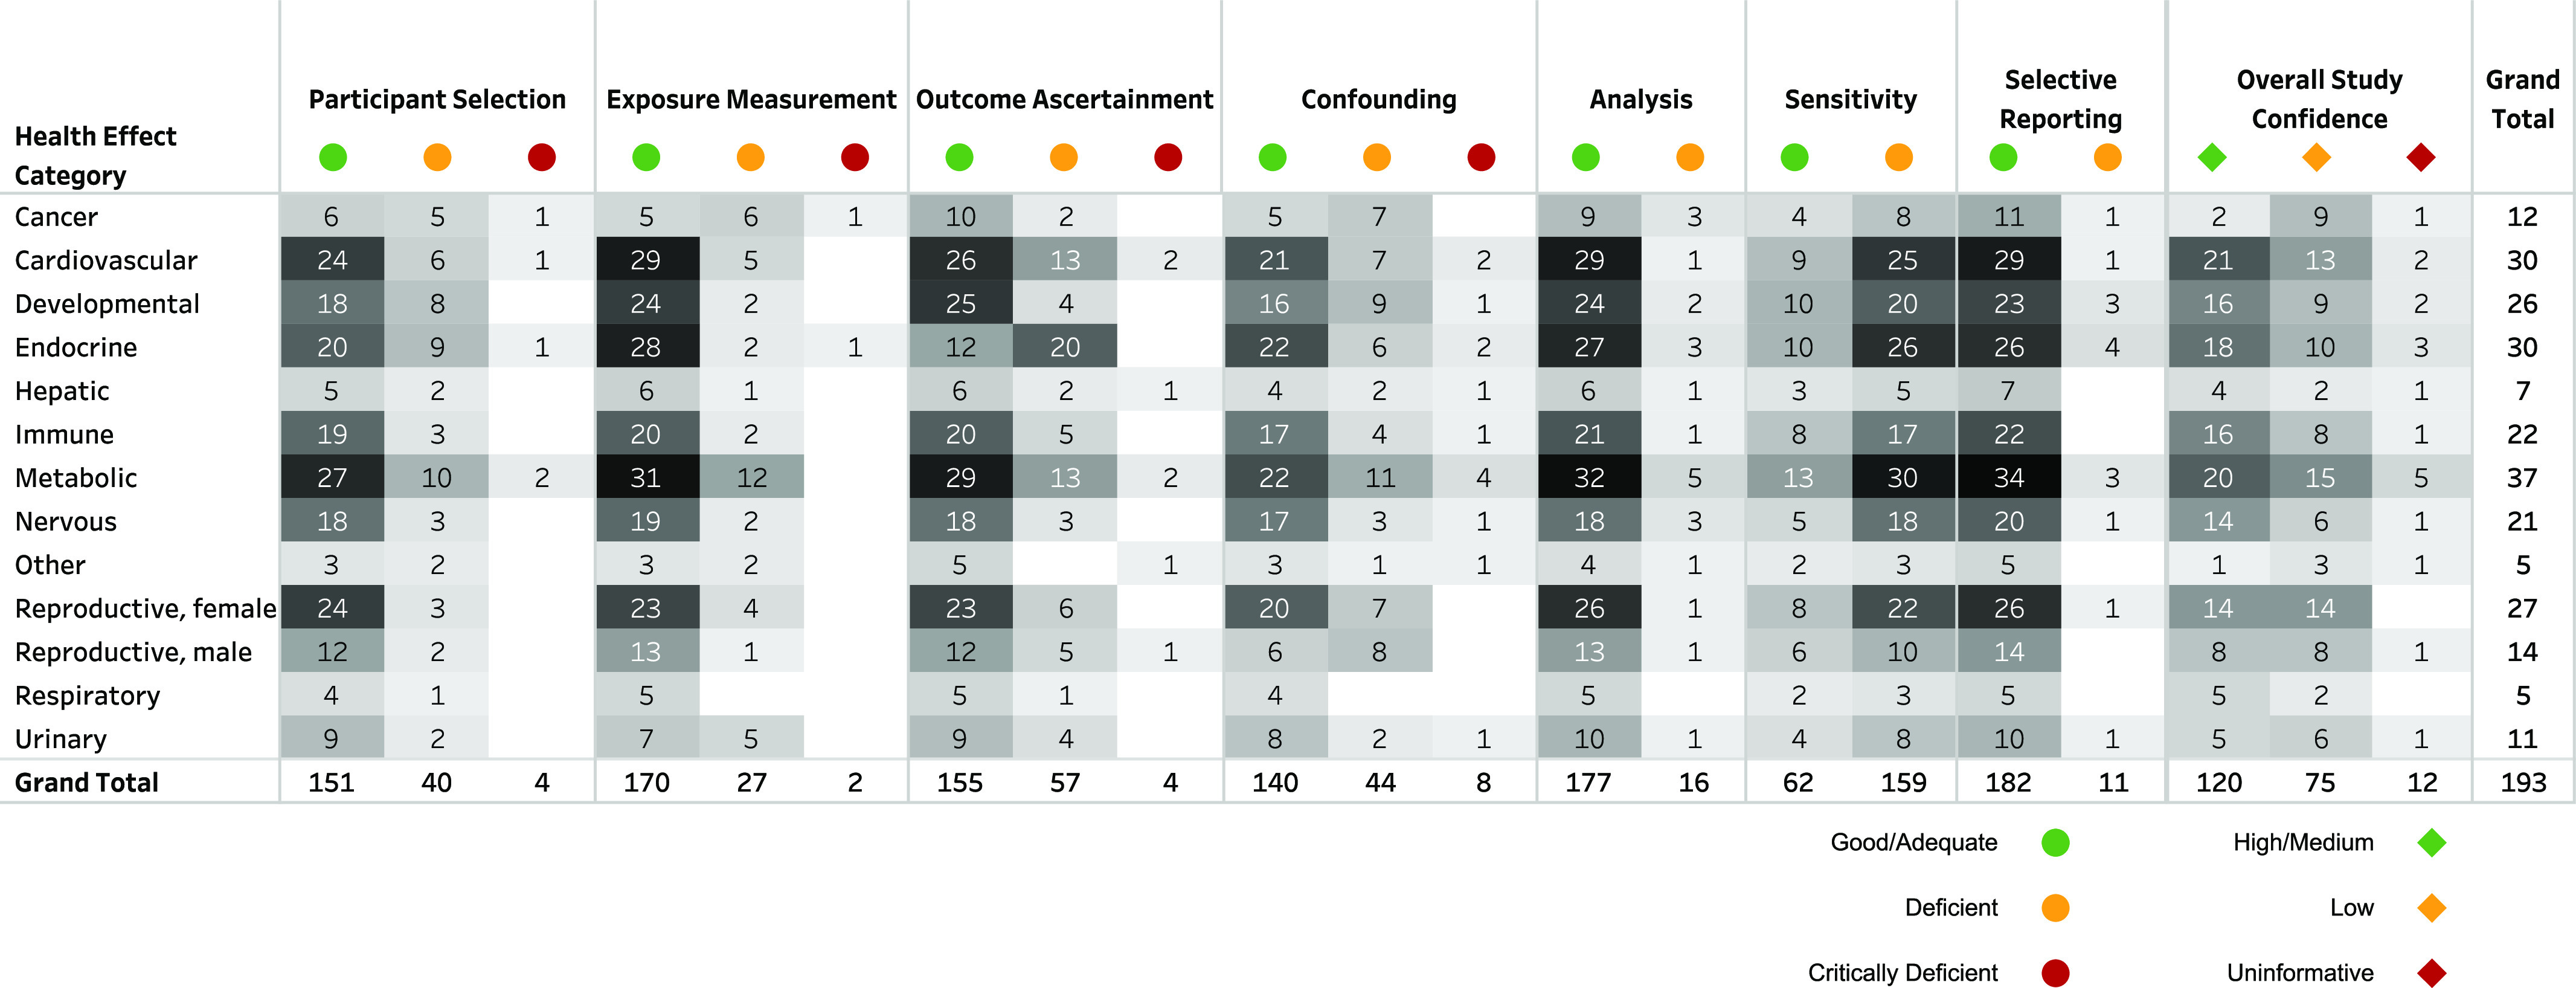
Results: 193 epidemiology studies were identified, which included information on 15 of the PFAS of interest. The most commonly studied health effect categories were metabolic (n=37), endocrine (n=30), cardiovascular (30), female reproductive (n=27), developmental (n=26), immune (n=22), nervous (n=21), male reproductive (n=14), cancer (n=12), and urinary (n=11) effects. In study evaluation, 120 (62%) studies were considered High/Medium confidence for at least one outcome.

Discussion: Most of the PFAS in this SEM have little to no epidemiology data available to inform evaluation of potential health effects. Although exposure to the 15 PFAS that had data was fairly low in most studies, these less-studied PFAS may be used as replacements for "legacy" PFAS, leading to potentially greater exposure. It is impractical to generate epidemiology evidence to fill the existing gaps for all potentially relevant PFAS. This SEM highlights some of the important research gaps that currently exist. https://doi.org/10.1289/EHP11185.


Figures

Figure 1A is a tabular representation titled Study evaluation domains having seven rows and two columns, namely, Epidemiology domain and Core question. Row 1: Exposure measurement. Does the exposure measure reliably distinguish between levels of exposure in a time window considered most relevant for a causal effect with respect to the development of the outcome? Row 2: Outcome ascertainment. Does the outcome measure reliably distinguish the presence or absence (or degree of severity) of the outcome? Row 3: Participant selection. Is there evidence that selection into or out of the study (or analysis sample) was jointly related to exposure and to outcome? [note: this includes attrition]. Row 4: Confounding. Is confounding of the effect of the exposure likely? Row 5: Analysis. Does the analysis strategy and presentation convey the necessary familiarity with the data and assumptions? Row 6: Sensitivity. Is there a concern that sensitivity of the study is not adequate to detect an effect? Row 7: Selective reporting. Is there reason to be concerned about selective reporting? Figure 1B is a tabular representation titled Domain judgments having three rows and two columns, namely, judgment and interpretation. Row 1: Good implies appropriate study conduct relating to the domain and minor deficiencies not expected to influence results. Adequate implies a study that may have some limitations relating to the domain, but they are not likely to be severe or to have a notable impact on results. Row 2: Deficient implies identified biases or deficiencies interpreted as likely to have a notable impact on the results or prevent reliable interpretation of study findings. Row 3: Critically deficient implies a serious flaw identified that makes the observes effect(s) uninterpretable. Studies with a critical deficiency will almost always be considered “uninformative” overall. Figure 1C is a tabular representation titled Overall study rating for an outcome having three rows and two columns, namely, Rating and Interpretation. Row 1: High implies no notable deficiencies or concerns identified; potential for bias unlikely or minimal; sensitive methodology. Medium implies possible deficiencies or concerns noted but resulting bias or lack of sensitivity is unlikely to be a notable degree. Row 2: Low implies deficiencies or concerns were noted, and the potential for substantive bias or inadequate sensitivity could have a significant impact on the study results or their interpretation. Row 3: Uninformative implies serious flaw(s) makes study results unusable for hazard identification or dose response.
Figure 1.
Summary of study evaluation approach for systematic evidence map. (A) evaluation domains. (B) domain judgments and interpretations. (C) overall study confidence ratings and interpretations. Note: Adapted from Office of Research and Development (ORD) Staff Standard Operating Procedures for Developing Integrated Risk Information System (IRIS) Assessments. This resource provides the full description of the methods used to evaluate risk of bias and sensitivity in the included studies.
Figure 2 is a flowchart with six steps. Step 1: Literature searches for 150 per- and polyfluoroalkyl substances (September 2019, December 2020, and December 2021). PubMed: 29813 cases till September 11, 2019; 2148 cases till December 31, 2020; and 2151 cases till December 7, 2021. Web of Science: 21677 cases till September 11, 2019; 1307 cases till December 31, 2020; and 1491 cases till December 7, 2021. ToxNet has 2213 cases through September 11, 2019. Step 2: Following duplicate removal, S W I F T review was used to filter the unique references based on the software’s pre-set literature search strategies in order to identify potentially relevant references: 10458 references were identified from 40623 records from the September 2019 database searches. 1379 references were identified from 3433 records from the December 2020 update. 1397 references were identified from 3142 records from the December 2021 update. Step 3: There are 13616 record for title or abstract screening in S W I F T active where 1483 records were considered relevant or supplemental material based on S W I F T active and 11678 records were excluded, including 3907 records that were manually screened and excluded and 7771 records predicted as not relevant in S W I F T active screener (and not manually screened). Step 4: There are 1531 records identified from other sources, including 15 cases of ToxVal, 486 cases of European Chemicals Agency, 276 cases of reference list from included studies, 159 cases of identified after chemical tag updates in S W I F T review, 2 records of chemicals, environmental agents, 384 records of per- and polyfluoroalkyl substances evidence map prepared by The Endocrine Disruptor Exchange, 202 records of the Agency for Toxic Substances and Disease Registry, 1 record of technical expert, and 6 records of the United States E P A Ecotoxicology Knowledgebase. Step 5: There are 3012 records of title and abstract screen in DistillerSR, from which 930 records were excluded because they did not meet all populations, exposure, comparator, and outcome criteria; 1106 records were tagged as supplemental material; and a total of 2039 records of title and abstract were excluded or supplemental. There are 976 records of full-text screen in DistillerSR from which 168 records were excluded, including 132 records were not relevant exposure, 32 records were unable to obtain full text, 4 records were wildlife studies; and 4 records had not provided the data; 471 records were tagged as supplemental material; and a total of 639 records of title and abstract were excluded or supplemental. There are 334 records of human and animal studies summarized in the literature inventory, of which 139 records are of animal studies and 195 records are of human studies. There are 193 records of human studies under study evaluation in H A W C and study data extraction in DistillerSR. Step 6: There are 1624 cases are tagged as supplemental material title and abstract screening plus full text plus inventory, including 321 records of mechanistic (including in vitro or ex vivo or in silico studies, 4 records of physiologically based pharmacokinetic, 70 records of non-mammalian model systems, 243 records of non-oral or non-inhalation route of administration, 177 records of absorption, distribution, metabolism, excretion, and toxicokinetic, 547 records of exposure characteristics (no health outcome assessment), 162 records of mixture studies, 9 case reports, 10 records of conference abstract, 213 records or other assessments with no original data, 160 records of European Chemicals Agency read-across, and 8 records of European Chemicals Agency presumed duplicate.
Figure 2.
Literature flow diagram for systematic evidence map of epidemiology studies for 150 PFAS. Note: Literature identified in other sources was brought into screening at DistillerSR title-abstract review. References may have multiple supplemental tags. Two human studies did not proceed to study evaluation and data extraction because they were represented by other included studies. ADME, absorption, distribution, metabolism, excretion; ATSDR, Agency for Toxic Substances and Disease Registry; ECHA, European Chemicals Agency; ECOTOX, U.S. Environmental Protection Agency Ecotoxicology Knowledgebase; HAWC, Health Assessment Workspace Collaborative; NTP, National Toxicology Program Chemical Effects in Biological Systems; PBPK, physiologically based pharmacokinetic; PECO, populations, exposure, comparator, outcome criteria; TEDX, PFAS evidence map prepared by The Endocrine Disruptor Exchange; TIAB, title/abstract screening; ToxVal, U.S. Environmental Protection Agency CompTox Chemicals Dashboard; WoS, Web of Science.
Figure 3 is a screenshot of webpage, depicting interactive dashboard for systematic evidence map of epidemiology studies for 150 per- and polyfluoroalkyl substances. On the top-left, a tabular representation titled Overview of Epidemiological evidence base, having fourteen rows and seven columns, namely health effect category and population divided into adults, adults and children, children less than 18 years, occupational, pregnant women, and grand total. It is possible to expand health effect category to show the specific outcomes. Row 1: Cancer, 9, 1, 2, and 12. Row 2: Cardiovascular, 13, 7, 4, 1, 5, and 30. Row 3: Development, 6, 19, 1, and 26. Row 4: Endocrine, 6, 8, 6, 1, 9, and 30. Row 5: Hepatic, 5, 1, 1, and 7. Row 6: Immune, 1, 3, 17, 1, and 22. Row 7: Metabolic, 19, 4, 5, 1, 8, and 37. Row 8: Nervous, 2, 11, 8, and 21. Row 9: Other, 3, 1, 1, and 5. Row 10: Reproductive, female; 9; 2; 5; 1; 10; and 27. Row11: Reproductive, male; 8; 2; 3; 1; and 14. Row 12: Respiratory, 5, and 5. Row 13: Urinary, 9, 1, 1, and 11. Row 14: grand total, 64, 35, 61, 2, 31, and 193. Below, another tabular representation titled Epidemiological study details having a row for each study and effect estimate and ten columns, namely, Reference, Chemical, Sub-population, Outcome, Measured effect or endpoints, uppercase n, comparison, effect estimate, confidence interval lower confidence limits, and confidence interval upper confidence limits. On the top-right, a drop-down option is given for chemical abstracts service- registry number and outcome. Below, a list of chemicals, references, exposure measure, and study design is given. At the bottom, a horizontal bar graph titled overall study confidence plots uninformative, low, and high or medium (y-axis) across number of studies (x-axis).
Figure 3.
Screenshot of interactive dashboard for systematic evidence map of epidemiology studies for 150 PFAS. The interactive dashboard is available at https://hawcprd.epa.gov/summary/visual/assessment/100500085/Epidemiological-Studies-and-Study-Confidence/. The results are filterable by PFAS, health effect category, population, exposure measure, study design, overall study confidence, and reference by clicking on the relevant cell.
Figure 4 is a heatmap plotting Health effect category, including Metabolic; Cardiovascular; Endocrine; Reproductive, female; Developmental; Immune; Nervous; Reproductive, male; Cancer; Urinary; Hepatic; Other; Respiratory; and Grand total (y-axis) across Chemical, including Perfluoroundecanoic acid, Perfluoroheptanoic acid, Perfluoroheptanesulfonate and perfluoroheptanesulfonic acid, Perfluorooctanesulfonamide, Perfluorotridecanoic acid, Perfluorotetradecanoic acid, Perfluoropentanoic acid, Perfluoropropanoic acid, Sodium perfluorodecanesulfonate, Perfluorooctanesulfonyl fluoride, 8:2 fluorotelomer alcohol, N-ethyl-N-(2-hydroxyethyl)perfluorooctanesulfonamide, Perfluoro-2,5,dimethyl-3,6-dioxanonanoic acid, Trifluoroacetic acid, and Grand total (x-axis).
Figure 4.
Heat map of number of studies by health effect category and PFAS. In the interactive dashboard (https://hawcprd.epa.gov/summary/visual/assessment/100500085/Epidemiological-Studies-and-Study-Confidence/), the number of studies by health effect category and/or PFAS can be obtained by clicking on the cell to filter by. This information can also be obtained by filtering Excel Table S4. Note: 8:2-FTOH, 8:2 fluorotelomer alcohol; PFDDA, perfluoro-2,5,dimethyl-3,6-dioxanonanoic acid; PFDeS, sodium perfluorodecanesulfonate; PFHpA, perfluoroheptanoic acid; PFHpS, perfluoroheptanesulfonate and perfluoroheptanesulfonic acid; PFUnDA, perfluoroundecanoic acid; PFOSA, perfluorooctanesulfonamide; PFTrDA, perfluorotridecanoic acid; PFTeDA, perfluorotetradecanoic acid; PFPeA, perfluoropentanoic acid; PFPpA, perfluoropropanoic acid; POSF, perfluorooctanesulfonyl fluoride; NEtFOSE, N-ethyl-N-(2-hydroxyethyl)perfluorooctanesulfonamide; TFA, trifluoroacetic acid.
Figure 5 is a heatmap plotting Health effect category, including Cancer; Cardiovascular; Developmental’ Endocrine; Hepatic; Immune; Metabolic; Nervous; Other; Reproductive, female; Reproductive, male; Respiratory; Urinary; and Grand total (y-axis) across participant selection, exposure measurement, outcome ascertainment, confounding, analysis, sensitivity, selective reporting, overall study confidence, and grand total (x-axis) for good or adequate, deficient, critically deficient, high or medium, low, and uninformative.
Figure 5.
Summary of study evaluations by domain and health effect category. In the interactive dashboard (https://hawcprd.epa.gov/summary/visual/assessment/100500085/Epidemiological-Studies-and-Study-Confidence/, “Study Confidence Summary” tab), each domain/overall confidence rating and rationale is available, filterable by PFAS, health effect category, outcome, and rating. This information is also available in Excel Tables S4 and S5. Note: PFAS, per- and polyfluoroalkyl substances.

Similar articles

Cited by

References

    1. U.S. Centers for Disease Control and Prevention. 2019. Fourth National Report on Human Exposure to Environmental Chemicals, Updated Tables, January 2019, vol. 2. Atlanta, GA: U.S. Department of Health and Human Services.
    1. U.S. EPA (U.S. Environmental Protection Agency). 2016. Health effects support document for perfluorooctanoic acid (PFOA). Washington, DC: U.S. Environmental Protection Agency, Office of Water, Health and Ecological Criteria Division.
    1. U.S. EPA. 2021. Risk management for per- and polyfluoroalkyl substances (PFAS) under TSCA. https://www.epa.gov/assessing-and-managing-chemicals-under-tsca/risk-man... [accessed 1 March 2022].
    1. U.S. EPA. CompTox Chemicals Dashboard: PFAS Master List of PFAS Substances (Version 4). https://comptox.epa.gov/dashboard/chemical_lists/PFASMASTER [accessed 8 August 2021].
    1. Wang Z, DeWitt JC, Higgins CP, Cousins IT. 2017. A never-ending story of per- and polyfluoroalkyl substances (PFASs)? Environ Sci Technol 51(5):2508–2518, PMID: , 10.1021/acs.est.6b04806. - DOI - PubMed

Publication types