Underweight, overweight or obesity, diabetes, and hypertension in Bangladesh, 2004 to 2018
- PMID: 36178894
- PMCID: PMC9524627
- DOI: 10.1371/journal.pone.0275151
Underweight, overweight or obesity, diabetes, and hypertension in Bangladesh, 2004 to 2018
Abstract
Background and objectives: Bangladesh is experiencing a nutrition transition with an increase in the double burden of malnutrition and non-communicable diseases (NCDs). This study sought to: 1) examine trends and differences in underweight, overweight/obesity, hypertension and diabetes by gender, area of residence, and wealth in Bangladesh from 2004 to 2018, 2) assess what factors contributed to changes in these outcomes.
Methods: We used data from five rounds of the Bangladesh Demographic and Health Surveys (n = 76,758 women 15-49y and 10,900 men 18-95y in total). We calculated differences, slope index of inequality (SII) and concentration index (CIX) to examine trends over time and differences in outcomes by wealth and residence. We identified determinants and estimated drivers of changes in outcomes using regression-based decomposition.
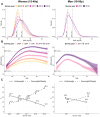
Results: Between 2004 and 2018, underweight prevalence decreased in both women (33% to 12%) and men (26% to 18%), whereas overweight/obesity increased (17% to 49% in women and 21% to 34% in men). Hypertension also increased in both women (31% to 44%) and men (19% to 33%) while diabetes changed marginally (11% to 14%). In all years, underweight was concentrated in poorer and rural households while overweight/obesity, diabetes and hypertension were concentrated in wealthier and urban households. Wealth inequity decreased over time for underweight, changed little for overweight/obesity, and increased for hypertension and diabetes among men. Increases in wealth explained 35% to 50% of the reduction in underweight and 30% to 57% of the increase in overweight/obesity.
Conclusion: Our findings imply that double duty actions are required to sustain the decrease in undernutrition and slow the increase in overweight/obesity and NCDs across diverse socioeconomic sections of the population in Bangladesh.
Conflict of interest statement
The authors have declared that no competing interests exist.
Figures


Similar articles
-
The double burden of malnutrition in India: Trends and inequalities (2006-2016).PLoS One. 2021 Feb 25;16(2):e0247856. doi: 10.1371/journal.pone.0247856. eCollection 2021. PLoS One. 2021. PMID: 33630964 Free PMC article.
-
Double burden of malnutrition among ever-married women in Bangladesh: a pooled analysis.BMC Womens Health. 2019 Jan 31;19(1):24. doi: 10.1186/s12905-019-0725-2. BMC Womens Health. 2019. PMID: 30704454 Free PMC article.
-
Malnutrition and non-communicable diseases among Bangladeshi women: an urban-rural comparison.Nutr Diabetes. 2017 Mar 20;7(3):e250. doi: 10.1038/nutd.2017.2. Nutr Diabetes. 2017. PMID: 28319102 Free PMC article.
-
Fertility is a key predictor of the double burden of malnutrition among women of child-bearing age in sub-Saharan Africa.J Glob Health. 2020 Dec;10(2):020423. doi: 10.7189/jogh.10.020423. J Glob Health. 2020. PMID: 33110582 Free PMC article. Review.
-
Double Burden of Underweight and Overweight among Women in South and Southeast Asia: A Systematic Review and Meta-analysis.Adv Nutr. 2020 Jan 1;11(1):128-143. doi: 10.1093/advances/nmz078. Adv Nutr. 2020. PMID: 31634389 Free PMC article.
Cited by
-
Trends in body mass index, nutrient intake and nutritional status of rural adults in India: National Nutrition Monitoring Bureau survey findings (1975-2012).BMC Public Health. 2025 Aug 26;25(1):2929. doi: 10.1186/s12889-025-23731-y. BMC Public Health. 2025. PMID: 40859189 Free PMC article.
-
Association of Triglyceride-Glucose Index and Liver Function Parameters Among Healthy Obese Civil Servants: A Center-Based Study.Diabetes Metab Syndr Obes. 2022 Nov 14;15:3519-3531. doi: 10.2147/DMSO.S392544. eCollection 2022. Diabetes Metab Syndr Obes. 2022. PMID: 36407008 Free PMC article.
-
The prevalence and factors associated with obesity and hypertension in university academic staff: a cross-sectional study in Bangladesh.Sci Rep. 2023 May 5;13(1):7309. doi: 10.1038/s41598-023-34574-1. Sci Rep. 2023. PMID: 37147438 Free PMC article.
-
Designing Front-of-Package Labels to Inform Consumers and Encourage Healthier Food Choices in Bangladesh: A Qualitative Study.Nutrients. 2024 Nov 21;16(23):3989. doi: 10.3390/nu16233989. Nutrients. 2024. PMID: 39683383 Free PMC article.
-
Global burden of cancer attributable to high BMI (1990-2031): a multidimensional analysis based on GBD and Mendelian randomization.Front Nutr. 2025 Aug 5;12:1618799. doi: 10.3389/fnut.2025.1618799. eCollection 2025. Front Nutr. 2025. PMID: 40837436 Free PMC article.
References
-
- Pirlea AF, Serajuddin U, Wadhwa D, Welch M, Whitby A. Atlas of the Sustainable Development Goals 2020: From World Development Indicators. Washington, DC: World Bank. https://datatopics.worldbank.org/sdgatlas/. License: Creative Commons Attribution CC BY 3.0 IGO. 2020.
-
- NCD Risk Factor Collaboration. Trends in adult body-mass index in 200 countries from 1975 to 2014: a pooled analysis of 1698 population-based measurement studies with 19.2 million participants. Lancet. 2016;387(10026):1377–96. Epub 2016/04/27. doi: 10.1016/S0140-6736(16)30054-X . - DOI - PMC - PubMed
-
- WHO. Noncommunicable diseases. https://www.who.int/news-room/fact-sheets/detail/noncommunicable-diseases. Acessed August 29, 2021. 2020.
Publication types
MeSH terms
LinkOut - more resources
Full Text Sources
Medical

