. 2022 Sep 30;18(9):e1010372.
doi: 10.1371/journal.pgen.1010372. eCollection 2022 Sep.

Widespread employment of conserved C. elegans homeobox genes in neuronal identity specification

Affiliations

Widespread employment of conserved C. elegans homeobox genes in neuronal identity specification

Molly B Reilly et al. PLoS Genet. .

Abstract

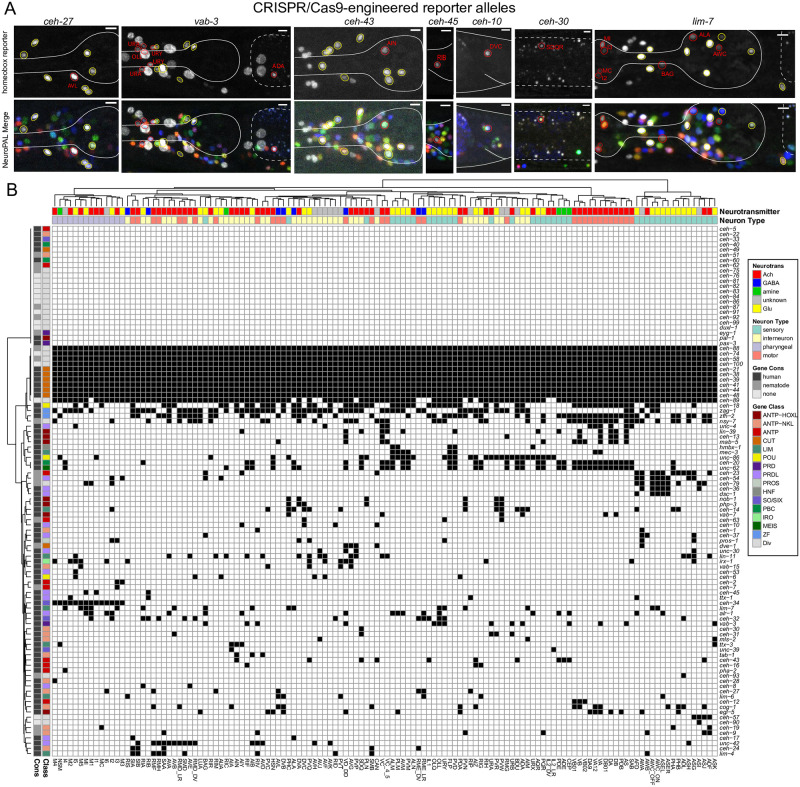
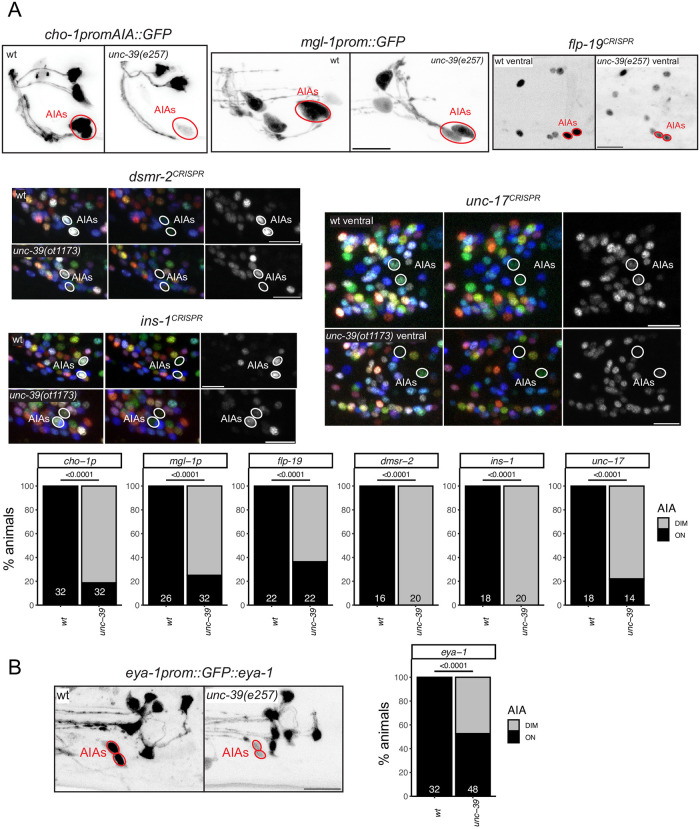
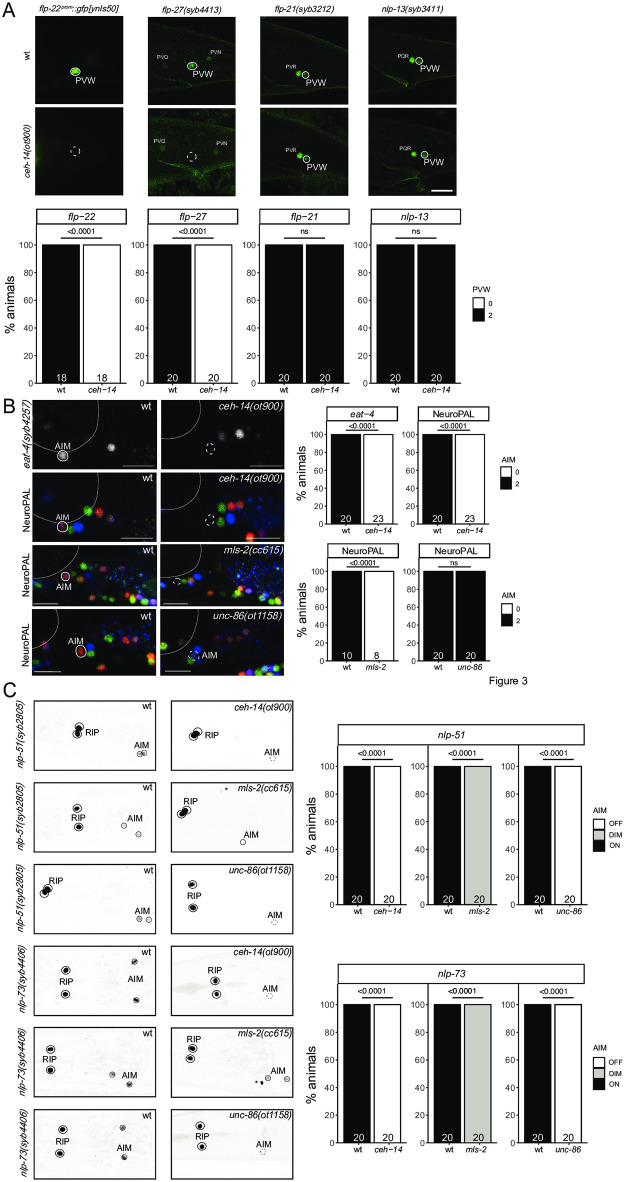
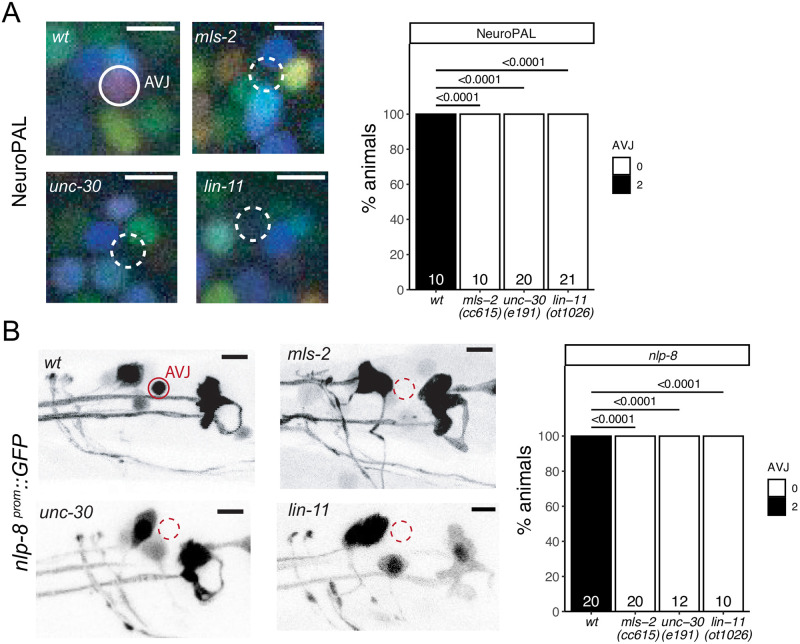
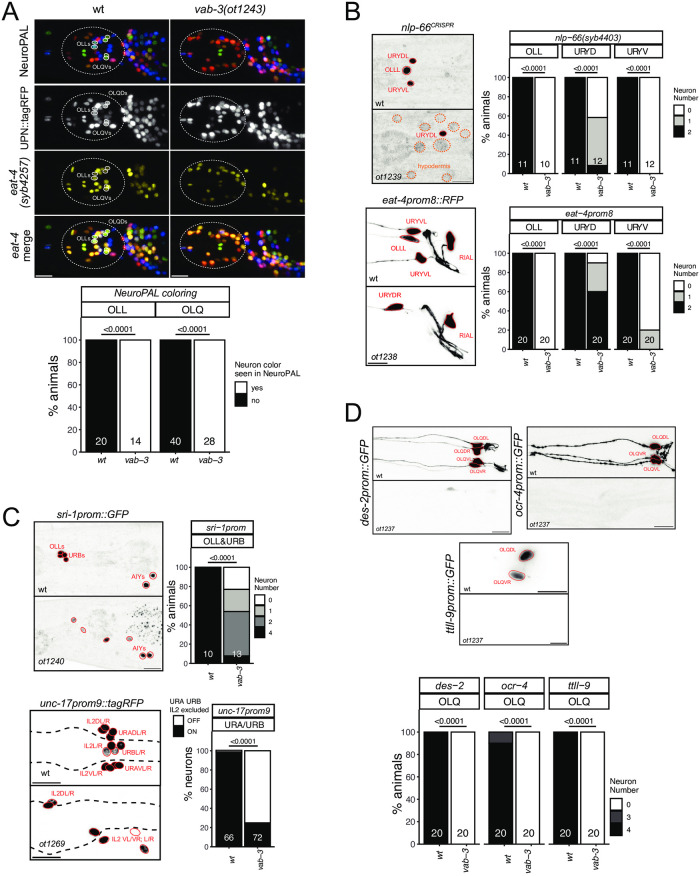
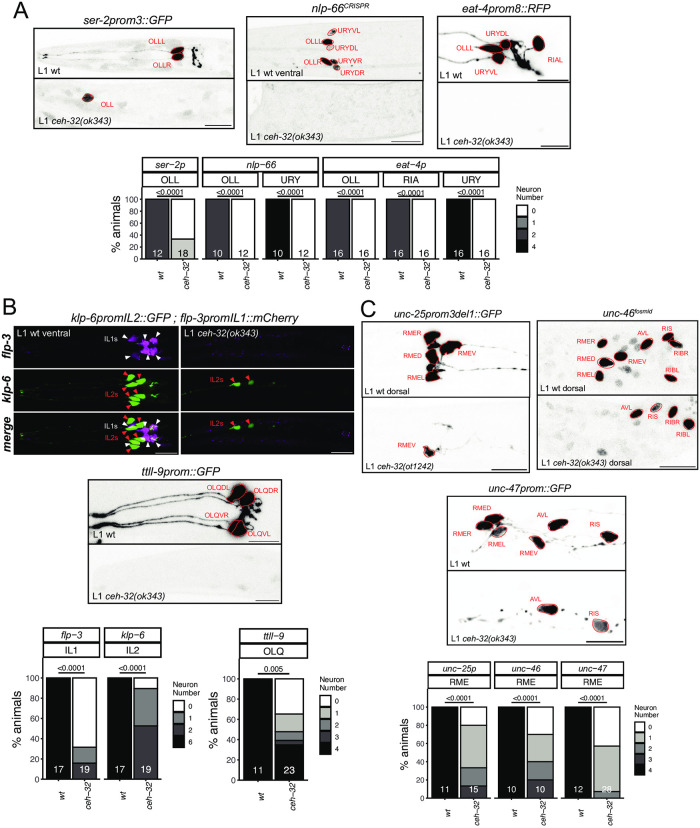
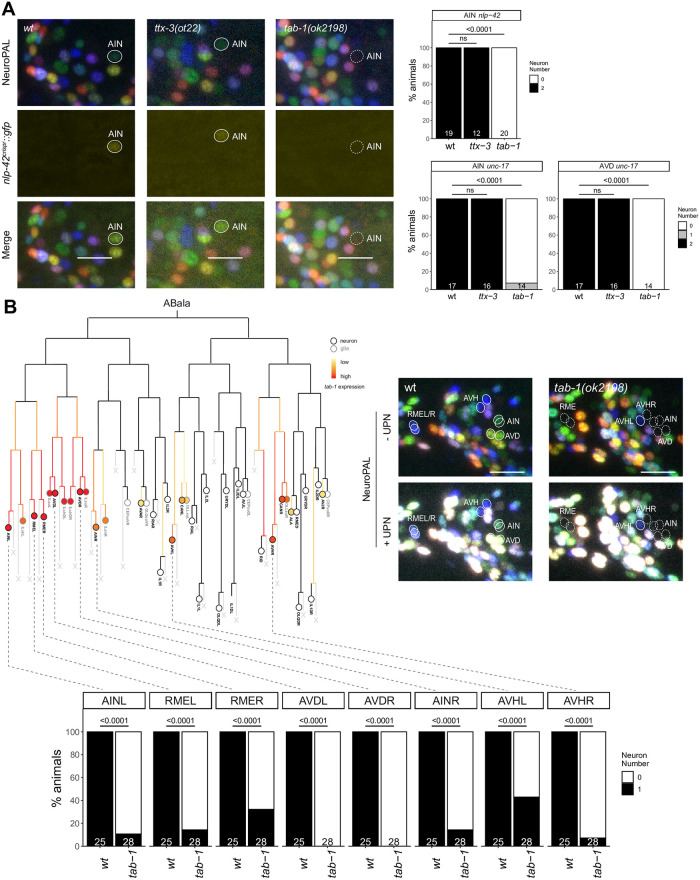
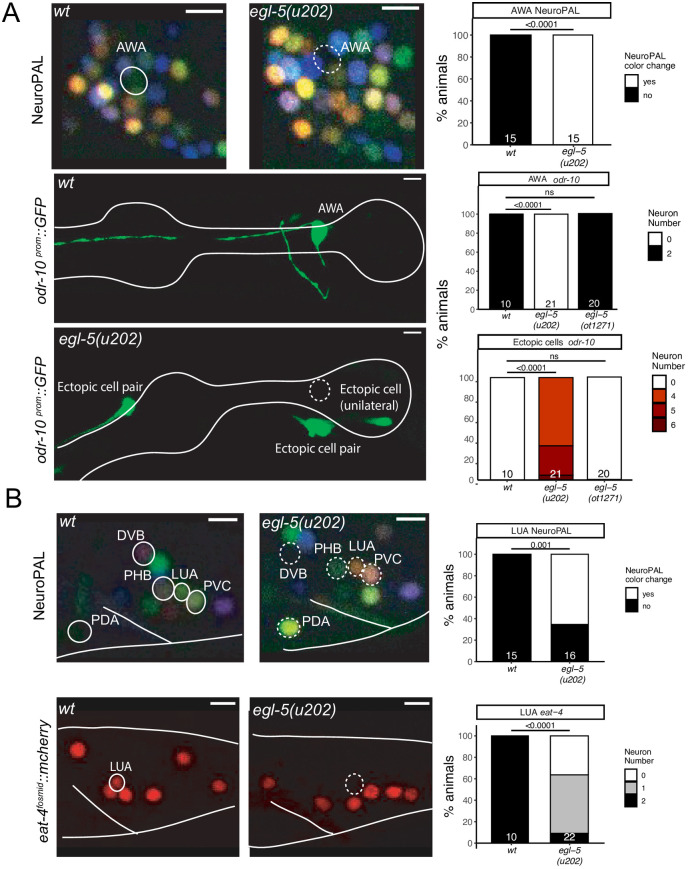
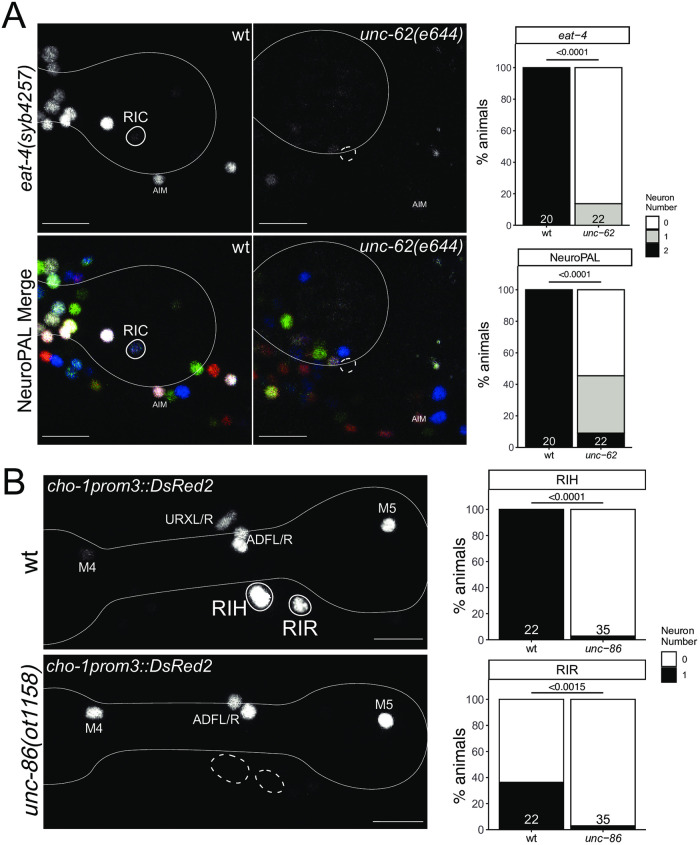
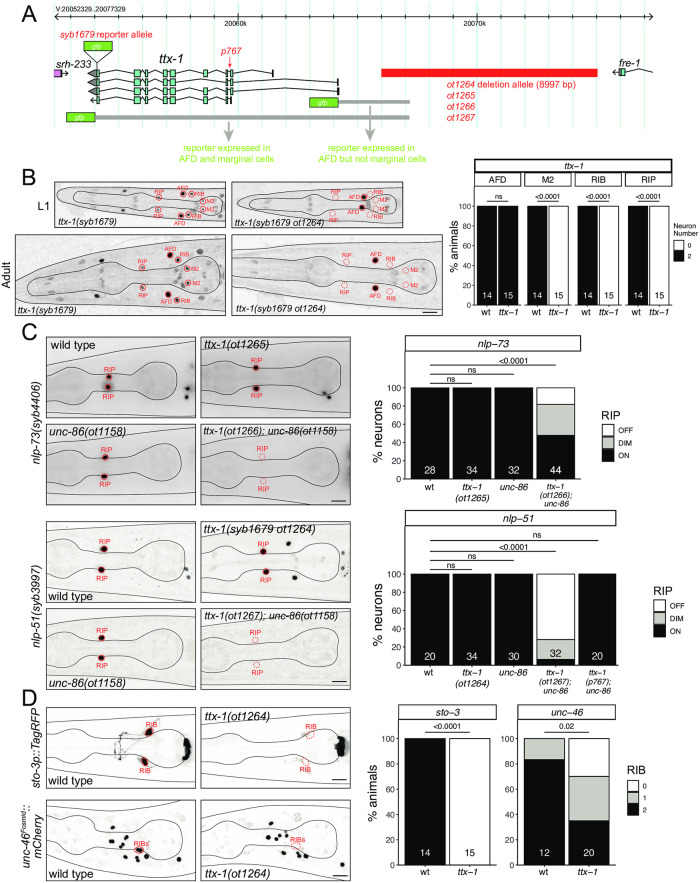
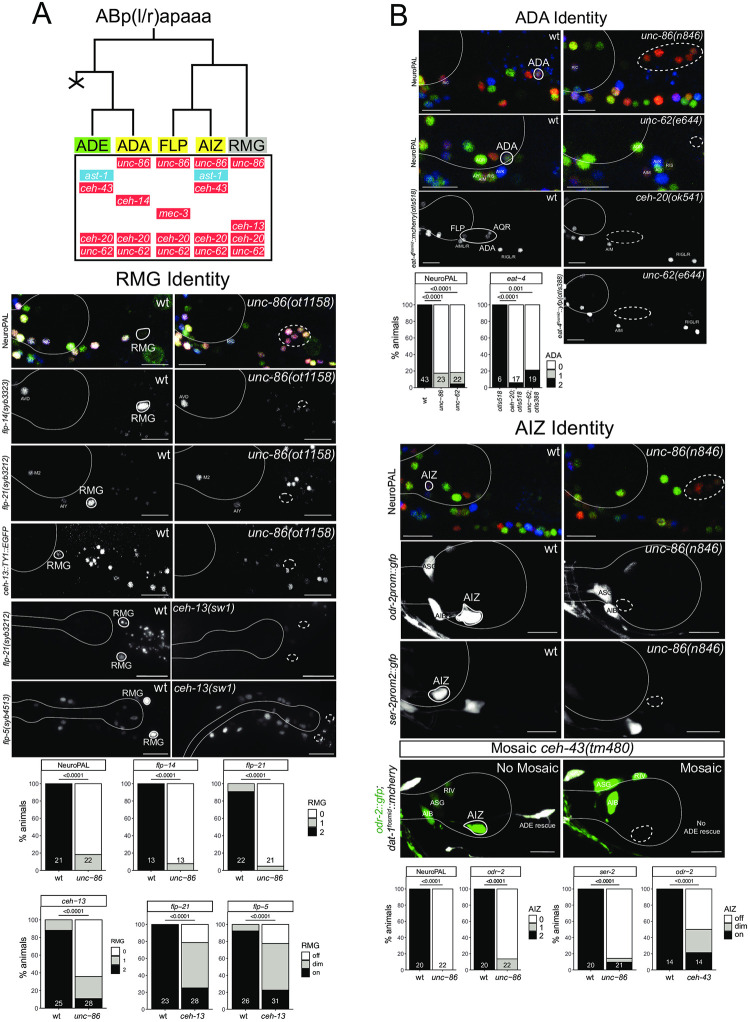
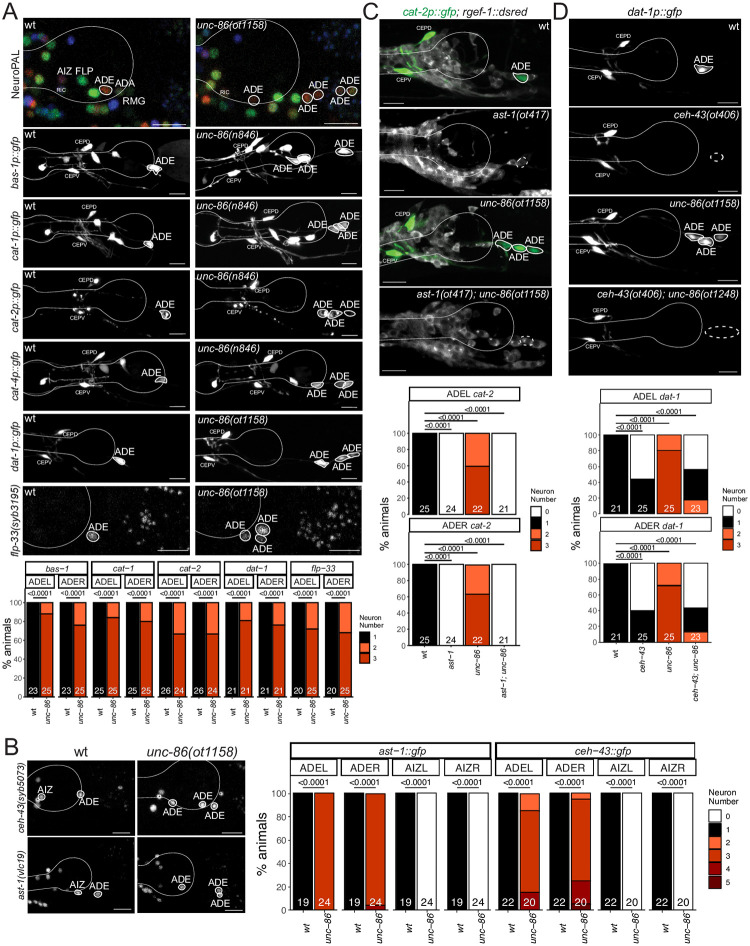
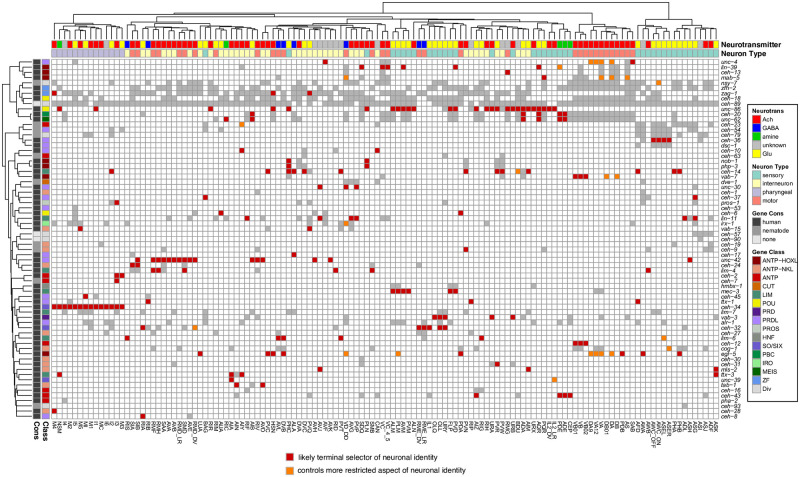
Homeobox genes are prominent regulators of neuronal identity, but the extent to which their function has been probed in animal nervous systems remains limited. In the nematode Caenorhabditis elegans, each individual neuron class is defined by the expression of unique combinations of homeobox genes, prompting the question of whether each neuron class indeed requires a homeobox gene for its proper identity specification. We present here progress in addressing this question by extending previous mutant analysis of homeobox gene family members and describing multiple examples of homeobox gene function in different parts of the C. elegans nervous system. To probe homeobox function, we make use of a number of reporter gene tools, including a novel multicolor reporter transgene, NeuroPAL, which permits simultaneous monitoring of the execution of multiple differentiation programs throughout the entire nervous system. Using these tools, we add to the previous characterization of homeobox gene function by identifying neuronal differentiation defects for 14 homeobox genes in 24 distinct neuron classes that are mostly unrelated by location, function and lineage history. 12 of these 24 neuron classes had no homeobox gene function ascribed to them before, while in the other 12 neuron classes, we extend the combinatorial code of transcription factors required for specifying terminal differentiation programs. Furthermore, we demonstrate that in a particular lineage, homeotic identity transformations occur upon loss of a homeobox gene and we show that these transformations are the result of changes in homeobox codes. Combining the present with past analyses, 113 of the 118 neuron classes of C. elegans are now known to require a homeobox gene for proper execution of terminal differentiation programs. Such broad deployment indicates that homeobox function in neuronal identity specification may be an ancestral feature of animal nervous systems.


Conflict of interest statement

The authors have declared that no competing interests exist.

Figures

Fig 1
Fig 1. Updated expression of the homeobox gene family with reporter alleles.
Fig 1A: Representative images of homeobox reporter alleles, generated by CRISPR/Cas9 genome engineering (see strain list in S5 Table) with different expression than previously reported fosmid-based reporter transgenes. Neuron classes showing expression not previously noted were identified by overlap with the NeuroPAL landmark strain, and are outlined and labeled in red. Neuron types in agreement with previous reporter studies are outlined in yellow. Head structures including the pharynx were outlined in white for visualization. Autofluorescence common to gut tissue is outlined with a white dashed line. An n of 10 worms were analyzed for each reporter strain. Scale in bottom or top right of the figure represents 5 μm. See also S1 Fig for more information on ceh-30 and ceh-31. Fig 1B: Summary of expression of all homeobox genes across the C. elegans nervous system, taking into account new expression patterns from panel A and all previously published data [6]. Black boxes indicate that a homeodomain transcription factor is expressed in that given neuron type and white boxes indicate that a homeodomain transcription factor is not expressed in that given neuron type. Neuron types along the x axis are clustered by transcriptomic similarity using the Jaccard index (see methods) and homeobox genes along the y axis are clustered similarly by their similar expression profiles in shared neuron types. See S3 Fig for numerical representation of homeoboxes per neuron.
Fig 2
Fig 2. unc-39 controls differentiation of the AIA interneuron class.
unc-39R203Q mutant animals (either canonical e257 allele or CRISPR/Cas9 genome engineered ot1173 allele with identical nucleotide change) were analyzed. Fig 2A: unc-39 affects the cholinergic identity of the AIA interneuron class (unc-17 reporter allele syb4491 and a cho-1 promoter fragment which is part of the otIs653 array), and other AIA terminal identity markers: reporter alleles dmsr-2(syb4514), ins-1(syb5452) and flp-19(syb3278), and a mgl-1 promoter fragment otIs327. We did not quantify changes in AIA in the NeuroPAL color code, because it is variable in wild type. Representative images of wild type and mutant worms are shown with 10 μm scale bars. Graphs compare expression in wild type and mutant worms with the number of neurons examined listed at the bottom of the bar. P-values were calculated by Fisher’s exact test. Fig 2B: unc-39 affects the expression of the tagged eya-1 locus (nIs352 transgene) in AIA.
Fig 3
Fig 3. ceh-14 affect differentiation of several neuron classes, in combination with different homeobox genes.
Fig 3A: ceh-14(ot900) mutant animals show a loss of neuropeptide-encoding gene expression in PVW, including a promoter fusion reporter transgene for flp-22 (ynIs50) and a flp-27 CRISPR reporter (syb4413), while expression of the neuropeptide CRISPR reporters for flp-21 (syb3212) and nlp-13 (syb3411) is unaffected. Neuron of interest is outlined in solid white when expressing wildtype reporter colors, and dashed white when one or all colors are lost. Representative images of wild type and mutant worms are shown with 10 μm scale bar. Graphs compare expression in wild type and mutant worms with the number of animals examined listed at the bottom of the bar. P-values were calculated by Fisher’s exact test. Fig 3B: ceh-14(ot900) mutant animals show a loss of AIM marker expression, including an eat-4 CRISPR reporter (syb4257) and NeuroPAL (otIs669) in AIM. Additionally, unc-86(ot1158) as well as mls-2(cc615) mutant animals show expression defects of NeuroPAL (otIs669) in AIM. Neuron of interest is outlined in solid white when expressing wildtype reporter colors, and dashed white when one or all colors are lost. Representative images of wild type and mutant worms are shown with 10 μm scale bars. Graphs compare expression in wild type and mutant worms with the number of animals examined listed at the bottom of the bar. P-values were calculated by Fisher’s exact test. Fig 3C: ceh-14(ot900) and unc-86(ot1158) mutant animals show a loss of neuropeptide-encoding gene expression in AIM using the CRISPR/Cas9-engineered reporter alleles nlp-51(syb2805) and nlp-73(syb4406). mls-2(cc615) mutant animals diminish, but do not extinguish expression in of nlp-51(syb2805) and nlp-73(syb4406) in AIM. Expression in RIP is unaffected by ceh-14(ot900), unc-86(ot1158), and mls-2(cc615). Neurons are outlined in solid black and a dashed black line represents loss of expression. Asterisks indicate ectopic expression of unidentified neurons. Graphs compare expression in wild type and mutant worms (on vs off or on vs dim) with the number of animals examined listed at the bottom of the bar. P-values were calculated by Fisher’s exact test.
Fig 4
Fig 4. Three homeobox genes control the identity of the AVJ neuron class.
Fig 4A: mls-2 (cc615), unc-30 (e191) and lin-11(ot1026) mutant animals show defects in the expression of NeuroPAL (otIs669) in AVJ. Neuron of interest is outlined in solid white when expressing wildtype reporter colors, and dashed white when one or all colors are lost. Representative images of wildtype and mutant worms are shown with 5 μm scale bars. Graphs compare expression in wildtype worms with the number of animals examined listed at the bottom of the bar. P-values were calculated by Fisher’s exact test. Fig 4B: mls-2 (cc615), unc-30 (e191) and lin-11(ot1026) mutant animals show defects in the expression of an nlp-8 reporter transgene (otIs711) in AVJ. Neuron of interest is outlined in solid red when expressing wildtype reporter colors, and dashed red when one or all colors are lost. Representative images of wildtype and mutant worms are shown with 5 μm scale bars. Graphs compare expression in wildtype worms with the number of animals examined listed at the bottom of the bar. P-values were calculated by Fisher’s exact test.
Fig 5
Fig 5. The Eyeless/Pax6 ortholog vab-3 controls the identity of neurons in the anterior ganglion.
Fig 5A: In a vab-3(ot1243) mutant allele, many neurons in the anterior ganglion lose their NeuroPAL coloring (from otIs669) and expression of the eat-4 reporter allele (syb4257). Notably, there are much less blue neurons (URY/URA/URB but URX seem present), and the bright green OLQ and turquoise OLL are never seen. Representative images of wild type and mutant worms are shown with 10 μm scale bars. Graphs compare expression in wild type and mutant worms with the number of neurons (for n = 10 WT worms / 7 vab-3 mutant) examined listed at the bottom of the bar. P-values were calculated by Fisher’s exact test. Similar results were observed with a larger deletion allele, ot1269 (S7 Fig). Fig 5B: In vab-3 mutant worms (ot1239, ot1238, all carrying the same lesion, introduced into respective reporter background; S7 Fig), the OLL and URYmarkers nlp-66(syb4403), eat-4prom8 (otIs521) are affected. Markers are more frequently lost in the ventral URY than the dorsal URY. vab-3 mutants also ectopically express nlp-66 in hypodermal cells. Representative images of wild type and mutant worms are shown with 10 μm scale bars. Graphs compare expression in wild type and mutant worms with the number of animals examined listed at the bottom of the bar. P-values were calculated by Fisher’s exact test. Fig. 5C: In vab-3 mutant worms (ot1240, ot1269; S7 Fig), URA and URB identities are affected as seen with the markers sri-1 (otIs879) (URB, OLL) and a promoter fragment of unc-17/VAchT (prom9; otEx7705) [105] expressed in IL2/URA/URB. Representative images of wild type and mutant worms are shown with 10 μm scale bars. Graphs compare expression in wild type and mutant worms with the number of animals (sri-1) or neurons (unc-17prom9) examined listed at the bottom of the bar. vab-3 does not affect expression of an unc-17 reporter allele in the IL2 neurons, and we can therefore infer that the remaining positive cells labeled with unc-17prom9, are the IL2 neurons and the lost expression is in URA/URB. P-values were calculated by Fisher’s exact test. Fig 5D: Markers of OLQ neuron identity (ocr-4 kyEx581, ttll-9 otIs850 and des-2 otEx7697) are fully lost in the vab-3(ot1237) mutant animals. Representative images of wild type and mutant worms are shown with 10 μm scale bars. Graphs compare expression in wild type and mutant worms with the number of animals examined listed at the bottom of the bar. P-values were calculated by Fisher’s exact test.
Fig 6
Fig 6. The SIX3/6 ortholog ceh-32 controls the identity of neurons in the anterior ganglion.
Fig 6A: In ceh-32(ok343) null mutant animals, OLL, URY but also RIA markers are almost always lost (ser-2prom3 otIs138, nlp-66(syb4403), eat-4prom8 otIs521). Fig 6B: ceh-32 also controls IL1 identity (flp-3 / otIs703 marked with white triangles), and affects neurons where it is not expressed in adults (IL2: klp-6 myIs13 marked with red triangles; OLQ: ttll-9 otIs849). Representative images of wild type and mutant worms are shown with 10 μm scale bars. Graphs compare expression in wild type and mutant worms with the number of animals examined listed at the bottom of the bar. P-values were calculated by Fisher’s exact test. Fig 6C: In ceh-32(ok343) and ceh-32(ot1242) null mutant animals, the GABAergic identity of all RME classes is affected (unc-25prom3del1 otIs837, unc-47 oxIs12, unc-46 fosmid otIs568). ceh-32 is expressed in adults in both RME and RIB, but ceh-32 loss did not affect RIB identity (unc-46 otIs568). Representative images of wild type and mutant worms are shown with 10 μm scale bars. Graphs compare expression in wild type and mutant worms with the number of animals examined listed at the bottom of the bar. P-values were calculated by Fisher’s exact test.
Fig 7
Fig 7. tab-1 regulates the differentiation of various neurons in the ABala lineage.
Fig 7A: In tab-1(ok2198) mutants, expression of both nlp-42(syb3238) and NeuroPAL reporters in AIN is lost. tab-1(ok2198) mutants also showed defects in unc-17(otIs576) reporter expression in AIN and AVD. No loss of reporter expression was observed in ttx-3(ot22) mutants. Representative images of wild type and mutant worms are shown with 10 μm scale bars. Fig 7B: tab-1 is expressed in various neurons derived from the ABala lineage (adapted from Ma et al., 2021). In tab-1(ok2198) mutants, defects in NeuroPAL reporter expression, including ultrapanneuronal (UPN) reporter expression, are seen in neurons which express tab-1 embryonically. Representative images of wild type and mutant worms are shown with 10 μm scale bars. In all panels, neurons of interest are outlined in solid white when expressing wildtype reporter colors, and dashed white when one or all colors are lost. P-values were calculated by Fisher’s exact test.
Fig 8
Fig 8. The HOX gene egl-5 affects the differentiation of head and tail neurons.
Fig 8A: egl-5(u202) mutant animals show a loss of AWA marker expression, including NeuroPAL (otIs669) and an odr-10 reporter transgene (kyIs37). Representative images of wildtype and mutant worms are shown with 5 μm scale bars. Graphs compare expression in wildtype and mutant worms with the number of animals examined listed at the bottom of the bar. P-values were calculated by Fisher’s exact test. Fig 8B: egl-5(u202) mutant animals show changes in tail marker expression, including NeuroPAL (otIs669) in PDA, LUA, PVC and loss of eat-4 (otIs518) expression in LUA. Representative images of wildtype and mutant worms are shown with 5 μm scale bars. Graphs compare expression in wildtype and mutant worms with the number of animals examined listed at the bottom of the bar. P-values were calculated by Fisher’s exact test. In all panels, neurons of interest are outlined in solid white when expressing wildtype reporter colors, and dashed white when one or all colors are lost.
Fig 9
Fig 9. Ring interneuron (RIC, RIH, RIR) differentiation defects in homeobox gene mutants.
Fig 9A: unc-62(e644) mutant animals show a loss of RIC marker expression, including an eat-4 CRISPR reporter (syb4257) and NeuroPAL (otIs669). Representative images of wild type and mutant worms are shown with 10 μm scale bars. Graphs compare expression in wild type and mutant worms with the number of animals examined listed at the bottom of the bar. P-values were calculated by Fisher’s exact test. Fig 9B: unc-86(ot1158) mutant animals show loss of RIH and RIR marker expression of an extrachromosomal cho-1prom3 reporter (otEx4530) [105]. Representative images of wild type and mutant worms are shown with 10 μm scale bars. Graphs compare expression in wild type and mutant worms with the number of animals examined listed at the bottom of the bar. In all panels, neurons of interest are outlined in solid white when expressing wildtype reporter colors, and dashed white when one or all colors are lost. P-values were calculated by Fisher’s exact test.
Fig 10
Fig 10. The OTX-type homeobox gene ttx-1 affects the differentiation of the ring interneurons RIP and RIB.
Fig 10A: ttx-1 locus showing different alleles used in this study. Fig 10B: The ttx-1(ot1264) cis-regulatory allele loses ttx-1(syb1679) expression in RIP, RIB and M2 neurons. Representative images of wild type and mutant worms at the L1 and adult stage are shown with 10 μm scale bars. Graphs compare expression in wild type and mutant worms with the number of animals examined listed at the bottom of the bar. P-values were calculated by Fisher’s exact test. Fig 10C: ttx-1 and unc-86 show synergistic effects in RIP differentiation. Representative images of nlp-73(syb4406) and nlp-51(syb3997) reporter allele expression in wild type and mutant worms are shown with 10 μm scale bars. Graphs compare expression in wild type and mutant worms with the number of neurons examined listed at the bottom of the bar. P-values were calculated by Fisher’s exact test. Fig 10D: The ttx-1(ot1264) cis-regulatory allele affects RIB differentiation. Representative images of sto-3 (otIs810) and unc-46 (otIs568) reporter transgene expression in wild type and mutant worms are shown with 10 μm scale bars. Graphs compare expression in wild type and mutant worms with the number of animals examined listed at the bottom of the bar. P-values were calculated by Fisher’s exact test.
Fig 11
Fig 11. POU, MEIS and HOX genes control neuron identity in the anterior deirid lineage.
Fig 11A: Lineage diagram depicting the generation of the anterior deirid neurons. Shown below each neuron in the lineage are the transcription factors known to be expressed in each of the respective neurons. Expression patterns for homeodomain proteins (all except AST-1) in the lineage are from [6, 91] and AST-1 is from this paper (S6 Fig). Green shading: dopaminergic neuron; yellow shading: glutamatergic neuron, grey shading: peptidergic neuron, red shading: homeobox gene, blue shading: non-homeobox gene. Fig 11B: Marker analysis in the anterior deirid lineage of wild-type and mutant animals. ADA Identity: unc-62(e644) and unc-86(n846) mutant animals show a loss of NeuroPAL (otIs669) in ADA. Additionally, unc-86(n846) mutant animals show a loss of an eat-4 fosmid reporter (otIs518) in ADA. Representative images of wild type and mutant worms are shown with 10 μm scale bars. Graphs compare expression in wild type and mutant worms with the number of animals examined listed at the bottom of the bar. P-values were calculated by Fisher’s exact test. With two different eat-4 fosmid based reporters, unc-62 and ceh-20 mutants also show differentiation defects in other neurons in the location of the anterior deirid, besides ADA (namely, FLP and AQR neurons). RMG Identity: unc-86(ot1158) mutant animals show a loss of RMG marker expression, including NeuroPAL (otIs669), a flp-14 CRISPR reporter (syb3323), a flp-21 CRISPR reporter (syb3212), and a ceh-13 fosmid reporter (wgIs756). ceh-13(sw1) mutant animals show defects in the expression of two CRISPR reporters, flp-5(syb3212) and flp-5(4513), in RMG. Representative images of wild type and mutant worms are shown with 10 μm scale bars. Graphs compare expression in wild type and mutant worms with the number of animals examined listed at the bottom of the bar. P-values were calculated by Fisher’s exact test. AIZ Identity: unc-86(n846) mutant animals show a loss of expression of NeuroPAL (otIs669) and an odr-2 reporter transgene (kyIs51) and defects in the expression of a ser-2 reporter transgene (otIs358) in AIZ. Representative images of wild type and mutant worms are shown with 10 μm scale bars. Graphs for NeuroPAL and odr-2 compare expression in wild type and mutant worms with the number of animals examined listed at the bottom of the bar. Graphs for ser-2 compare the brightness of expression (on, dim, off) in wild type and mutant worms with the number of animals examined listed at the bottom of the bar. In all panels, neurons of interest are outlined in solid white when expressing wildtype reporter colors, and dashed white when one or all colors are lost. P-values were calculated by Fisher’s exact test.
Fig 12
Fig 12. Derepression of dopaminergic terminal feature and dopaminergic regulatory signature in unc-86 mutants.
Fig 12A: unc-86(ot1158) and unc-86(n846) mutant animals ectopically express markers of ADE identity, including NeuroPAL (otIs669), reporter transgenes for genes involved in dopamine synthesis, including bas-1 (otIs226), cat-1 (otIs224), cat-2 (nIs118), cat-4(otIs225) and dat-1(vtIs1), and a flp-33 CRISPR reporter (syb3195). Representative images of wild type and mutant worms are shown with 10 μm scale bars. Graphs compare expression on the left side (ADEL) and the right side (ADER) in wild type and mutant worms with the number of animals examined listed at the bottom of the bar. Fig 12B: unc-86(ot1158) mutant animals show a derepression of CRISPR/Cas9-engineered reporter alleles of ceh-43(syb5073) and ast-1(vlc19) in cells of the anterior deirid lineage. Representative images of wild type and mutant worms are shown with 10 μm scale bars (non-neuronal expression depicted with an asterisk). Graphs compare expression on the left side (ADEL and AIZL) and the right side (ADER and AIZR) in wild type and mutant worms with the number of animals examined listed at the bottom of the bar. Fig 12C, FigD: ast-1 and ceh-43 are epistatic to unc-86. The derepression of expression of the cat-2 reporter transgene (otIs199) in unc-86(ot1158) mutant is suppressed in an ast-1(ot417) or an ast-1(ot406) mutant background. Note that both alleles are hypomorphic alleles (null alleles are lethal) [13,78]. Neurons of interest are outlined in solid white when expressing WT reporter colors, and dashed white when one or all colors are lost. Representative images of wild type and mutant worms are shown with 10 μm scale bars. Graphs compare expression on the left side (ADEL) and the right side (ADER) in wild type and mutant worms with the number of animals examined listed at the bottom of the bar. In all panels, neurons of interest are outlined in solid white when expressing wildtype reporter colors, and dashed white when one or all colors are lost and P-values were calculated by Fisher’s exact test.
Fig 13
Fig 13. Regulation of neuron identity across the C. elegans nervous system by homeodomain transcription factors.
Functional analysis of homeobox gene family, overlayed onto the homeobox expression matrix from Fig 1B. Red boxes indicate that a homeodomain transcription factor is expressed in and likely acts as a terminal selector for a given neuron type (based on extent of functional marker analysis). Orange boxes indicate that a homeodomain transcription factor has a more restricted function in a given neuron class. Gray boxes indicate that a homeodomain transcription factor is expressed in that given neuron type, but not necessarily functionally analyzed and white boxes indicate that a homeodomain transcription factor is not expressed in that given neuron type. Panneuronal and non-neuronal homeoboxes were excluded from this representation because they do not contribute to unique neuron type codes. Neuron types along the x axis are clustered by transcriptomic similarity using the Jaccard index (see methods) and homeobox genes along the y axis are clustered similarly by their similar expression profiles in shared neuron types. See S4 Table for tabular list of genes and cells on which this matrix is based.

References

    1. White JG, Southgate E, Thomson JN, Brenner S. The structure of the nervous system of the nematode Caenorhabditis elegans. Philosophical Transactions of the Royal Society of London B Biological Sciences. 1986;314:1–340. - PubMed
    1. Hobert O. Terminal Selectors of Neuronal Identity. Curr Top Dev Biol. 2016;116:455–75. doi: 10.1016/bs.ctdb.2015.12.007 . - DOI - PubMed
    1. Glenwinkel L, Taylor SR, Langebeck-Jensen K, Pereira L, Reilly MB, Basavaraju M, et al.. In silico analysis of the transcriptional regulatory logic of neuronal identity specification throughout the C. elegans nervous system. eLife. 2021;10. Epub 2021/06/25. doi: 10.7554/eLife.64906 . - DOI - PMC - PubMed
    1. Hobert O. Regulatory logic of neuronal diversity: terminal selector genes and selector motifs. Proc Natl Acad Sci U S A. 2008;105(51):20067–71. Epub 2008/12/24. doi: 10.1073/pnas.0806070105 . - DOI - PMC - PubMed
    1. Hobert O. Homeobox genes and the specification of neuronal identity. Nat Rev Neurosci. 2021;22(10):627–36. Epub 2021/08/28. doi: 10.1038/s41583-021-00497-x . - DOI - PubMed

Publication types

MeSH terms

Substances