. 2022 Sep 29;185(20):3689-3704.e21.
doi: 10.1016/j.cell.2022.09.006.

Repression and 3D-restructuring resolves regulatory conflicts in evolutionarily rearranged genomes

Affiliations

Repression and 3D-restructuring resolves regulatory conflicts in evolutionarily rearranged genomes

Alessa R Ringel et al. Cell. .

Abstract

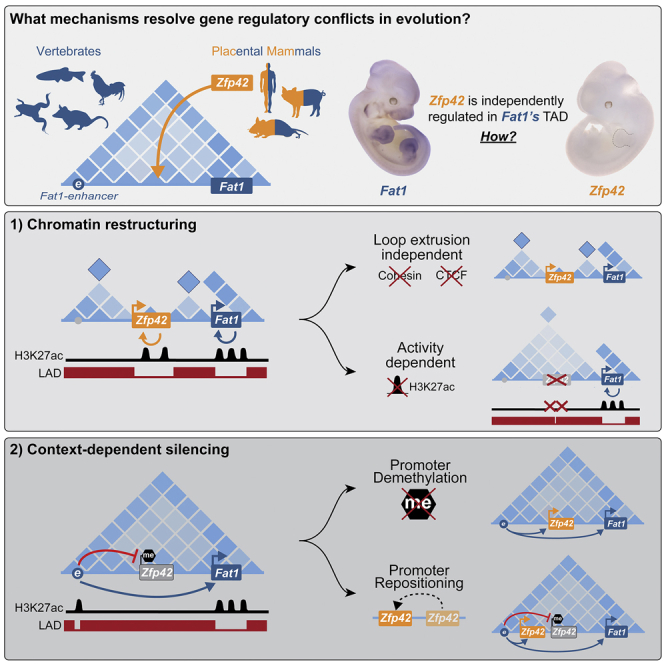
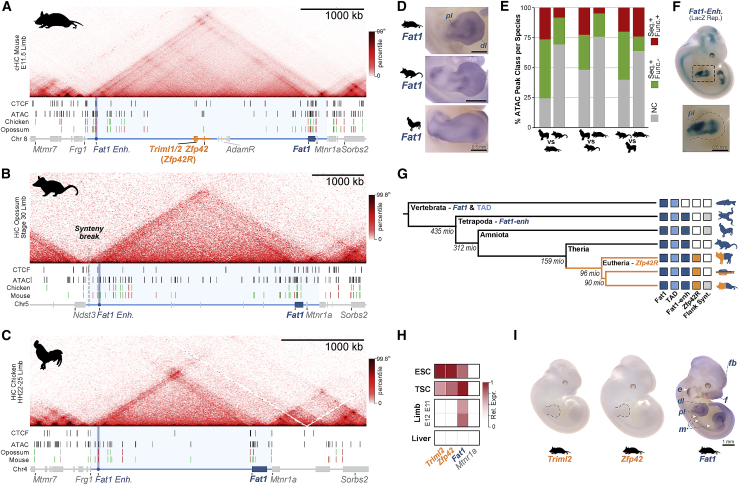
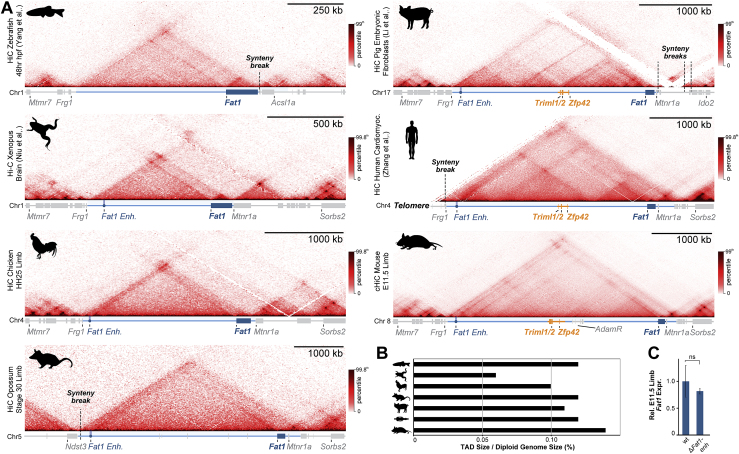
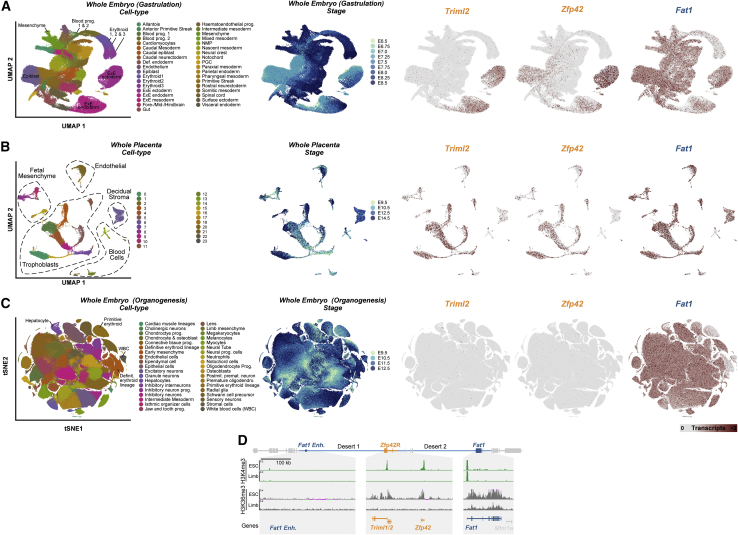
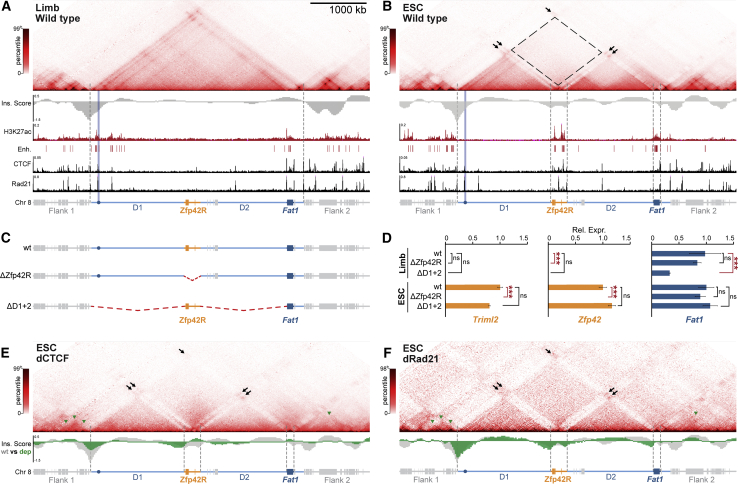
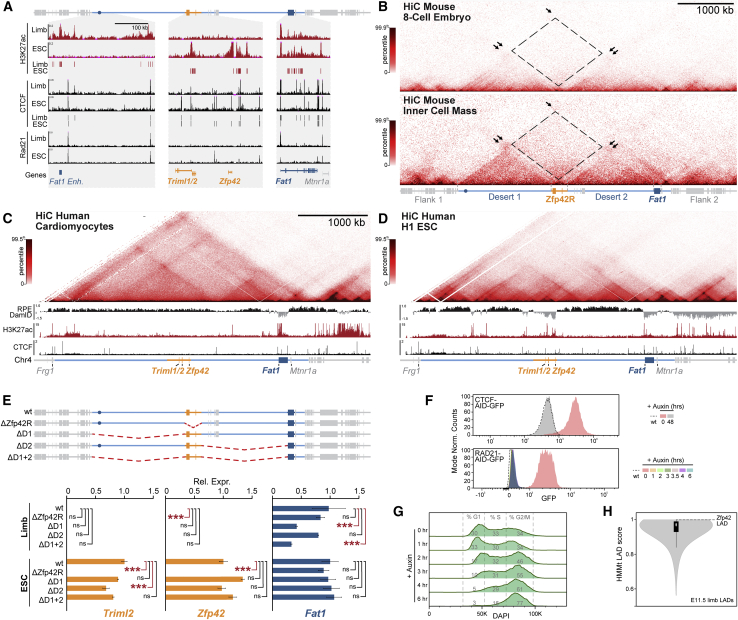
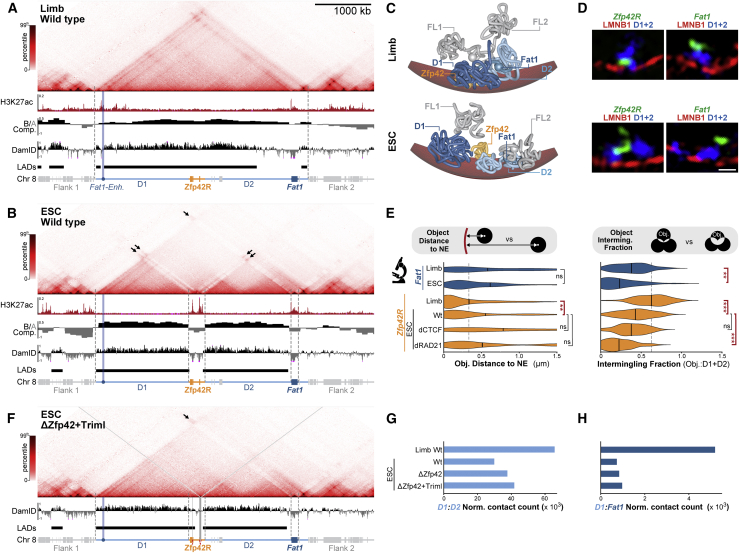
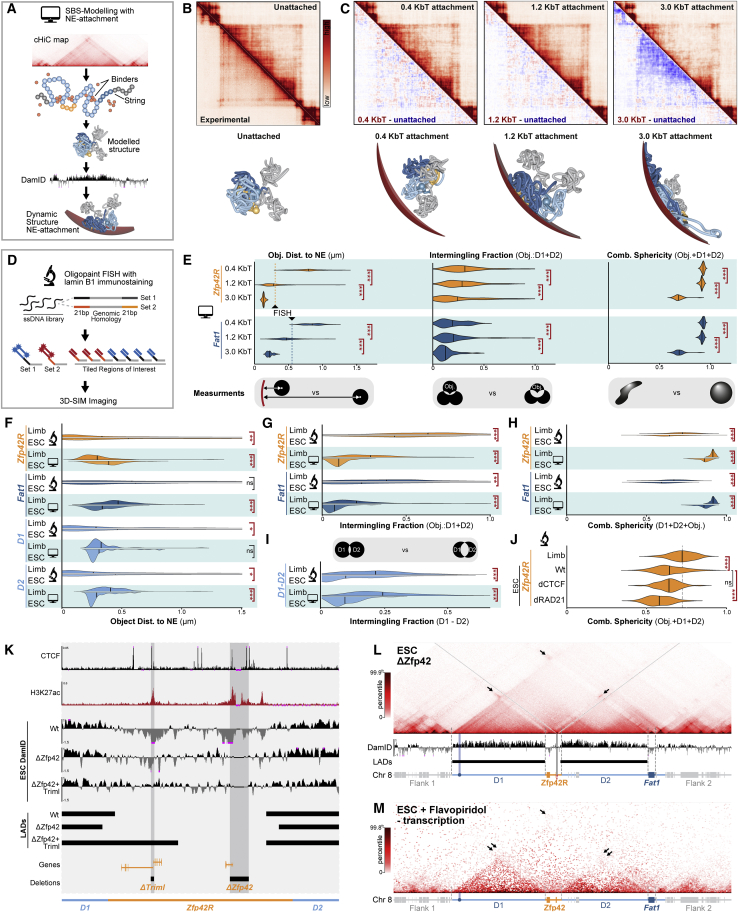
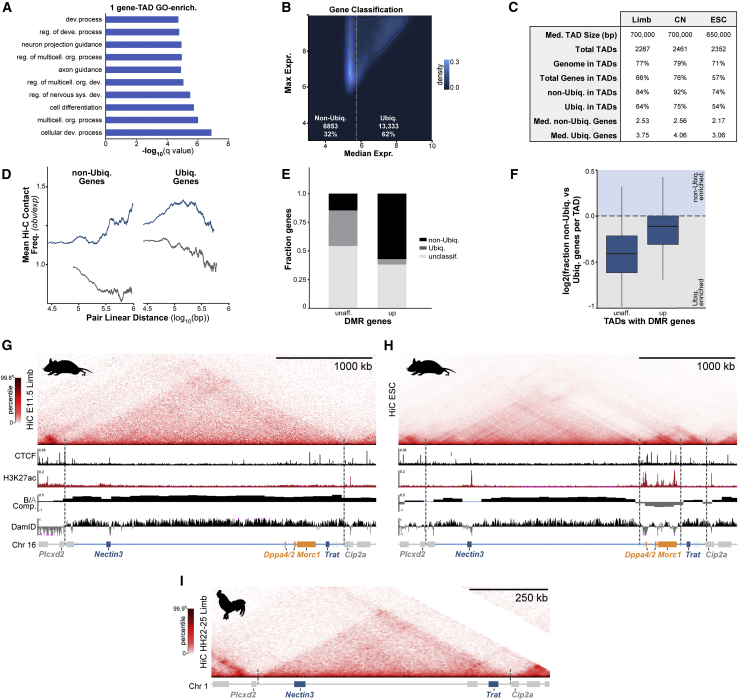
Regulatory landscapes drive complex developmental gene expression, but it remains unclear how their integrity is maintained when incorporating novel genes and functions during evolution. Here, we investigated how a placental mammal-specific gene, Zfp42, emerged in an ancient vertebrate topologically associated domain (TAD) without adopting or disrupting the conserved expression of its gene, Fat1. In ESCs, physical TAD partitioning separates Zfp42 and Fat1 with distinct local enhancers that drive their independent expression. This separation is driven by chromatin activity and not CTCF/cohesin. In contrast, in embryonic limbs, inactive Zfp42 shares Fat1's intact TAD without responding to active Fat1 enhancers. However, neither Fat1 enhancer-incompatibility nor nuclear envelope-attachment account for Zfp42's unresponsiveness. Rather, Zfp42's promoter is rendered inert to enhancers by context-dependent DNA methylation. Thus, diverse mechanisms enabled the integration of independent Zfp42 regulation in the Fat1 locus. Critically, such regulatory complexity appears common in evolution as, genome wide, most TADs contain multiple independently expressed genes.

Keywords: 3D genome organization; CTCF; DNA methylation; cohesin; developmental gene regulation; enhancer-promoter specificity; evolution; lamina-associated domain; loop extrusion; topologically associating domains.


Conflict of interest statement

Declaration of interests The authors declare no competing interests.

Figures

None
Graphical abstract
Figure 1
Figure 1
Zfp42R genes emerged with divergent expression in Fat1’s ancient TAD regulatory landscape (A–C) cHi-C or Hi-C from mouse (A), opossum (B), and chicken (C) embryonic limb buds with ATAC-seq and CTCF ChIP-seq peaks below. Genes are colored bars and lines indicate the TAD (light blue), the 293 kb sub-Zfp42 region (Zfp42R, orange), and sub-Adam region (AdamR, gray). An ultra-conserved Fat1 enhancer (Fat1-enh, blue circle) is also highlighted. ATAC peaks are colored by sequence conservation (seq) with or without matching functional ATAC signal (func.). Red (seq+, func.+); green (seq+, func.−); gray (seq−,func.−). (D) Species-specific Fat1 WISH in embryonic limbs. n = 2–4. Scale bar, 0.5 mm. (E) Quantification of pairwise conservation of species ATAC-seq peaks. (F) LacZ reporter assay of mouse Fat1-enh in E11.5 embryos. n = 4 embryos. (G) Phylogenetic tree with presence of Fat1, the TAD, Fat1-enh, Zfp42R, or flanking synteny outside the TAD indicated. (H and I) Gene activity overview from Fantom5 CAGE expression (H) and WISH (I). Fat1 WISH staining is seen in the ear (e), mammary glands (m), face (f), forebrain (fb), distal limb (dl), and proximal limb (pl). Trophoblast stem cells (TSCs). Scale bar, 1 mm. See Figures S1 and S2 and Tables S1, S2, and S6.
Figure S1
Figure S1
Extended TAD evolutionary analysis and impact of Fat1-enh deletion, related to Figure 1 (A and B) Hi-C from species spanning the vertebrate family tree (A) with quantification of TAD:Diploid genome size (B) (Li et al., 2020; Niu et al., 2021; Yang et al., 2020; Zhang et al., 2019). Fat1 (dark blue box) has been universally maintained with a large gene desert and TAD (light blue line) whose size scales with diploid genome size. This is in spite of synteny breaks that relocate Mtnr1a (zebrafish), Frg1 (opossum), Mtmr7 (human), and Sorbs2 (pig). The limb Fat1-enh emerged in tetrapods while Mtnr1a and its isolated TAD became incorporated into Fat1’s TAD in the Mammalia lineage. Triml1, Triml2 and Zfp42 emerged in eutherian placental mammals where they are universally conserved within the ancient TAD. Finally, retroposition events created a cluster of disintegrin metalloproteinases (Adam26b, 26a and 34) within the Adam gene cluster specifically in rodents (Brachvogel et al., 2002; Choi et al., 2004; Long et al., 2012). (C) RNA-seq expression effects of Fat1-enh deletion in E11.5 limbs. Error bars: standard deviation calculated from 4 biological replicates. non-significant (ns) p > 0.05.
Figure S2
Figure S2
Extended Zfp42R and Fat1 scRNA-seq gene expression analysis and expanded promoter mapping, related to Figure 1 (A–C) UMAPs from re-processed scRNA-seq from whole gastrulating embryos (A), the developing placenta (B), and whole embryos during organogenesis (C) (Cao et al., 2019; Marsh and Blelloch, 2020; Pijuan-Sala et al., 2019). UMAP embedding is colored according to cell type (left), developmental stage (middle), or expression of Triml2, Zfp42 or Fat1 (right). Zfp42R genes (Triml2 and Zfp42) are expressed in the extraembryonic ectoderm and endoderm (A) and placental trophoblasts (B). Zfp42 is also expressed in the E6.5 epiblast (A). Fat1 is expressed widely in many tissues (A–C) but is absent, for example, in blood progenitors and erythroid cells (A and C). (D) Zoom of the centromeric TAD arm, Zfp42R and Fat1 gene body with H3K4me3 and H3K36me3 ChIP-seq shown. Note that Triml1 and Triml2 are transcribed from a single shared bidirectional promoter as indicated by a single peak of H3K4me3 and broad H3K36me3 marking the transcribed gene body.
Figure 2
Figure 2
Fat1 and Zfp42 independently utilize local enhancers in separated restructured domains in ESCs (A and B) cHi-C from E11.5 limb buds (A) and ESCs (B) with insulation score (Ins. Score), H3K27ac, CTCF & Rad21 ChIP-seq, and called putative enhancers below. For cHi-C, black arrows indicate interactions between active H3K27ac-marked regions and dotted rectangle indicates lost interactions between inactive D1 and D2. E11.5 limb cHi-C is reproduced from Figure 1. (C and D) Schematic of deletion mutants (C) with gene expression effects analyzed by RNA-seq (D). Error bars, SD calculated from 2–4 biological replicates per sample. ∗∗∗p < 0.001, p < 0.05, non-significant (ns). (E and F) cHi-C from dCTCF (E) or dRad21 (F) ESCs with wild type (gray) or depletion (green) Ins. Scores below. Green arrows indicate flanking TADs disrupted by CTCF/Rad21 depletion. See Figure S3 and Tables S1, S2, and S4.
Figure S3
Figure S3
Confirmation of TAD disassembly in placental mammal pluripotency, CTCF/Rad21 depletion, and LAD signal strength, related to Figures 2 and 3 (A) Zooms of E11.5 limb and ESC H3K27ac, CTCF and RAD21 ChIP-seq with called enhancers or CTCF peaks below. (B) Low input Hi-C from mouse 8-cell embryos (top) and pluripotent cells from the inner cell mass (bottom) (Du et al., 2017). (C and D) Hi-C from human cardiomyocytes (C) and H1 ESCs (D) with corresponding H3K27ac, CTCF ChIP-seq and DamID shown below. Note DamID from retinal pigment epithelium (RPE) cells was used to define locus lamina-association when Zfp42R is inactive in differentiated cells. (E) Schematic of deletion mutants (top) with effects on gene expression determined by RNA-seq (bottom). Error bars: standard deviation calculated from 2–4 biological replicates per sample. ∗∗∗p < 0.001, p < 0.05, non-significant (ns). (F) FACs distributions of GFP signal in CTCF-AID-GFP (top) and Rad21-AID-GFP (bottom) ESCs following indicated auxin treatments. (G) Distribution of cell-cycle phases in Rad21-AID-GFP ESCs showing rapid accumulation in S and G2/M within 6 h. To account for accumulation of Rad21-AID-GFP ESCs in G2/M phase caused by failed sister chromatid cohesion, cHi-C was performed on sorted G1 cells 3.5 h post-auxin addition (Liu et al., 2021). By contrast, due to technical difficulties plating fixed cells on coverslips, FISH was performed on unsorted 2 h-induced Rad21-AID-GFP ESCs where only moderate shifts in the G1:S:G2/M ratio were observed. (H) Genome-wide quantification of LAD scores from E11.5 limb DamID. The Zfp42 LAD is highlighted and lies in the 88th percentile of LADs genome wide.
Figure 3
Figure 3
The Zfp42/Fat1 TAD accommodates different chromatin environments in limb but is restructured into discrete compartments in ESCs (A and B) cHi-C from E11.5 limb buds (A) and ESCs (B) with H3K27ac-ChIP-seq, compartments, and Lamin B1 DamID tracks and called LADs below. cHi-C is reproduced from Figures 1 and 2. (C) Representative polymer model of locus with simulated NE (red) in E11.5 limbs (top) and ESCs (bottom). (D) Representative immunoFISH Z-slice with Lamin B1 (red), D1+D2 (blue) and Zfp42R or Fat1 (green). Scale bar, 500 nm. (E) FISH measurements from wild-type limb or wild-type, CTCF-depleted (dCTCF), and Rad21-depleted (dRad21) ESCs. Object centroid distance to the NE (left) and intermingling fraction with D1+D2 (right) measurements are shown. Gray line highlights median limb values for reference. ∗∗∗p < 0.001, ∗∗p < 0.01, p < 0.05, and non-significant (ns) from Welch's t test comparisons between indicated samples. n = 16–138 alleles of at least two biological replicates. (F) cHi-C and Lamin B1 DamID in ΔZfp42+Triml ESCs with gray lines highlighting deleted H3K27ac regions. (G and H) Quantification of D1:D2 (G) and D1:Fat1 (H) cHi-C interactions in indicated samples. See Figures S3 and S4 and Tables S1, S2, S3, and S5.
Figure S4
Figure S4
Comparison of SBS modeling with NE attachment and Oligopaint FISH and summary of ESC H3K27ac-deletion mutants, related to Figure 3 (A) Schematic representation of the modified strings-and-binders (SBS) polymer model. cHi-C contact maps were used to define PRISM-assigned chromatin binders. The chromatin polymer is then structured in silco through simulated DNA interactions created by the self-association between matching binders (Barbieri et al., 2012; Nicodemi and Prisco, 2009). Generated structures were subsequently dynamically attached to a modeled NE with polymer affinities determined from sample-matched DamID (see STAR Methods). (B and C) Reconstructed contact maps from simulated limb structures before (B) and after (C) NE attachment with 0.4, 1.2, and 3.0 kTb interaction energies. Corresponding subtraction maps and representative structures are shown below. n = 25–88 simulations. (D) Oligopaint FISH 3D-SIM imaging strategy. A library of single stranded DNA oligos with genomic homology and overhangs allow multiplexed staining of multiple regions of interest. (E) Quantification of object NE-distance (left), intermingling fraction (middle) and sphericity (right) for simulated limb structures following at indicated NE-attachment energies. 1.2 kTb was selected for further analysis as it produced NE-proximities without deforming the structure’s intermingling or sphericity relative to FISH measurements. (F–H) Comparison of simulated NE-attachment model at 1.2 kTb and experimental FISH data in wild-type E11.5 limbs and ESCs. Measurements are object NE-distance (F), intermingling fraction (G), and object sphericity with D1+D2 (H). (I) Comparison of simulated and observed D1 and D2 intermingling fraction. (J) Quantification of combined FISH sphericity of Zfp42R with D1+D2 in indicated samples. Gray line highlights median limb values for reference. ∗∗∗p < 0.001, ∗∗p < 0.01, and p < 0.05 from Welch's t test comparisons. Non-significant (ns). FISH; n = 16–138 alleles of at least two biological replicates. (K) Zooms of Zfp42R with indicated ESC H3K27ac, CTCF ChIP-seq, Lamin B1 DamID tracks below. Shaded boxes highlight deleted H3K27ac regions. (L) cHi-C and DamID in ΔZfp42 ESCs. (M) Published Micro-C of JM8.N4 ESCs where transcription is inhibited by flavopiridol (Hsieh et al., 2020). Arrows indicate Trim1/2, Zfp42 or Fat1 interactions with active chromatin and evasion of heterochromatin.
Figure 4
Figure 4
NE attachment neither blocks Zfp42R gene activation nor their communication with Fat1 enhancers (A) Hi-C from wild-type and ΔD1+2 E11.5 limb buds, with the former reproduced from Figure 1. (B) Staining of endogenous Fat1 (WISH, left) or integrated β-globin LacZ sensors (LacZ, right) in E12.5 embryos. n = 4–10 embryos. Integration sites are indicated by lines and their NE attachment in limb by black (LAD) or gray (non-LAD) boxes. Staining is indicated in the ear (e), distal limb (dl), proximal limb (pl), mammary glands (m), and face (f). Scale bar, 1 mm. (C) Summary of gene, enhancer, and sensor activities with LAD-status indicated. See Figure S5 and Tables S1, S2, and S3.
Figure S5
Figure S5
Testing intrinsic promoter activities, bisulfite conversion cloning and generation and analysis of DNMT3A/B knockouts, related to Figures 4 and 5 (A) Triml2 and Zfp42 WISH stainings in E12.5 embryos. Scale bar is 1 mm. (B) Staining from β-globin LacZ sensors integrated at Frg1 and Zfp42Rb in E13.0 embryos. n = 4–10 stained embryos per position. (C) Zoom of Rosa26 safe harbor locus with CAGE, H3K27ac ChIP-seq and WGBS shown. Sensor integration site is indicated by the gray bar with insert transcription orientation matching Rosa26. (D) LacZ stainings from E12.5 embryos with sensors driven by indicated promoters integrated at the Rosa26 locus. (E) Strategy for Dnmt3b knockout in ESC clones with western blot confirmation shown below. DNMT3A increases following loss of DNMT3B. (F) Schematic of bisulfite conversion cloning strategy with quantification of methylated CpGs at the endogenous or transplanted Zfp42 promoter in E11.5 limbs. (G) Corresponding lollipop diagrams of Zfp42 promoter methylation (black methylated and white unmethylated CpGs). (H and I) cHi-C from E11.5 DNMT3B−/− limb buds (H) with subtraction to wild type shown below (I).
Figure 5
Figure 5
DNA methylation and not enhancer compatibility renders Zfp42 insensitive to Fat1 regulatory information (A) E12.5 embryos stained for Fat1 WISH (left) or LacZ expression (right) driven at Zfp42Rb by the Triml1/2, Zfp42, Fat1, or β-globin (Glob) core promoters. n = 4–10 embryos. Staining indicated in the ear (e), mammary glands (m), face (f), forebrain (fb), proximal limb (pl), and apical ectodermal ridge (AER). Scale bar, 1 mm. WISH is reproduced from Figure 4. (B) qRT-PCR expression analysis of Promotor-LacZ sensor mRNA in E12.5 limbs. Error bars, SD calculated from 3–8 biological replicates. ∗∗∗p < 0.001, p < 0.05, and non-significant (ns) from Welch's t test comparisons. (C) CAGE, H3K27ac, H3K27me3, H3K9me3, and WGBS tracks from ESCs and/or E11.5 limb buds. Cloned minimal promoters are highlighted in gray. Differentially methylated regions (DMRs) are denoted by black bars. (D) RNA-seq expression effects of Dnmt3b knockout with or without D1+D2 deletion. Error bars: standard deviation calculated from 3–4 biological replicates. ∗∗∗p < 0.001, p < 0.05, non-significant (ns). (E) Staining of lacZ-tagged endogenous Zfp42 in wild-type and DNTM3B−/− E12.5 embryos. Scale bar, 1 mm. See Figure S5 and Tables S1, S2, and S4.
Figure 6
Figure 6
Divergent promoter regulation is common in TADs throughout the genome (A) Summary of TAD co-expression analysis. Gene pair co-expression was determined from FANTOM5 CAGE data, whereas TADs were identified in limb, cortical neuron (CN), and ESC Hi-C (Bonev et al., 2017; Consortium et al., 2014; Kraft et al., 2019; Lizio et al., 2015). (B) Average frequency distribution of non-Ubiq. and Ubiq. genes in TADs. (C) Fraction of co-expressing intra-TAD and inter-TAD gene pairs according to their linear separation. Lines represent a moving window average of 2,000 gene pairs. (D) Frequency distribution of mean expression correlation between all non-Ubiq. genes in a domain for all multi-gene TADs. (E–G) Model for evolution of independent Zfp42R and Fat1 regulation. (E) Fat1, its enhancers, and TAD existed together as a regulatory unit in all vertebrates despite frequent flanking synteny breaks. Zfp42 and Triml1/2 emerged with independent regulation in placental mammals. (F) In limbs, Fat1 enhancers emerge from LADs and promiscuously sample promoters throughout the domain's both active and NE-attached inactive compartments. However, despite this and its functional compatibility with Fat1 enhancers, DNA methylation of Zfp42’s promoter prevents its activation. (G) In ESCs, activity-driven compartmentalization and perhaps weakened loop extrusion restructures the TAD, thereby driving the Zfp42R and Fat1 genes to independently utilize only local enhancers. See Figure S6.
Figure S6
Figure S6
Summaries of co-expression analysis and genome-wide effects of DNA hypomethylation, related to Figure 6 (A) GO-term enrichment for genes within single-gene TADs (Eden et al., 2009). (B) Classification of genes into non-ubiquitously (non-Ubiq.) and ubiquitously (Ubiq.) expressed classes according to their maximum and median expression across FANTOM5 CAGE samples. (C) TAD and gene statistics in limb, CNs and ESCs. (D) Mean observed/expected KR-normalized Hi-C contact frequency between intra-TAD or inter-TAD gene pairs. Lines represent a moving window average of 2,000 gene pairs. Non-Ubiq. gene co-expression strongly correlates with their increased contact frequency within TADs and, in particular, near TAD boundaries. (E) non-Ubiq. and Ubiq. expression classification of genes that possess hypomethylated DMR promoters in DNMT3B−/− limbs. Unclassified reflects genes that were detected in limb RNA-seq but did not pass thresholds for classification into Ubiq. or non-Ubiq. FANTOM5 classes. (F) Fraction of non-Ubiq. versus Ubiq. genes in each TAD of hypomethylated DMR promoters. (G–I) Hi-C at the Dppa2/4 locus from E11.5mouse limb buds (G), mouse ESCs (H) morphologically stage-matched chicken limb buds (I). Matching CTCF and H3K27ac ChIP-seq, compartments and Lamin B1 DamID tracks are shown below. Dotted lines demarcate partitioned domains. Nectin3 and Trat (dark blue) occupy a large gene desert and TAD (light blue) into which Morc1 (orange) emerged in tetrapods. Dppa2 and 4 (orange) emerged later in eutherians. Like Zfp42R genes, Dppa2/4 and Morc1 are active in ESCs where they are isolated with local enhancers in a separate domain within a disassembled TAD (Sima et al., 2019).

Comment in

  • A TAD refined for gene regulation.
    Burgess DJ. Burgess DJ. Nat Rev Genet. 2022 Dec;23(12):714. doi: 10.1038/s41576-022-00549-7. Nat Rev Genet. 2022. PMID: 36316395 No abstract available.

References

    1. Abdennur N., Mirny L.A. Cooler: scalable storage for Hi-C data and other genomically labeled arrays. Bioinformatics. 2020;36:311–316. - PMC - PubMed
    1. Acemel R.D., Maeso I., Gómez-Skarmeta J.L. Topologically associated domains: a successful scaffold for the evolution of gene regulation in animals. Wiley Interdiscip. Rev. Dev. Biol. 2017;6:e265. - PubMed
    1. Alam T., Agrawal S., Severin J., Young R.S., Andersson R., Arner E., Hasegawa A., Lizio M., Ramilowski J.A., Abugessaisa I., et al. Comparative transcriptomics of primary cells in vertebrates. Genome Res. 2020;30:951–961. - PMC - PubMed
    1. Allen M.P., Tildesley D.J. Oxford University Press; 2017. Computer Simulation of Liquids.
    1. Allou L., Balzano S., Magg A., Quinodoz M., Royer-Bertrand B., Schöpflin R., Chan W.L., Speck-Martins C.E., Carvalho D.R., Farage L., et al. Non-coding deletions identify Maenli lncRNA as a limb-specific En1 regulator. Nature. 2021;592:93–98. - PubMed

Publication types

LinkOut - more resources