. 2022 Sep 29;185(20):3770-3788.e27.
doi: 10.1016/j.cell.2022.09.010.

Proper acquisition of cell class identity in organoids allows definition of fate specification programs of the human cerebral cortex

Affiliations

Proper acquisition of cell class identity in organoids allows definition of fate specification programs of the human cerebral cortex

Ana Uzquiano et al. Cell. .

Abstract

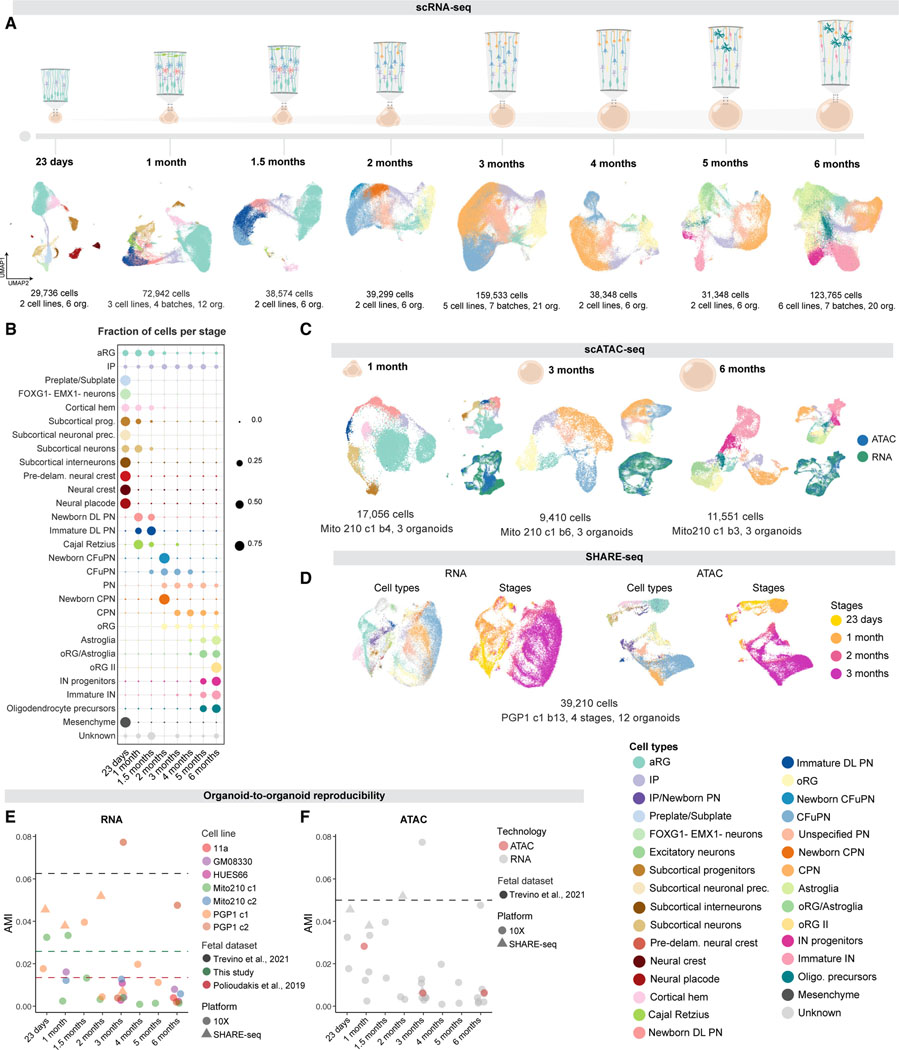
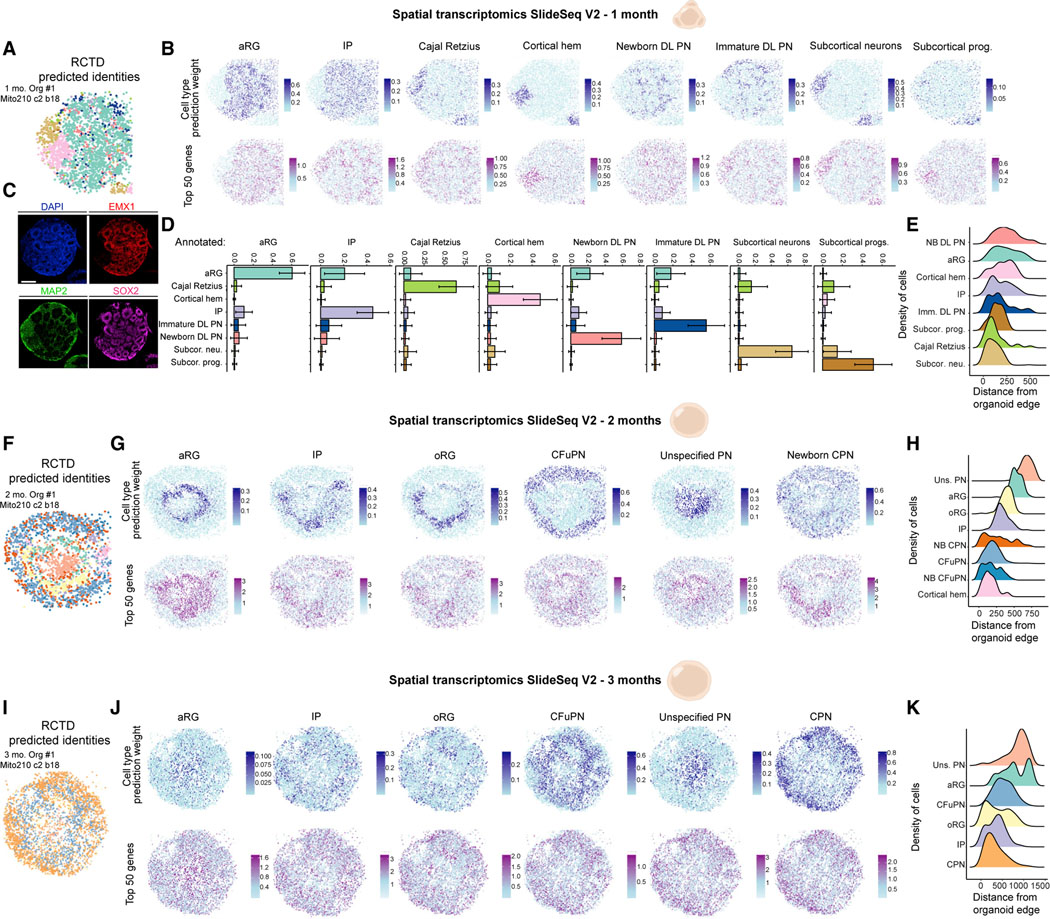
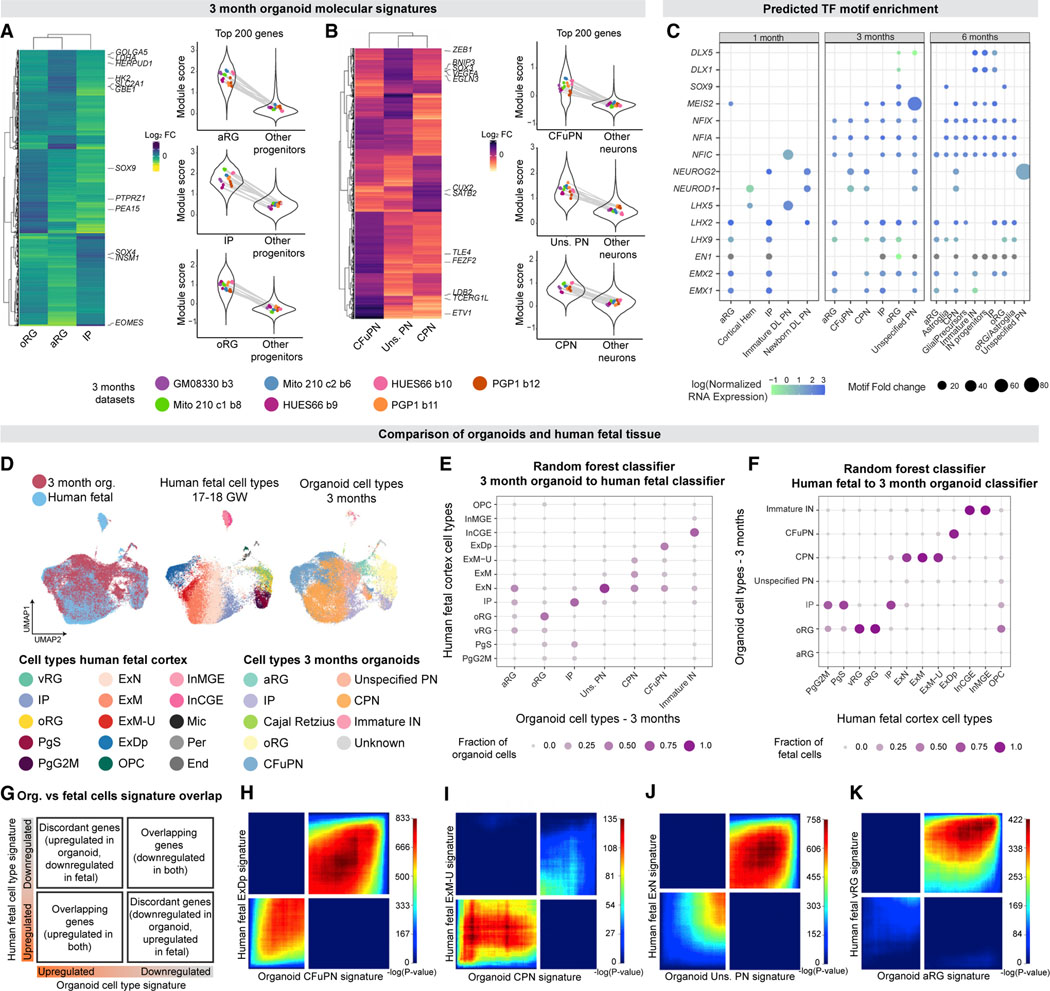
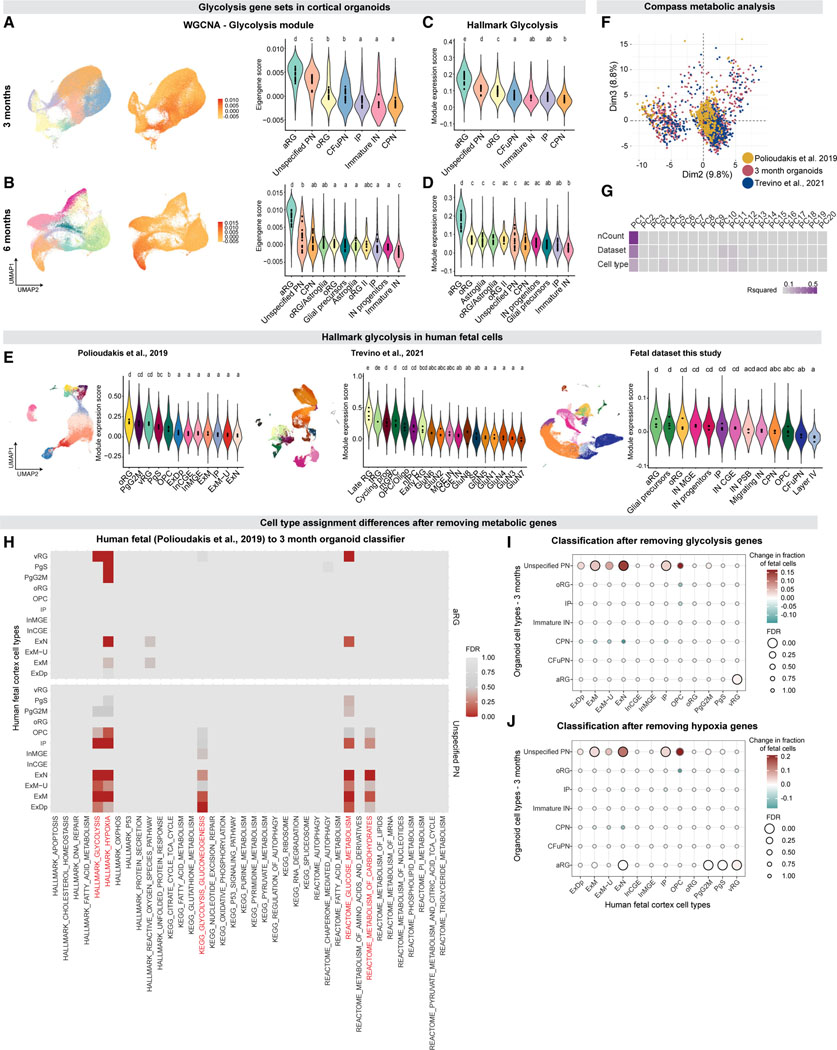
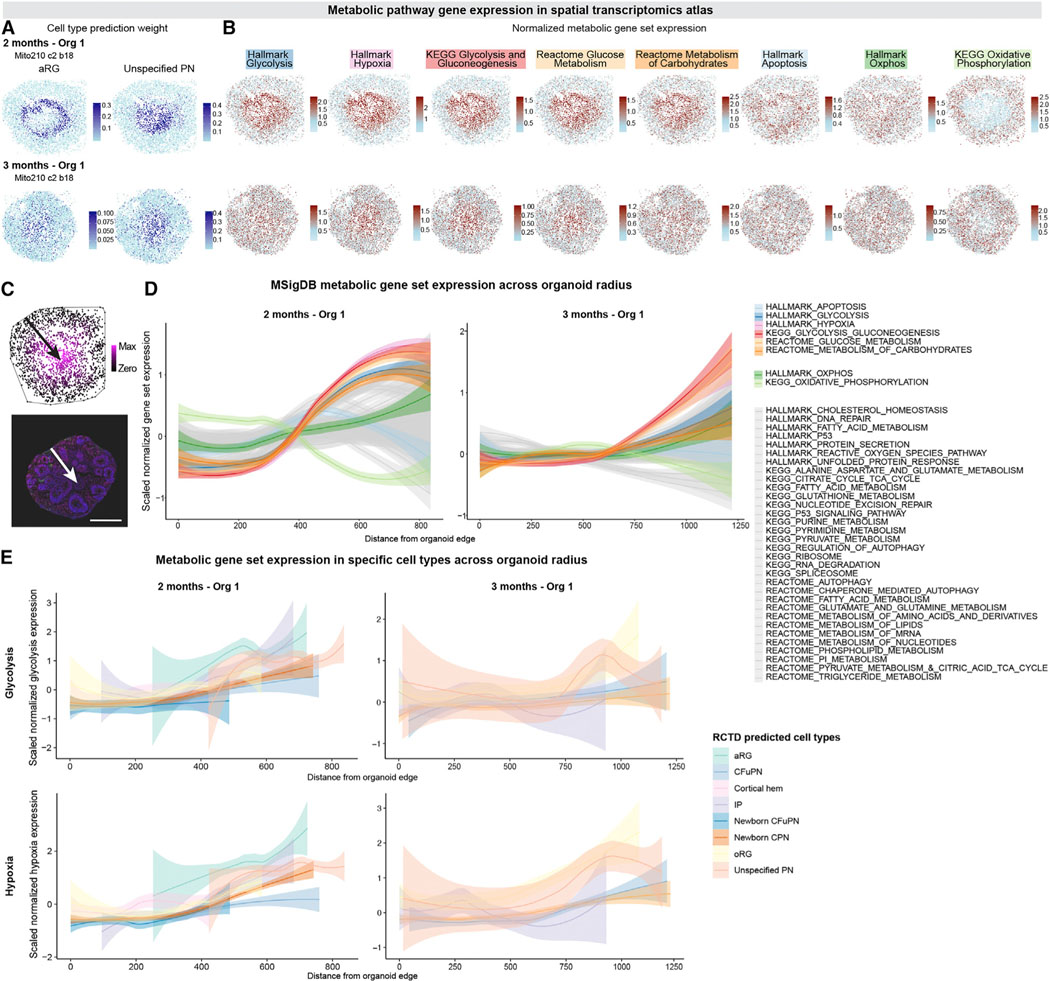
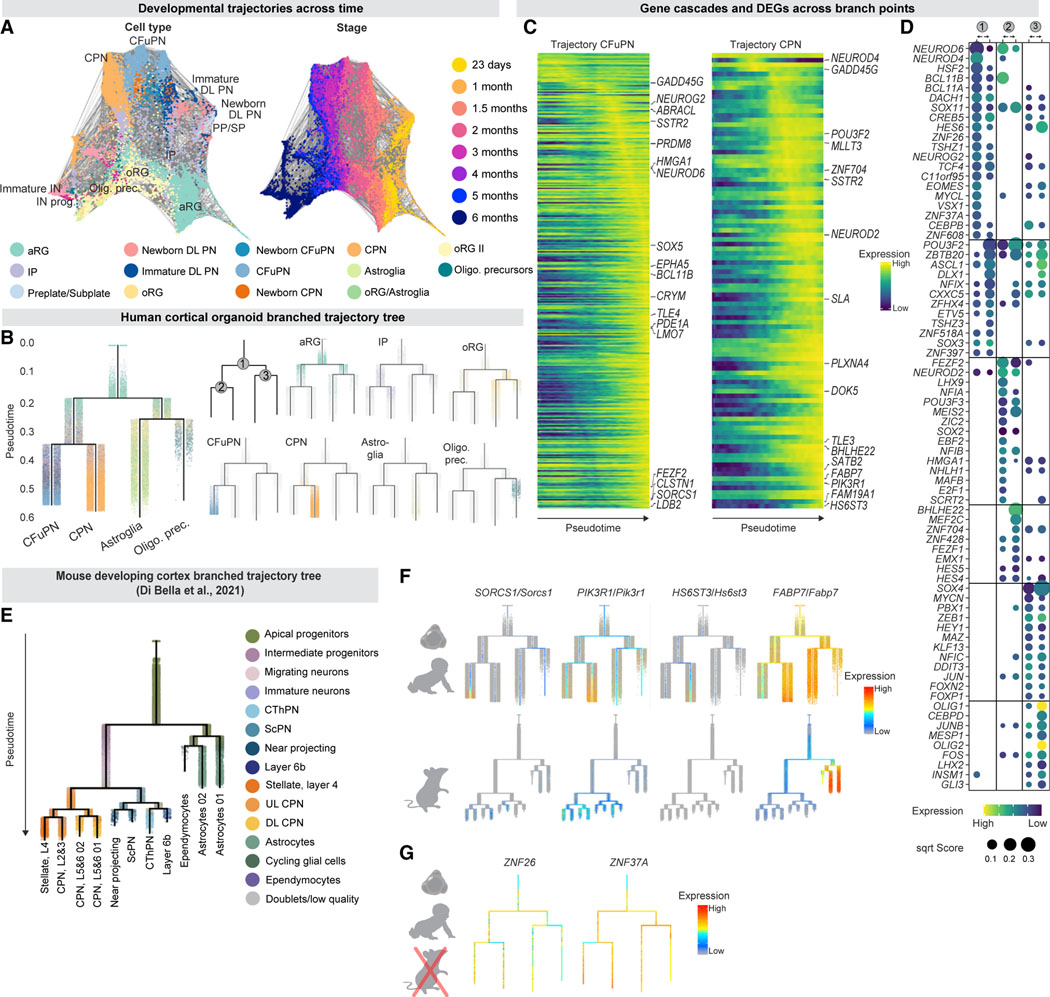
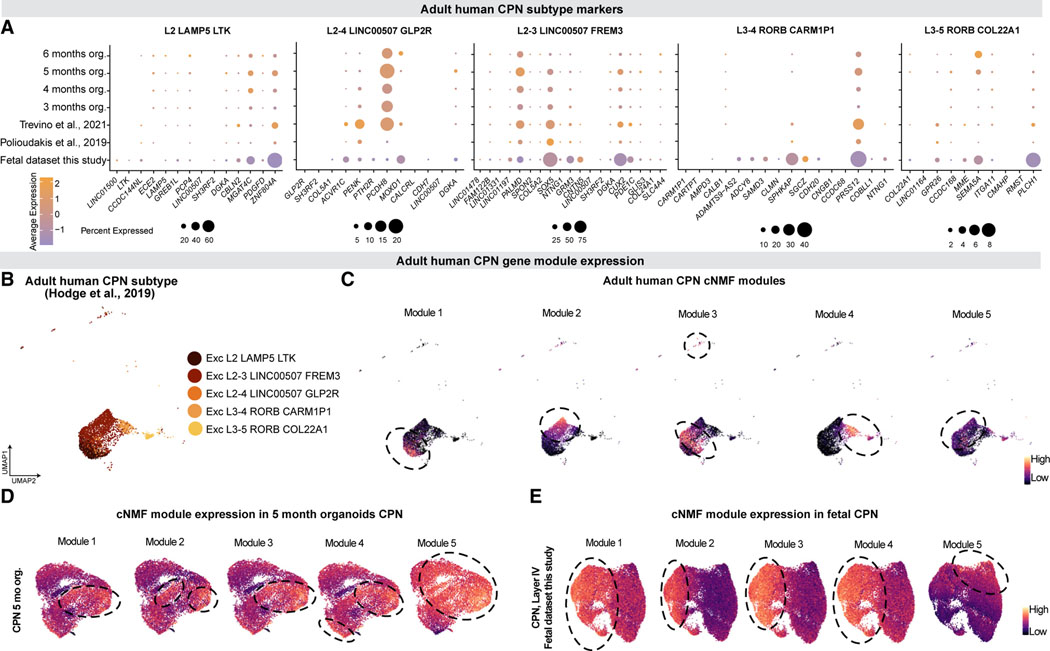
Realizing the full utility of brain organoids to study human development requires understanding whether organoids precisely replicate endogenous cellular and molecular events, particularly since acquisition of cell identity in organoids can be impaired by abnormal metabolic states. We present a comprehensive single-cell transcriptomic, epigenetic, and spatial atlas of human cortical organoid development, comprising over 610,000 cells, from generation of neural progenitors through production of differentiated neuronal and glial subtypes. We show that processes of cellular diversification correlate closely to endogenous ones, irrespective of metabolic state, empowering the use of this atlas to study human fate specification. We define longitudinal molecular trajectories of cortical cell types during organoid development, identify genes with predicted human-specific roles in lineage establishment, and uncover early transcriptional diversity of human callosal neurons. The findings validate this comprehensive atlas of human corticogenesis in vitro as a resource to prime investigation into the mechanisms of human cortical development.

Keywords: Brain organoids; Cortical development; In vitro metabolism; Multiomics; Neuronal diversity; Single cell RNA-seq; Spatial transcriptomics.


Conflict of interest statement

Declaration of interests P.A. is a SAB member at Herophilus, Rumi Therapeutics, and Foresite Labs, and is a co-founder of Vesalius and a co-founder and equity holder at Foresite Labs. A.R. is a founder and equity holder of Celsius Therapeutics, an equity holder in Immunitas Therapeutics and until August 31, 2020, was a SAB member of Syros Pharmaceuticals, Neogene Therapeutics, Asimov and Thermo Fisher Scientific. From August 1, 2020, A.R. has been an employee of Genentech. M.P. is an employee of Roche.

Figures

Figure 1.
Figure 1.. Single-cell transcriptomic and epigenetic landscape of developing cortical organoids
(A) scRNA-seq of organoids at eight time points. Cells are colored by cell type. (B) Fraction of cells per cell type at each timepoint. (C) scATAC-seq of organoids cultured for 1, 3, and 6 months. Insets, scATAC-seq (blue) and scRNA-seq (green) data integration. (D) SHARE-seq of organoids cultured for 23 days, 1, 2, and 3 months. Left, cell types from all the timepoints. Right, organoid stage. (E) Adjusted mutual information (AMI) scores between cell types and individual organoids for each scRNA-seq and SHARE-seq dataset, where lower scoresindicate lower variability. Dotted lines represent AMI scores of fetal cortex. (F) AMI scores between cell types and individual organoids in scATAC-seq (green points). Gray points are repeated from Figure 1E. Dotted lines represent the AMI scores of human fetal cortex. “c”, cell line clone; “b” differentiation batch; org., organoid; aRG: apical radial glia; IP: intermediate progenitor; prec., precursors; DL, deep-layer; PN, projection neurons; CFuPN, corticofugal projection neuron; CPN, callosal projection neuron; oRG, outer radial glia; IN, interneurons. See also Figures S1 and S2 and Data S1 in Mendeley Data: https://doi.org/10.17632/7cxccpv4hg.1.
Figure 2.
Figure 2.. Spatial transcriptomic landscape of developing cortical organoids
(A) Spatial plot of Slide-seqV2 data from 1-month Organoid #1, colored by RCTD-assigned cell type. (B) Spatial plots showing RCTD prediction weights (top row) and normalized expression of the top 50 marker genes (bottom row) for each cell type in 1-monthOrganoid #1. (C) Immunohistochemistry for neuronal (MAP2) and dorsal forebrain progenitor (EMX1, SOX2) types in 1-month Organoid #1, in a section posterior to the one usedfor Slide-seqV2. Scale bar 200 μm. (D) The mean ± standard deviation of the cell type weights given by RCTD, for beads in 1-month Organoid #1 that were annotated as each cell type. (E) The distribution of each annotated cell type over the beads’ calculated distance from the edge of the organoid, ordered from top to bottom by median distance. (F–H) Spatial plots and distributions of cell types from 2-month Organoid #1, as in A, B, and E. (I–K) Spatial plots of distributions of cell types from 3-month Organoid #1, as in A, B, and E. NB, newborn; Subcor., subcortical; prog., progenitors; neu., neurons; Uns., unspecified. See also Figure S2 and Table S1.
Figure 3.
Figure 3.. Longitudinal fetal programs of cell identity acquisition are established in cortical organoids with cell type specificity
(A and B) Left, heatmaps comparing the upregulated genes in each progenitor (A) or neuronal (B) population (genes with adjusted p < 0.0015, log2 fold change>1.5). Right, gene set expression of the top 200 genes in the molecular signatures of each cell type. Violin plots show the module score distribution across single cells; points show the mean module score for each individual organoid, with lines connecting points representing cells from the same organoid. The means within each distribution (within the cell type for that signature, left, or the background cells, right, for each plot) showed no significant difference across individual organoids in all cases (one-way ANOVA, p > 0.05). (C) TF motifs enriched (p < 1e-10) in peaks with increased accessibility (Bonferroni adjusted p < 0.1) in each cell type, per timepoint. Points are sized by foldchange enrichment of the motif in accessible peaks versus GC-content-matched background regions, and colored by normalized mRNA expression for each TF in the corresponding cell type from scRNA-seq. Gray points indicate zero expression. (D) Cells from 3-month organoids, integrated with human fetal data (Polioudakis et al., 2019). Left, cells colored by dataset. Middle, fetal cells are colored by cell type as assigned in Polioudakis et al. (2019). Right, organoid cells are colored by cell type. (E) Assignments of 3-month organoid cells to fetal cell types, via random forest. Points are sized and colored by the fraction of each organoid cell type assigned toeach fetal cell type. (F) Assignments of fetal cells to 3-month organoid cell types, via random forest. Points are sized and colored by the fraction of each human fetal cell type assignedto each organoid cell type. (G) Schematic of the RRHO2 plot. Genes from each signature are ordered from most upregulated to most downregulated, with the most upregulated gene of eachsignature in the lower left corner. (H–K) RRHO2 plots comparing the signatures of organoid CFuPN to fetal ExDp (H), organoid CPN to fetal ExM-U (I), organoid uns. PN to fetal ExN (J), and organoid aRG to fetal vRG (K). Points in the plot are colored by the p value of hypergeometric tests measuring the significance of overlap of gene lists up to that point. Cell types as in Polioudakis et al. (2019): vRG, ventricular radial glia; PgS, progenitors in S phase; PgG2 M, progenitors in G2 M phase; ExN, migrating excitatory neurons; ExM, maturing excitatory neurons; ExM-U, maturing excitatory neurons-upper layer enriched; ExDp, deep layer excitatory neurons; OPC oligodendrocyte precursors; InMGE, interneurons from the medial ganglionic eminence; InCGE, interneurons from the caudal ganglionic eminence; Mic, microglia; Per, pericyte; End, endothelial. See also Tables S1 and S2 and Data S2 and S3 in Mendeley Data: https://doi.org/10.17632/7cxccpv4hg.1.
Figure 4.
Figure 4.. Human cortical organoid cell type identity is largely unaffected by metabolic state
(A and B) Enrichment of a WGCNA gene module containing glycolysis genes in 3- and 6-month organoids. Left, cells from all 3-month (A) and 6-month (B) organoids, downsampled to an equal number of cells per organoid. Cells are colored according to cell type (left) and to eigengene score for the “glycolysis” module (middle). Right, violin plots showing the distribution of eigengene scores across cell types. Points indicate average scores for each individual organoid. Letters above violin plots indicate the results of a one-way ANOVA followed by pairwise TukeyHSD; cell types with the same letter have no significant difference between organoid averages. (C and D) Violin plots showing the distribution of module scores for the MSigDB Hallmark Glycolysis gene set across cell types in 3-month (C) and 6-month (D) organoids, in the same downsampled data. Points and letters as in (A). (E) Fetal cells (left, Polioudakis et al., 2019, middle, Trevino et al., 2021, right, fetal dataset from this study) colored by their assigned cell type (top), and violin plot showing the distribution of module scores for the MSigDB Hallmark Glycolysis gene set across cell types (bottom). Points and letters as in (A). (F) Principal component analysis (PCA) of the Compass matrix of metabolic reaction potential activity scores. Cells are colored by dataset. (G) Correlation of the top 20 principal components (PCs) of the Compass PCA with nCount (the number of UMIs per cell), the dataset of each cell, and the cell typelabel of each cell. Tiles colored by R-squared values from linear regressions of the PC loadings with each metadata value. (H) Significance (false discovery rate by Benjamini-Yekutieli) of the increase in Polioudakis et al. (2019) fetal cell assignments to the 3-month organoid aRG label (top) and unspecified PN cell types (bottom) after individually removing each of the 38 gene sets (x axis) from the model. (I and J) Change in the assignments of Polioudakis et al. (2019) fetal cell types to 3-month organoid cell types, after removing the MSigDB Hallmark Glycolysis (I) and Hypoxia (J) gene sets from the model. Points are colored by the change in the fraction of cells assigned to each label by the reduced model, compared to the full model. Points are sized by the FDR of the increase in that fraction. Points with FDR<0.05 are outlined in black. Changes were considered significant if they showed an FDR<0.05 and changed at least 1% of assigned cells. Cell types as in Trevino et al. (2021): tRG: truncated radial glia; mGPC, multipotent glial progenitor cell; OPC/Oligo, oligodendrocyte progenitor cell/oligodendrocyte; nIPC, neuronal intermediate progenitor cell; GluN, glutamatergic neuron; CGE IN, caudal ganglionic eminence interneuron; MGE IN, medial ganglionic eminence interneuron; SP, subplate. See also Figures S3, S4, and S5, Tables S3 and S4, and Datas S4 and S5 in Mendeley Data: https://doi.org/10.17632/7cxccpv4hg.1.
Figure 5.
Figure 5.. Metabolically-compromised cells reside in a restricted and central region of human cortical organoids
(A) Spatial plots colored by RCTD prediction weights for aRG (left) and uns. PN (right), for 2-month Organoid #1 (top) and 3-month Organoid #1 (bottom), repeated from Figures 3G and 3J. (B) Spatial plots showing the summed, normalized expression of genes in the indicated MSigDB gene sets for 2-month Organoid #1 (top) and 3-month Organoid #1 (bottom). (C) Schematic showing how bead distance from the edge of the organoid was calculated. Top, Slide-seqV2 data from 2-month Organoid #1, with beads colored by distance from organoid edge. Line shows convex hull around organoid. Bottom, IHC of a 1.5-month organoid, showing DAPI (blue), CTIP2 (magenta), HOPX (green), and SOX2 (red). Scale bar 200 μm. Arrows point from edge of organoid to points most distant from the edge. (D) Distribution of the beads’ scaled expression for each gene set compared to their distance from the edge of the organoid. Solid line shows the smoothed conditional mean values across beads; colored band, 95% confidence interval. Distributions are shown separately for 2-month Organoid #1 (left) and 3-month Organoid #1 (right). (E) Distributions as in C for the Hallmark Glycolysis (top) and Hallmark Hypoxia (bottom) gene sets, for beads assigned to each cell type. Cell types assigned to more than 8 beads per organoid are shown. Distributions are shown for 2-month Organoid #1 (left) and 3-month Organoid #1 (right). See also Figure S6 and Data S6 in Mendeley Data: https://doi.org/10.17632/7cxccpv4hg.1.
Figure 6.
Figure 6.. Molecular development of human cortical cell types
(A) Integrated trajectory of scRNA-seq datasets across time. Force-directed graph created using FLOWMAP. Cell clusters are colored by majority cell type (left, colors as in Figure 1) and by timepoint (right). Gray lines connect cell clusters with high transcriptional similarity. (B) URD branching tree. Cells colored by identity. Branch points are labeled 1–3. (C) Heatmap of lineage-specific gene cascades for CFuPN and CPN. Gene expression in each row is scaled to maximum observed expression. Genes are ordered by their onset and peak expression timings. (D) Top 20 TF per branch. Points are sized by their score (feature importance in a gradient boosting classifier) and colored by their average expression in the corresponding cells (row-scaled). Branch points numbered as in B. (E) URD branching tree of the mouse developing cortex (embryonic day 10.5 to postnatal day 4) adapted from (Di Bella et al., 2021). (F) Expression of human lineage-specific genes in human cortical organoid tree (top) and developing mouse cortex tree (bottom, Di Bella et al., 2021). (G) Expression of two human ZNF genes in the simplified branching tree. See also Figure S7, Table S5 and Data S7.
Figure 7.
Figure 7.. Callosal projection neuron diversity emerges at early stages of development
(A) Dotplot showing the percentage of cells (dot size) and average expression (color) of adult CPN subtype markers (Hodge et al., 2019) in human organoid and fetal CPN. (B) The five transcriptional subtypes of adult CPN described in (Hodge et al., 2019; Berg et al., 2021). (C) Feature plot of adult CPN showing the expression of consensus cNMF gene modules. Each cNMF module corresponds to a CPN transcriptional subtype. Dotted circles show areas of high gene module expression. (D and E) Five-month organoid CPN (D) and human fetal CPN (fetal dataset from this study, E) generated using the top 100 genes used in each of the cNMF modules as variable features. Colored by the module scores of each cNMF module. Dotted circles show areas of high gene module expression. See also Table S6 and Data S8 in Mendeley Data: https://doi.org/10.17632/7cxccpv4hg.1.

Similar articles

Cited by

References

    1. Angerer P, Haghverdi L, Büttner M, Theis FJ, Marr C, and Buettner F. (2016). destiny: diffusion maps for large-scale single-cell data in R. Bioinformatics 32, 1241–1243. 10.1093/BIOINFORMATICS/BTV715. - DOI - PubMed
    1. Angevine JB, and Sidman RL (1961). Autoradiographic Study of Cell Migration during Histogenesis of Cerebral Cortex in the Mouse. Nature 192, 766–768. 10.1038/192766b0. - DOI - PubMed
    1. Di Bella DJ, Habibi E, Stickels RR, Scalia G, Brown J, Yadollahpour P, Yang SM, Abbate C, Biancalani T, Macosko EZ, et al. (2021). Molecular logic of cellular diversification in the mouse cerebral cortex. Nature 595, 554–559. 10.1038/s41586-021-03670-5. - DOI - PMC - PubMed
    1. Berg J, Sorensen SA, Ting JT, Miller JA, Chartrand T, Buchin A, Bakken TE, Budzillo A, Dee N, Ding SL, et al. (2021). Human neocortical expansion involves glutamatergic neuron diversification. Nature 598, 151–158. 10.1038/s41586-021-03813-8. - DOI - PMC - PubMed
    1. Betizeau M, Cortay V, Patti D, Pfister S, Gautier E, Bellemin-Ménard A, Afanassieff M, Huissoud C, Douglas RJ, Kennedy H, and Dehay C. (2013). Precursor diversity and complexity of lineage relationships in the outer subventricular zone of the primate. Neuron 80, 442–457. 10.1016/j.neuron.2013.09.032. - DOI - PubMed

Publication types

LinkOut - more resources