. 2022 Oct 4;41(1):111441.
doi: 10.1016/j.celrep.2022.111441. Epub 2022 Sep 15.

Small-molecule screening identifies Syk kinase inhibition and rutaecarpine as modulators of macrophage training and SARS-CoV-2 infection

Affiliations

Small-molecule screening identifies Syk kinase inhibition and rutaecarpine as modulators of macrophage training and SARS-CoV-2 infection

Sinu P John et al. Cell Rep. .

Abstract

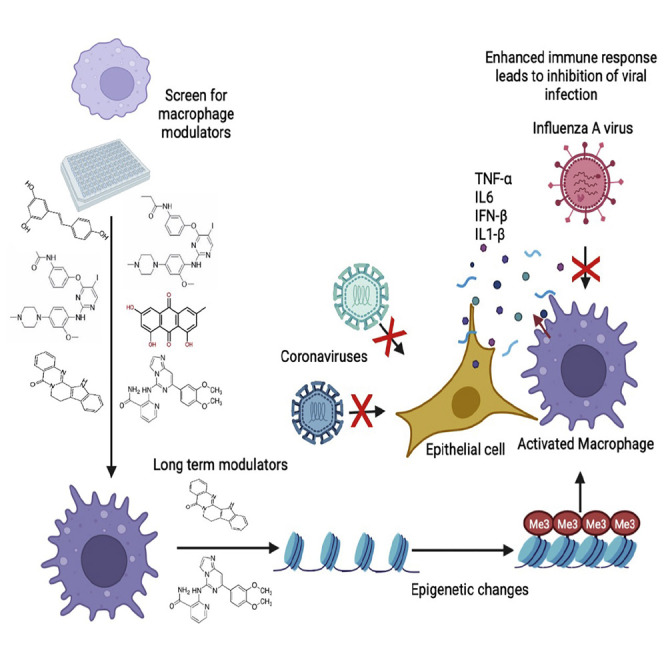
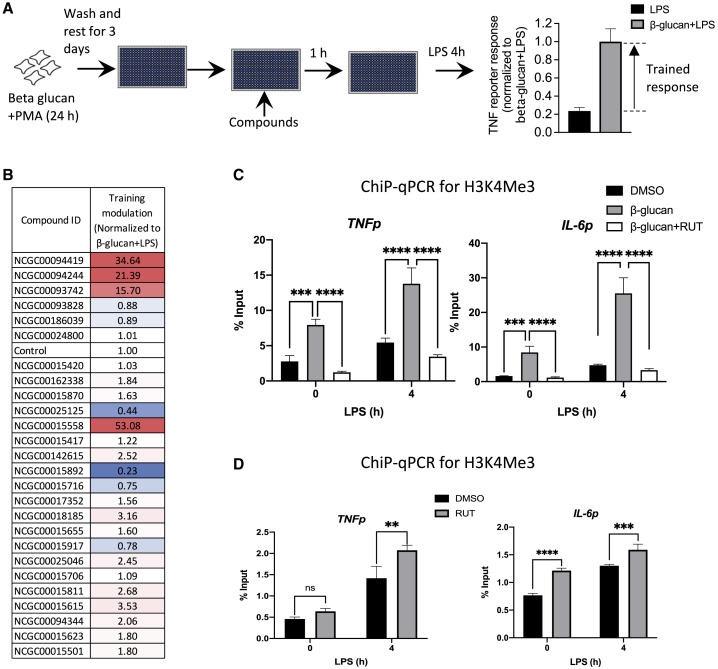
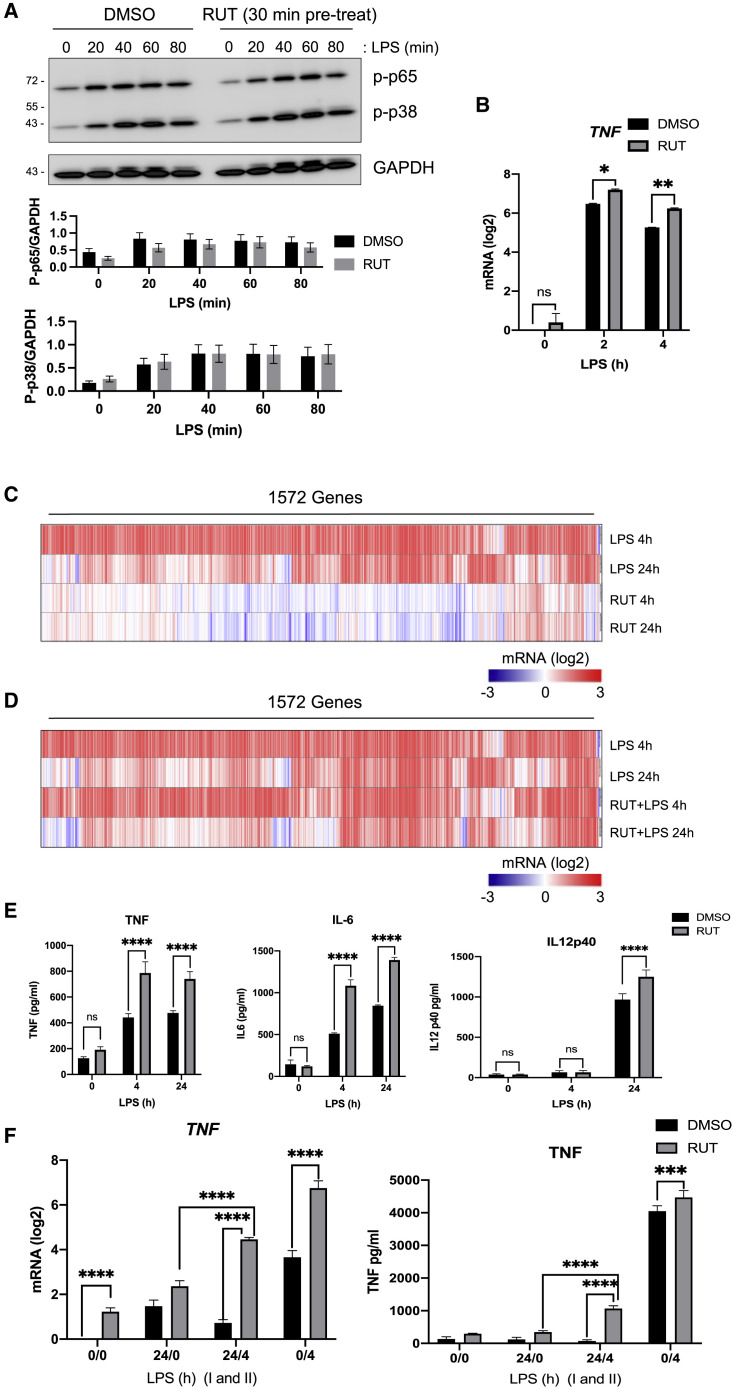
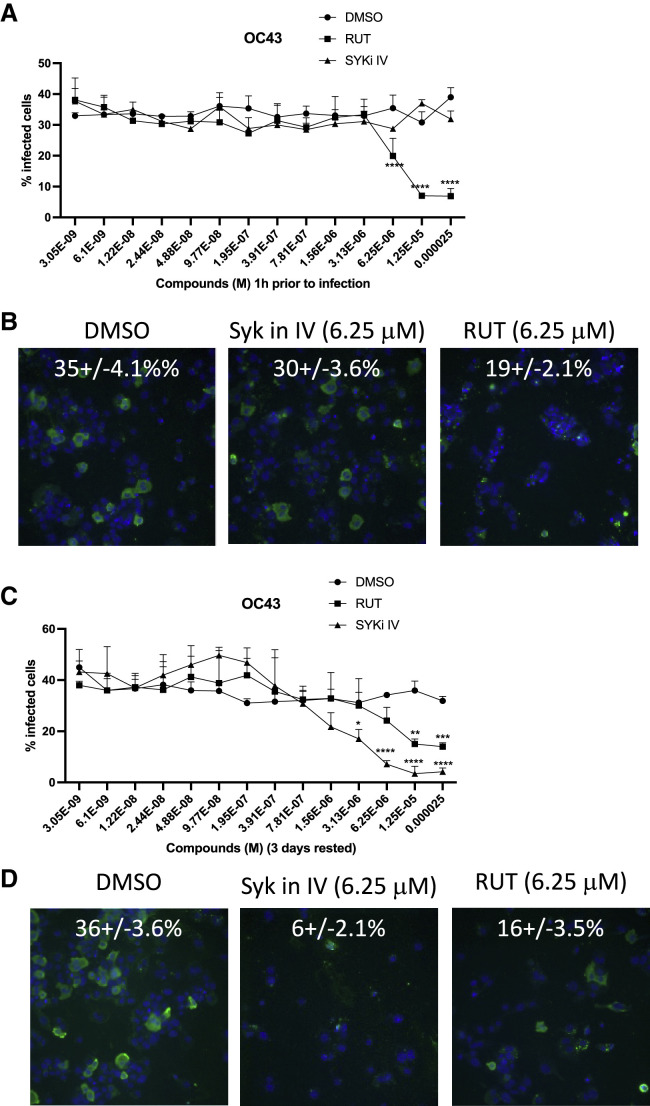
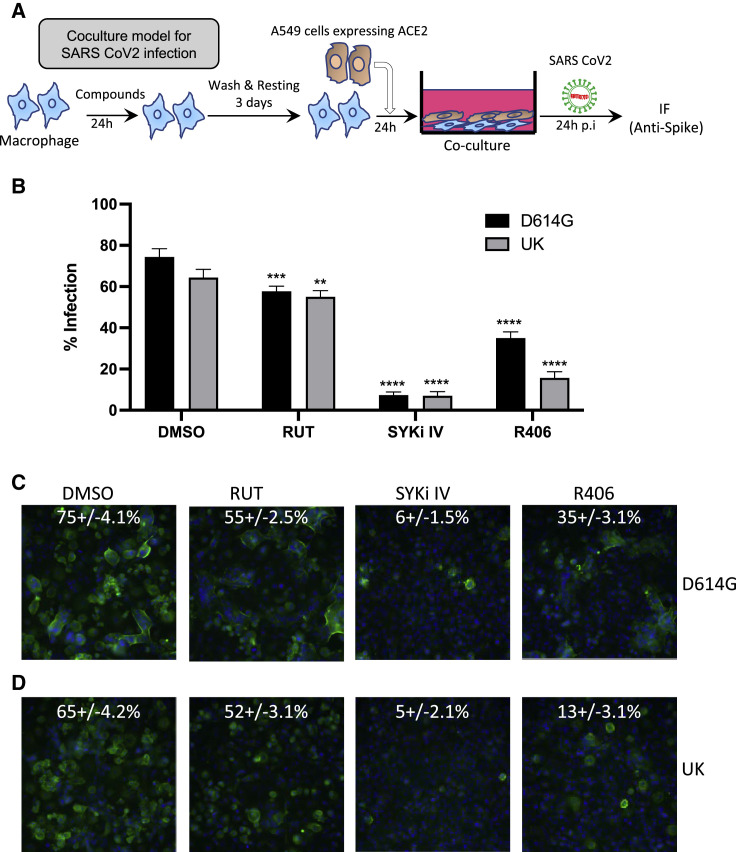
Biologically active small molecules can impart modulatory effects, in some cases providing extended long-term memory. In a screen of biologically active small molecules for regulators of tumor necrosis factor (TNF) induction, we identify several compounds with the ability to induce training effects on human macrophages. Rutaecarpine shows acute and long-term modulation, enhancing lipopolysaccharide (LPS)-induced pro-inflammatory cytokine secretion and relieving LPS tolerance in human macrophages. Rutaecarpine inhibits β-glucan-induced H3K4Me3 marks at the promoters of several pro-inflammatory cytokines, highlighting the potential of this molecule to modulate chromosomal topology. Syk kinase inhibitor (SYKi IV), another screen hit, promotes an enhanced response to LPS similar to that previously reported for β-glucan-induced training. Macrophages trained with SYKi IV show a high degree of resistance to influenza A, multiple variants of severe acute respiratory syndrome coronavirus 2 (SARS-CoV-2), and OC43 coronavirus infection, highlighting a potential application of this molecule and other SYKis as prophylactic treatments for viral susceptibility.

Keywords: CP: Immunology; LPS tolerance; NFAT-2; SARS-CoV-2; Syk inhibition; innate immune training; rutaecarpine.


Conflict of interest statement

Declaration of interests The authors declare no competing interests.

Figures

None
Graphical abstract
Figure 1
Figure 1
Identification of bioactive modulators of the innate immune response (A) Schematic of the reporter human macrophage cell line and assay protocol for the bioactive molecule screen. Matched plates were prepared for both the TNF reporter assay and cytotoxicity measurement. (B) Schematic of hit compound classification from the primary screen based on phenotypic activity curve classes (see STAR Methods). (C) Percentage of compounds identified from the primary screen classified as inhibitors and activators. (D) Number of compounds in different curve sub classes. Data in (C) and (D) show representative data from a screen performed over a broad range of compound doses.
Figure 2
Figure 2
Inhibitors and activators differentially modulate secretion of TNF and IL-6 in LPS-stimulated primary macrophages Non-cytotoxic compounds scoring in curve classes +1.1 and −1.1 were chosen to assay for effects on cytokine secretion in primary human macrophages. (A and B) Cells were pre-treated with 10 μM compounds for 0.5, 4, and 24 h before challenge with 100 ng/mL LPS. TNF (A) and IL-6 (B) secretion were measured by ELISA at 4 and 24 h post-LPS. (C and D) Screen to identify training molecules. Cells were pre-treated with 10 μM compounds for 24 h, then washed and rested for 3 days before challenge with 100 ng/mL LPS. TNF (C) and IL-6 (D) secretion were measured by ELISA at 4 and 24 h post-LPS. Average of 3 replicates was normalized to the respective DMSO control. p values for each compound were calculated in comparison to the DMSO control and are shown on the right side of each treatment. (E) Schematic summarizing the primary cell validation screens performed for acute modulators of cytokine secretion (in A and B) and for long-term modulators (training molecules) of cytokine secretion (in C and D).
Figure 3
Figure 3
SYKi IV treatment followed by resting trains human macrophages for enhanced responses to LPS Primary human macrophages were pre-treated ±10 μM SYK IV for 24 h and rested for 3 days prior to 100 ng/mL LPS challenge. (A and B) RNA-seq analysis after 4 and 24 h LPS. (A) Heatmap of 1,985 genes induced >1.0 (log2) by 4 h LPS are shown for all conditions. (B) Volcano plot comparing differentially expressed genes in SYKi IV + LPS versus LPS alone at 4 h. (C) qPCR analysis of TNF, IL6, and IFNB1 mRNA. (D) ELISA assay of secreted TNF and IL-6. (E) Western blot analysis of NFAT2 in the cytosolic (GAPDH-enriched) and nuclear (hnRNPL-enriched) fractions of SYKi IV- (10 μM) or DMSO-treated THP1 cells. Quantitation of the band intensity is shown below as the normalized value to the loading controls, GAPDH for cytosol and hnRNPL for nuclear samples. (F) Quantification of NFAT2 nuclear intensity in THP1 cells following addition of SYKi IV (10 μM) from imaging data in Figure S3E. (G) U937 cells were treated with DMSO or SYKi IV for 24 h and rested for 3 days, and H3K4Me3 enrichment was measured by ChIP-qPCR at the promoters of TNF, IL-6, and IL-1β. (H) Schematic of experimental design for data in (A)–(G). Data in (A)–(G) are representative of three independent experiments. Experiments in (F) are mean ± SD of 10 fields imaged in each of 3 independent experiments. (C and D) Area expressed as mean ± SD; ∗∗p < 0.01, ∗∗∗p < 0.001 (two-way ANOVA followed by Sidak’s multiple comparison test).
Figure 4
Figure 4
RUT inhibits β-glucan-induced training in differentiated THP1 cells (A) Assay design to test modulation of β-glucan-induced innate immune training. TNF reporter THP1 cells were treated with 5 ng/mL β-glucan during 10 ng/mL PMA differentiation, then compounds at 10 μM before challenge with 100 ng/mL LPS. (B) TNF reporter luciferase readings were normalized to the β-glucan + LPS control. (C) ChIP-qPCR analysis from THP1 cells treated as in (A) with 10 μM RUT at the compound step. Nuclear lysates were immunoprecipitated with H3K4Me3 antibody before qPCR with TNF and IL-6 promoter-specific primers. (D) THP1 cells were trained with 10 μM RUT for 24 h, washed, and rested for 3 days before 5 h challenge with 100 ng/mL LPS. Nuclear lysates were immunoprecipitated with H3K4Me3 antibody before qPCR with TNF and IL-6 promoter-specific primers. Data in (B) are averaged from three replicates. Data in (C and D) are representative of three independent experiments expressed as mean ± SD; p < 0.05, ∗∗p < 0.01, ∗∗∗p < 0.001 (two-way ANOVA followed by Tukey’s, C, and Sidak’s, D, multiple comparison test).
Figure 5
Figure 5
RUT selectively enhances transcription and secretion of pro-inflammatory cytokines in primary macrophages (A and B) Primary human macrophages were pre-treated with 10 μM RUT prior to 100 ng/mL LPS challenge. (A) Western blot analysis of phosphorylated p65/NF-κB and p38/MAPK. Quantitation of the band intensity is shown below as the normalized value to the loading control, GAPDH. (B) qPCR analysis of TNF mRNA. (C) RNA-seq analysis of primary human macrophages treated with 100 ng/mL LPS or 10 μM RUT for the indicated times. (D) RNA-seq analysis of primary human macrophages treated with 100 ng/mL LPS ±10 μM RUT. RUT+ cells were treated and rested for 3 days prior to LPS challenge. For (C) and (D), 1,572 genes induced >1.0 (log2) by 4 h LPS are shown. (E) Secreted cytokine measurements from primary human macrophages treated with 100 ng/mL LPS ±10 μM RUT. RUT+ cells were treated and rested for 3 days prior to LPS challenge. (F) RUT releases the tolerance induced by LPS. qPCR (left) and ELISA (right) analysis of LPS-tolerant human primary macrophages upon treatment with RUT. Primary human macrophages were treated ±100 ng/mL LPS for 24 h (I), rested for 24 h, then treated ±10 μM RUT for 24 h before the second ±100 ng/mL LPS challenge (II) for 4 h. Data in (B), (F), and (G) are representative of three independent experiments, expressed as mean ± SD; p < 0.05, ∗∗p < 0.01, ∗∗∗p < 0.001 (two-way ANOVA followed by Sidak’s multiple comparison test). Data in (C) and (E) are average of 3 replicates normalized to an untreated control.
Figure 6
Figure 6
SYKi IV-induced macrophage training can restrict coronavirus infection (A) Percentage infection of OC43 in differentiated THP1 cells treated ±SYKi IV or RUT in a dose range of 25 μM to 3 nM 1 h prior to infection with OC43 coronavirus for 24 h. (B) Representative images of the OC43 infection at 6.25 μM SYKi IV and RUT from (A). (C) Percentage infection of OC43 in differentiated THP1 cells treated ±SYKi IV or RUT in a dose range of 25 μM to 3 nM for 24 h and rested for 3 days prior to infection with OC43 coronavirus for 24 h. (D) Representative image of the OC43 infection at 6.25 μM SYKi IV and RUT from (C). Images in (B) and (D) show representative data from 48 imaged fields. Quantified data in (A) and (C) are representative of three independent experiments, expressed as mean + SD. p values are shown as p < 0.05, ∗∗p < 0.01, ∗∗∗p < 0.001 (ordinary two-way ANOVA).
Figure 7
Figure 7
SYKi IV-induced macrophage training restricts SARS-CoV-2 infection in co-culture system of A549-hACE2 and macrophages (A) Schematic of the co-culture system for SARS-CoV-2 infection. Primary human macrophages were treated ±6.25 μM compounds for 24 h and rested for 3 days before plating with A549-hACE2 cells for 16 h prior to infection with SARS-CoV-2 variants at a multiplicity of infection (MOI) 1.0 for 24 h. (B) Percentage of cells infected with SARS-CoV-2 in co-culture of A549 cells together with macrophages trained with SYKi IV, RUT, and R406 at 6.25 μM. (C and D) Representative images of SARS-CoV-2 variants D614G (C) and UK (D) infection from experiment in (B). Images in (C) and (D) show representative data from 48 imaged fields. Quantified data in (B) are representative of three independent experiments, expressed as mean + SD. p values for significant changes are shown as p < 0.05, ∗∗p < 0.01, ∗∗∗p < 0.001 (ordinary two-way ANOVA).

Similar articles

Cited by

References

    1. Aaby P., Jensen H., Samb B., Cisse B., Sodemann M., Jakobsen M., Poulsen A., Rodrigues A., Lisse I.M., Simondon F., Whittle H. Differences in female-male mortality after high-titre measles vaccine and association with subsequent vaccination with diphtheria-tetanus-pertussis and inactivated poliovirus: reanalysis of West African studies. Lancet. 2003;361:2183–2188. - PubMed
    1. Arango Duque G., Descoteaux A. Macrophage cytokines: involvement in immunity and infectious diseases. Front. Immunol. 2014;5:491. - PMC - PubMed
    1. Arron J.R., Winslow M.M., Polleri A., Chang C.P., Wu H., Gao X., Neilson J.R., Chen L., Heit J.J., Kim S.K., et al. NFAT dysregulation by increased dosage of DSCR1 and DYRK1A on chromosome 21. Nature. 2006;441:595–600. - PubMed
    1. Atri C., Guerfali F.Z., Laouini D. Role of human macrophage polarization in inflammation during infectious diseases. Int. J. Mol. Sci. 2018;19:1801. - PMC - PubMed
    1. Bekkering S., Blok B.A., Joosten L.A., Riksen N.P., Van Crevel R., Netea M.G. In vitro experimental model of trained innate immunity in human primary monocytes. Clin. Vaccine Immunol. 2016;23:926–933. - PMC - PubMed

Publication types