. 2022 Oct 10;40(10):1190-1206.e9.
doi: 10.1016/j.ccell.2022.09.007. Epub 2022 Sep 29.

Inhibition of the CtBP complex and FBXO11 enhances MHC class II expression and anti-cancer immune responses

Affiliations

Inhibition of the CtBP complex and FBXO11 enhances MHC class II expression and anti-cancer immune responses

Kah Lok Chan et al. Cancer Cell. .

Abstract

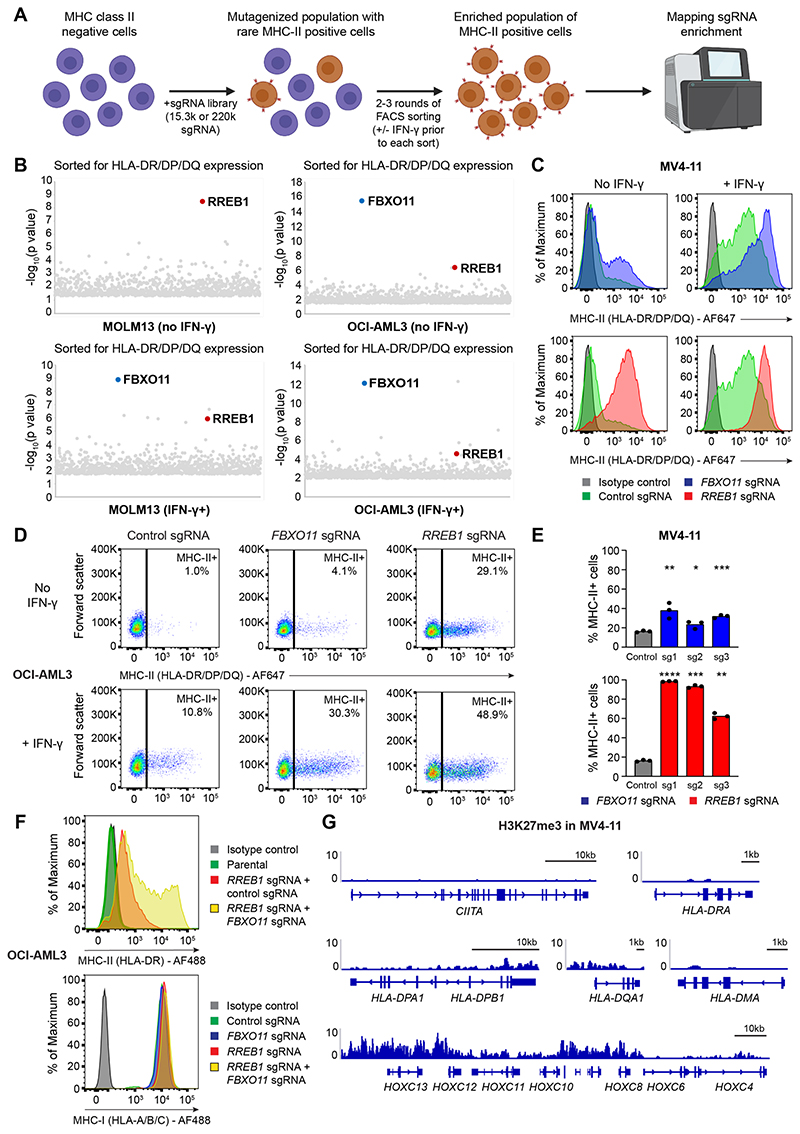
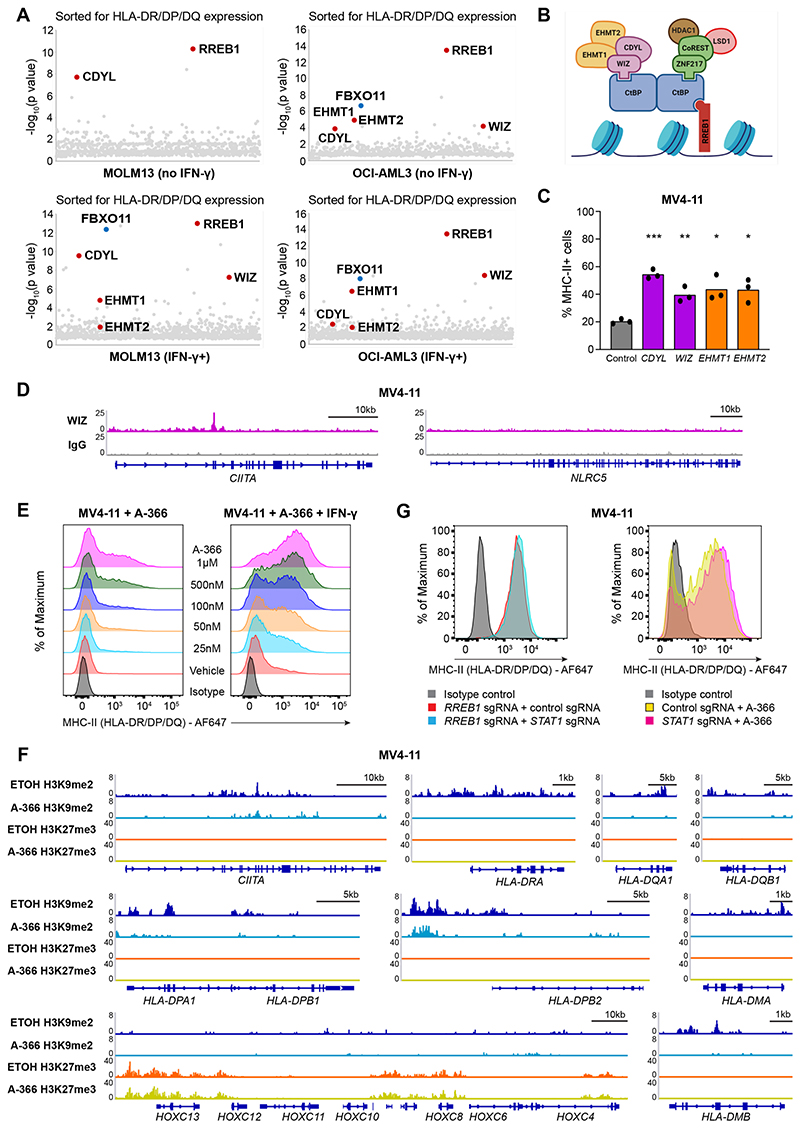
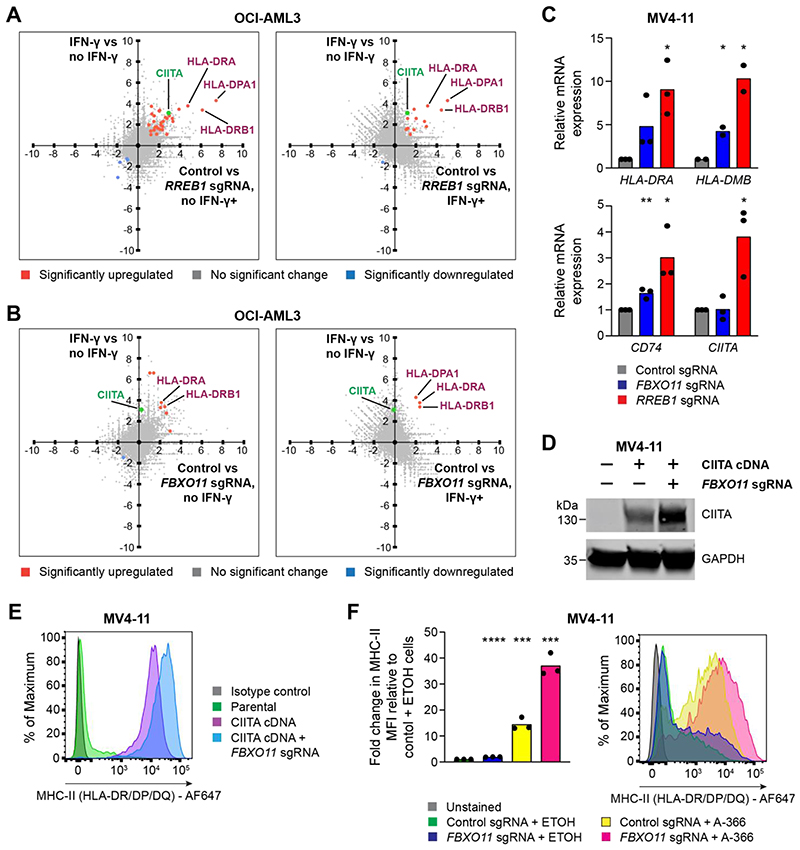
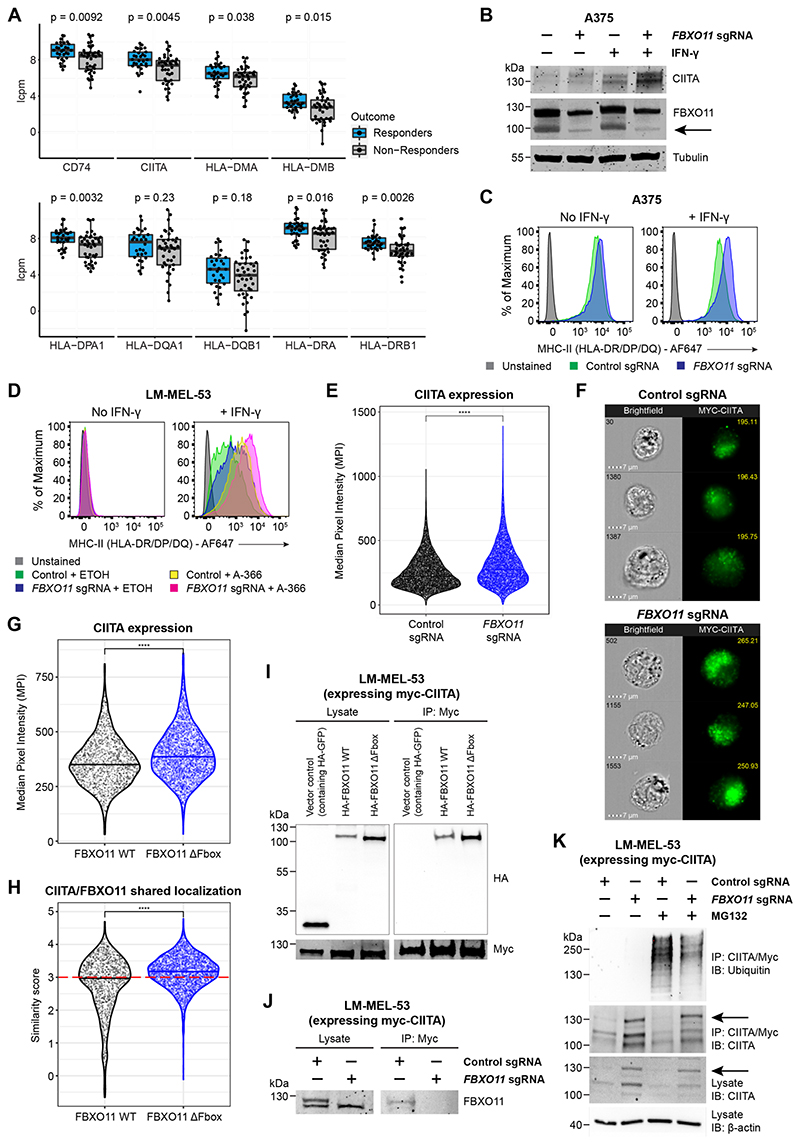
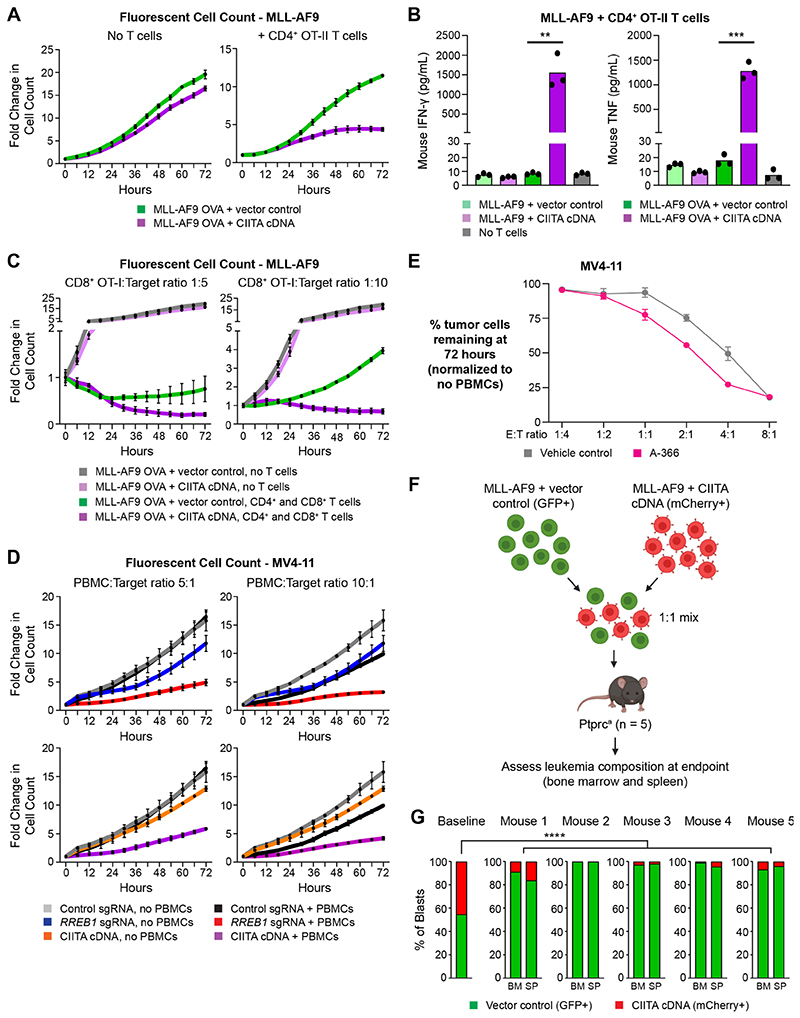
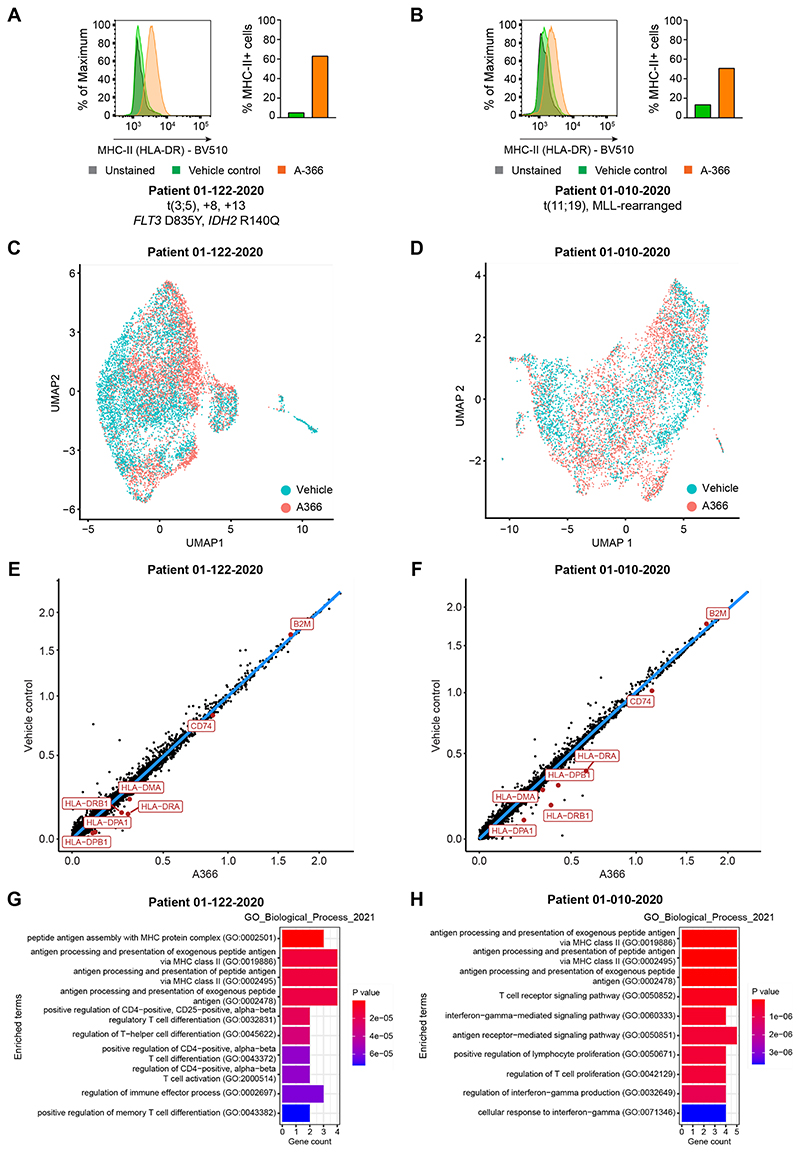
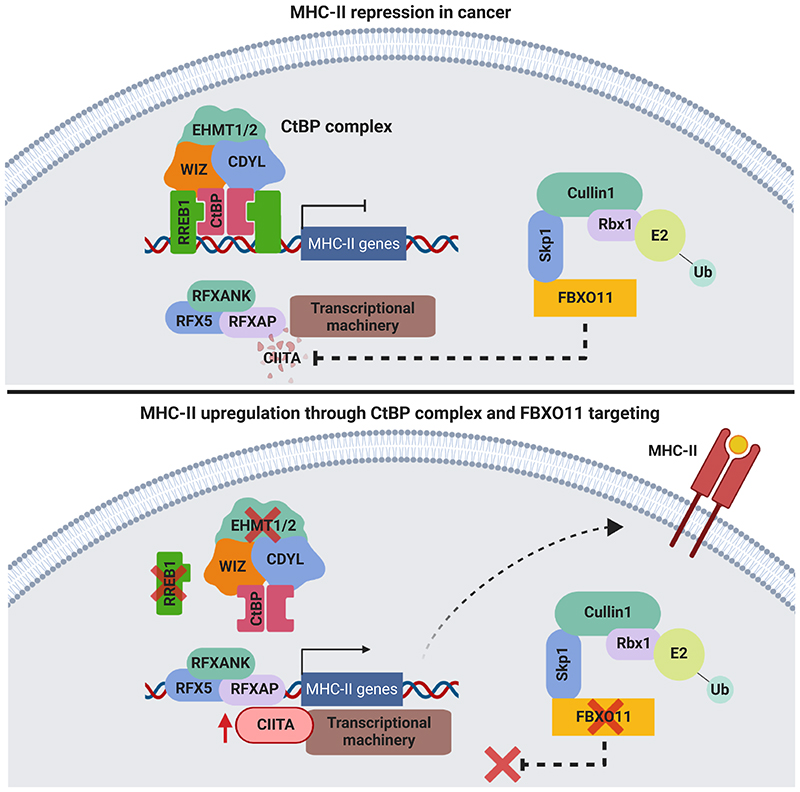
There is increasing recognition of the prognostic significance of tumor cell major histocompatibility complex (MHC) class II expression in anti-cancer immunity. Relapse of acute myeloid leukemia (AML) following allogeneic stem cell transplantation (alloSCT) has recently been linked to MHC class II silencing in leukemic blasts; however, the regulation of MHC class II expression remains incompletely understood. Utilizing unbiased CRISPR-Cas9 screens, we identify that the C-terminal binding protein (CtBP) complex transcriptionally represses MHC class II pathway genes, while the E3 ubiquitin ligase complex component FBXO11 mediates degradation of CIITA, the principal transcription factor regulating MHC class II expression. Targeting these repressive mechanisms selectively induces MHC class II upregulation across a range of AML cell lines. Functionally, MHC class II+ leukemic blasts stimulate antigen-dependent CD4+ T cell activation and potent anti-tumor immune responses, providing fundamental insights into the graft-versus-leukemia effect. These findings establish the rationale for therapeutic strategies aimed at restoring tumor-specific MHC class II expression to salvage AML relapse post-alloSCT and also potentially to enhance immunotherapy outcomes in non-myeloid malignancies.

Keywords: CtBP; FBXO11; MHC class II; acute myeloid leukemia; bone marrow transplantation; cancer epigenetics; gene regulation; melanoma; tumor immunology.


Conflict of interest statement

Declaration of interests M.A.D. has been a member of advisory boards for GlaxoSmithKline, CTx CRC, Storm Therapeutics, Celgene, and Cambridge Epigenetix. S.-J.D. has been a member of advisory boards for AstraZeneca. The M.A.D. and S.-J.D. laboratories have received research funding from CTx CRC and Pfizer. The S.-J.D. laboratory has received research funding from Genentech. P.A.B. has received research funding from AstraZeneca, Bristol Myers Squibb, and Gilead Sciences. A.H.W. has been a member of advisory boards for Novartis, Janssen, Amgen, Roche, Pfizer, Abbvie, Servier, Gilead, BMS, Macrogenics, and Agios, receives research funding to the Institution from Novartis, Abbvie, Servier, BMS, Astra Zeneca, and Amgen, and serves on speaker’s bureaus for Abbvie, Novartis, and BMS. All other authors declare no competing interests.

Figures

Figure 1
Figure 1. Genome-wide CRISPR screens identify key MHC-II regulators in AML.
(A)CRISPR screen workflow. MHC-II-negative cells (MOLM13 and OCI-AML3) were mutagenized with pooled lentiviral libraries comprising 220,000 sgRNA (whole-genome screen) or 15,300 sgRNA (targeted epigenetic screen) and MHC-II+ cells were enriched by FACS. (B)Whole-genome CRISPR screen results. For IFN-γ+ sorts, cells were pulsed with IFN-γ 25 ng/mL for 48 hours prior to each sort. Bubble plots show the top 1,000 enriched genes identified. P values were calculated using the RSA algorithm (König et al., 2007). (C and D) Cell surface MHC-II expression in MV4-11 Cas9 cells (C) and OCI-AML3 Cas9 cells (D) transduced with a pool of 3 sgRNAs targeting the indicated genes or a control sgRNA, in the presence or absence of IFN-γ 10 ng/mL (MV4-11) or 25 ng/mL (OCI-AML3) for 48 hours. Representative plots from 3 experiments. (E)Cell surface MHC-II expression in MV4-11 Cas9 cells transduced with individual sgRNAs targeting the indicated genes or a control sgRNA. Bars depict the mean percentage of MHC-II+ cells from 3 independent experiments indicated by points. Statistical analysis by unpaired t test compared to control cells; p value * < 0.05, ** < 0.01, *** < 0.001, **** < 0.0001. (F)Cell surface MHC-I and MHC-II expression in OCI-AML3 Cas9 cells transduced with sgRNAs targeting the indicated genes and/or a control sgRNA. Representative plots from 2 experiments. (G)Chromatin immunoprecipitation (ChIP) sequencing showing H3K27me3 levels at MHC-II genes and the HoxC cluster. Data are from GEO: GSM1513828 (Göllner et al., 2017). Y axes indicate reads per million (rpm). See also Figure S1.
Figure 2
Figure 2. Transcriptional silencing of MHC-II is mediated by the CtBP co-repressor complex.
(A)Targeted epigenetic CRISPR screen results. For IFN-γ+ sorts, cells were pulsed with IFN-γ 25 ng/mL for 48 hours prior to each sort. Bubble plots show the top 1,000 enriched genes identified, with components of the CtBP complex indicated in red. P values were calculated using the RSA algorithm (König et al., 2007). (B)Schematic representation of the CtBP complex. (C)Cell surface MHC-II expression in MV4-11 Cas9 cells transduced with a pool of 2 sgRNAs targeting the indicated genes or a control sgRNA. Bars depict the mean percentage of MHC-II+ cells from 3 independent experiments indicated by points. Statistical analysis by unpaired t test compared to control cells; p value * < 0.05, ** < 0.01, *** < 0.001. (D)Chromatin immunoprecipitation sequencing (ChIP-seq) plots for WIZ in MV4-11 cells at indicated genes. (E)Cell surface MHC-II expression in MV4-11 cells treated with EHMT1/2 inhibitor (A-366) at the indicated doses or vehicle control in the presence or absence of IFN-γ 10 ng/mL for 24 hours. Representative plots from 2 experiments. (F)CUT&Tag chromatin profiling of H3K9me2 and H3K27me3 at MHC-II genes in MV4-11 cells treated with A-366 1μM or vehicle control (ETOH) for 7 days. The HoxC cluster is included as a positive H3K27me3 control. (G)Cell surface MHC-II expression in MV4-11 RREB1 KO cells transduced with a pool of 2 sgRNAs targeting STAT1 or a control sgRNA, and MV4-11 STAT1 KO or control cells treated with A-366 1μM for 7 days. Representative plots from 2 experiments. See also Figure S2.
Figure 3
Figure 3. The CtBP complex and FBXO11 synergistically regulate MHC-II in AML.
(A and B) RNA-seq correlation plots showing differential gene expression in OCI-AML3 cells in the presence or absence of IFN-γ 25 ng/mL for 48 hours (Y-axis) and OCI-AML3 Cas9 cells transduced with control and RREB1 (A) or FBXO11 (B) sgRNA in the presence or absence of IFN-γ 25 ng/mL for 48 hours (X-axis). Fold change > 1.0 and false discovery rate < 0.05 for highlighted genes (in blue and orange) with significant differential gene expression. CIITA is labelled separately in green and reaches significance only in the RREB1 sgRNA, no IFN-γ analysis. (C)mRNA expression of MHC-II genes in MV4-11 Cas9 cells transduced with control, FBXO11 or RREB1 sgRNA. Bars depict mean fold change in expression from 3 independent experiments and points indicate the mean of technical triplicates from individual experiments. Statistical analysis by unpaired t test compared to control cells, with significant changes indicated; p value * < 0.05, ** < 0.01. (D and E) Immunoblot (D) and cell surface MHC-II expression (E) in MV4-11 Cas9 cells transduced with a retroviral vector encoding CIITA cDNA and with or without FBXO11 sgRNA. Representative data from 2 experiments. (F) Cell surface MHC-II expression and mean fold change in median fluorescence intensity (MFI) in MV4-11 Cas9 cells transduced with control or FBXO11 sgRNA and treated with EHMT1/2 inhibitor (A-366 1μM) or vehicle control (ETOH) for 7 days. Bars depict mean fold change in MFI from 3 independent experiments indicated by points. Statistical analysis by unpaired t test compared to control sgRNA + ETOH cells, with significant changes indicated; p value *** < 0.001, **** < 0.0001. See also Figures S3 and S4.
Figure 4
Figure 4. FBXO11 loss increases surface MHC-II expression through stabilization of CIITA.
(A)mRNA expression of MHC-II genes in tumor biopsy samples from melanoma patients treated with immune checkpoint inhibitors. The upper limit, center and lower limit of each box denotes the upper quartile, median and lower quartile of the data, respectively. P values were calculated using the Wilcoxon rank-sum test. Data are from ENA: PRJEB23709 (Gide et al., 2019). Y axes indicate log2 counts per million (lcpm). (B and C) Immunoblot (B) and cell surface MHC-II expression (C) in A375 cells transduced with a retroviral vector encoding CIITA cDNA with or without FBXO11 sgRNA, in the presence or absence of IFN-γ 10 ng/mL for 48 hours. Representative data from 2 experiments. (D)Cell surface MHC-II expression in LM-MEL-53 Cas9 cells transduced with control or FBXO11 sgRNA and treated with EHMT1/2 inhibitor (A-366 3μM) or vehicle control for 7 days, in the presence or absence of IFN-γ 10 ng/mL for 48 hours. Representative data from 2 experiments. (E)Myc-CIITA expression measured as Median Pixel Intensity (MPI) in LM-MEL-53 Cas9 cells transduced with control or FBXO11 sgRNA. Each data point represents a single cell measured and bars represent the group median. Statistical significance was calculated using Dunn’s test with Bonferroni correction for multiple comparisons. **** = p < 0.0001. Representative data from 2 experiments. (F)Representative images showing brightfield microscopy (cell number at top left) and Myc-CIITA expression (MPI value at top right) in LM-MEL-53 Cas9 cells transduced with control or FBXO11 sgRNA. (G)Myc-CIITA expression measured as MPI in LM-MEL-53 cells expressing FBXO11 WT or FBXO11 ΔFbox. Each data point represents a single cell measured and bars represent the group median. Statistical significance was calculated using Dunn’s test with Bonferroni correction for multiple comparisons. **** = p < 0.0001. Representative data from 2 experiments. (H)Summary of shared localization between CIITA and FBXO11 in LM-MEL-53 cells expressing FBXO11 WT or FBXO11 ΔFbox. High shared localization defined by similarity score ≥3 (red dotted line), as previously described (Beum et al., 2006; Erie et al., 2011; George et al., 2006). Statistical significance was calculated using Dunn’s test with Bonferroni correction for multiple comparisons. **** = p < 0.0001. Representative data from 2 experiments. (I)Immunoprecipitation of myc-CIITA from lysates of LM-MEL-53 cells expressing FBXO11 WT or FBXO11 ΔFbox, analyzed by immunoblot. Lysate, 5% of input. Experiments performed twice. (J)Immunoprecipitation of myc-CIITA from lysates of LM-MEL-53 Cas9 cells transduced with control or FBXO11 sgRNA, analyzed by immunoblot. Lysate, 5% of input. Experiments performed twice. (K)Immunoprecipitation of myc-CIITA from lysates of LM-MEL-53 Cas9 cells transduced with control or FBXO11 sgRNA and with or without MG-132 treatment, analyzed by immunoblot. Lysate, 5% of input. Experiments performed twice. See also Figures S4 and S5.
Figure 5
Figure 5. MHC-II expression on leukemic blasts facilitates adaptive anti-cancer immune responses.
(A)Fold change of fluorescent cell count for MLL-AF9 OVA-expressing cells transduced with a retroviral vector encoding CIITA cDNA or vector control, following co-culture with CD4+ OT-II T cells at an effector:target (E:T) ratio of 4:1. Plots show mean ± SEM of technical triplicates from a representative experiment, performed twice. (B)Cytometric bead array (CBA) assay for T cell cytokines following 24 hour co-culture of OT-II CD4+ T cells with MLL-AF9 cells expressing OVA peptide and/or CIITA cDNA or vector control, at an E:T ratio of 2:1. Bars depict the mean of technical triplicates from a representative experiment, performed twice. Statistical analysis by unpaired t test compared to respective vector control cells, with significant changes indicated; p value ** < 0.01, *** < 0.001. (C)Fold change of fluorescent cell count for MLL-AF9 OVA-expressing cells transduced with a retroviral vector encoding CIITA cDNA or vector control, following co-culture with CD4+ OT-II T cells at an E:T ratio of 4:1 and CD8+ T cells at the indicated E:T ratios. Plots show mean ± SEM of technical triplicates from a representative experiment, performed twice. (D)Fold change of fluorescent cell count for MV4-11 Cas9 cells transduced with RREB1 sgRNA, a retroviral vector encoding CIITA cDNA or vector control, following co-culture with human peripheral blood mononuclear cells (PBMC) at the indicated E:T ratios. Plots show mean ± SEM of technical triplicates from a representative experiment, performed twice. (E)Percent remaining live MV4-11 cells following 72 hour co-culture with human CD4+ T cells at the indicated E:T ratios. Cells were treated with A366 1μM or vehicle control for the duration of the experiment. Plots show mean ± SEM of technical triplicates from a representative experiment, performed twice. (F)Overview of in vivo competition assay, utilizing MLL-AF9 cells transduced with GFP vector control or a retroviral vector encoding mCherry and CIITA cDNA. (G)Proportion of GFP+ control and mCherry+ CIITA-expressing cells in bone marrow (BM) and spleen (SP) at disease endpoint. Two-tailed binomial test was performed to compare expected and observed proportions in each sample compared to baseline. **** = p < 0.0001. See also Figures S5 and S6.
Figure 6
Figure 6. Pharmacological EHMT1/2 inhibition selectively induces MHC-II upregulation in primary AML cells.
(A and B) Cell surface MHC-II expression in primary AML cells from patients treated with EHMT1/2 inhibitor (A-366 1μM) or vehicle control for 5-7 days. Data is shown from a representative experiment, performed twice. (C and D) UMAP projections of primary AML cells treated with EHMT1/2 inhibitor (A-366 1μM) or vehicle control for 5-7 days. Cells are highlighted by treatment. (E and F) Scatterplots showing normalized gene expression in primary AML cells treated with EHMT1/2 inhibitor (A-366 1μM) or vehicle control for 5-7 days. MHC-II pathway genes and B2M are highlighted. (G and H) Gene set enrichment analysis performed on all genes differentially upregulated with A-366 treatment in primary AML cells.
None

References

    1. Anders S, Pyl PT, Huber W. HTSeq—a Python framework to work with high-throughput sequencing data. Bioinformatics. 2014;31:166–169. - PMC - PubMed
    1. Aubrey BJ, Kelly Gemma L, Kueh Andrew J, Brennan Margs S, O’Connor L, Milla L, Wilcox S, Tai L, Strasser A, Herold Marco J. An Inducible Lentiviral Guide RNA Platform Enables the Identification of Tumor-Essential Genes and Tumor-Promoting Mutations In Vivo. Cell Rep. 2015;10:1422–1432. - PubMed
    1. Axelrod ML, Cook RS, Johnson DB, Balko JM. Biological Consequences of MHC-II Expression by Tumor Cells in Cancer. Clin Cancer Res. 2019;25:2392–2402. - PMC - PubMed
    1. Becht E, McInnes L, Healy J, Dutertre CA, Kwok IWH, Ng LG, Ginhoux F, Newell EW. Dimensionality reduction for visualizing single-cell data using UMAP. Nat Biotechnol. 2018 - PubMed
    1. Bejanyan N, Weisdorf DJ, Logan BR, Wang H-L, Devine SM, de Lima M, Bunjes DW, Zhang M-J. Survival of Patients with Acute Myeloid Leukemia Relapsing after Allogeneic Hematopoietic Cell Transplantation: A Center for International Blood and Marrow Transplant Research Study. Biol Blood Marrow Transplant. 2015;21:454–459. - PMC - PubMed

Publication types

MeSH terms