. 2022 Sep 30;13(1):5747.
doi: 10.1038/s41467-022-33375-w.

A transcriptional metastatic signature predicts survival in clear cell renal cell carcinoma

Affiliations

A transcriptional metastatic signature predicts survival in clear cell renal cell carcinoma

Adele M Alchahin et al. Nat Commun. .

Abstract

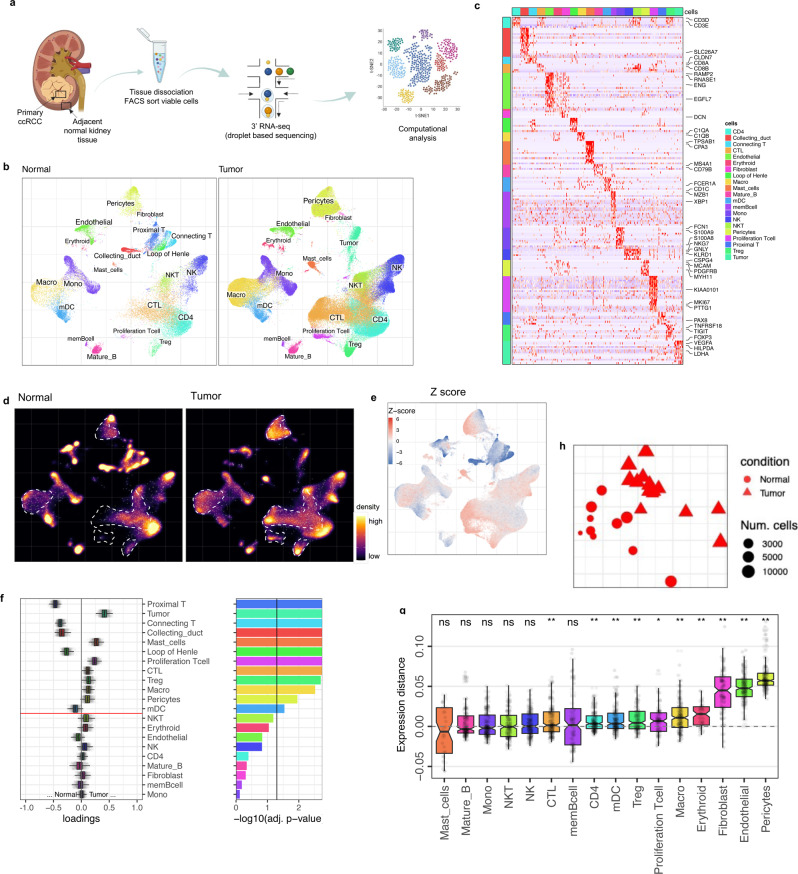
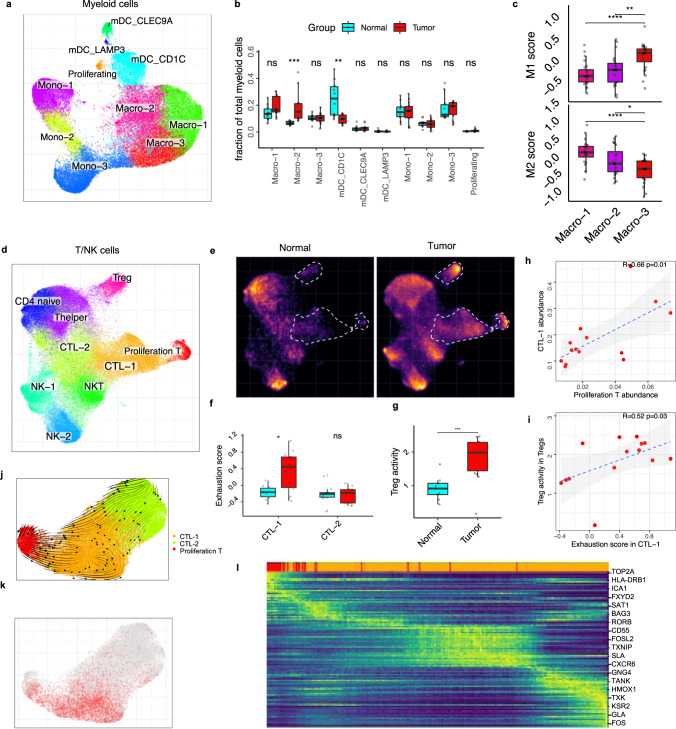
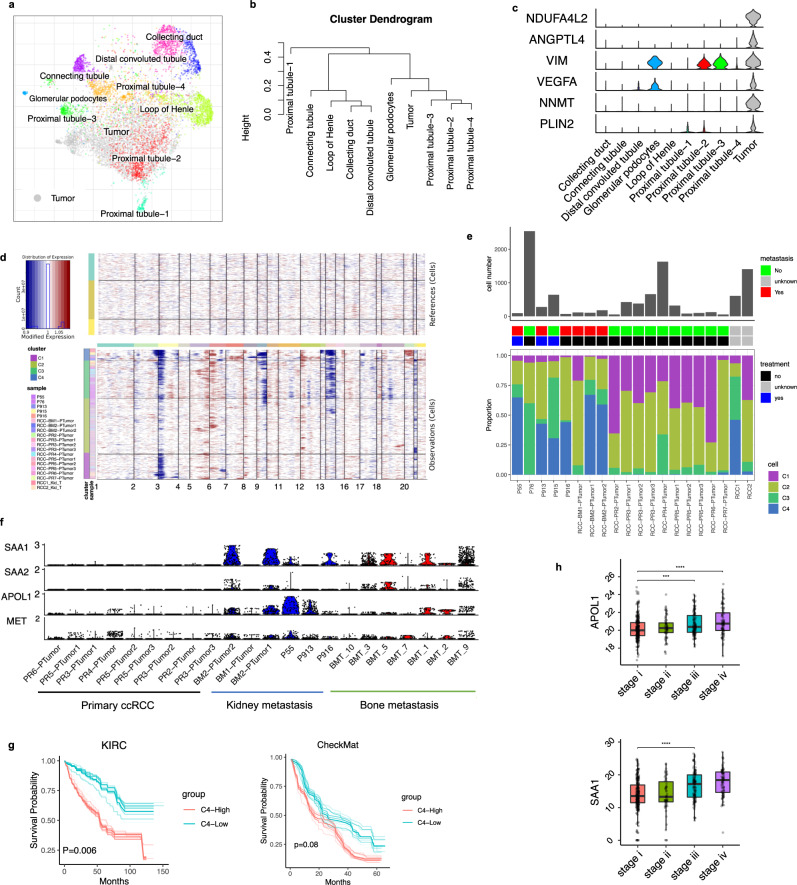
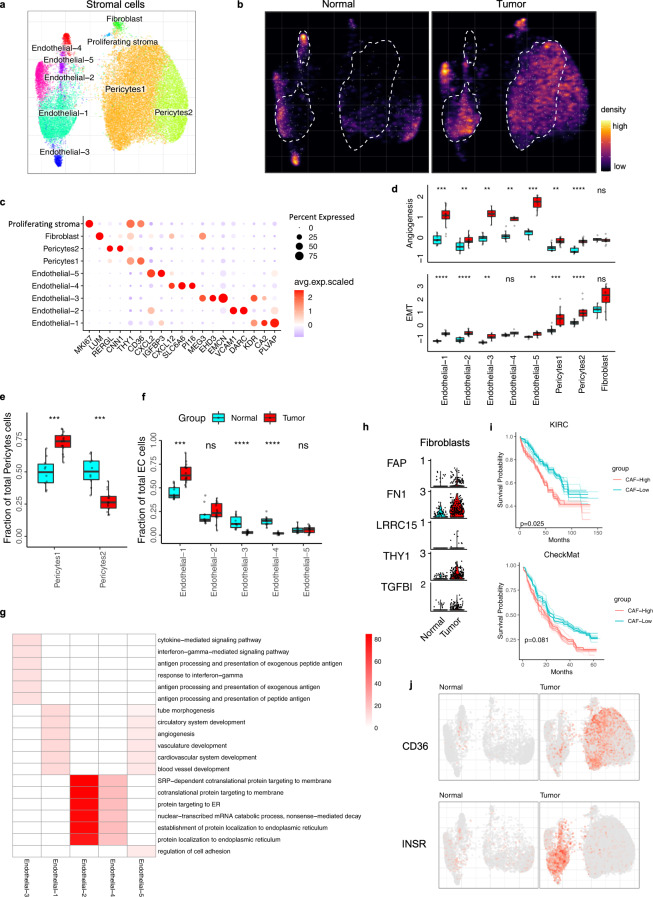
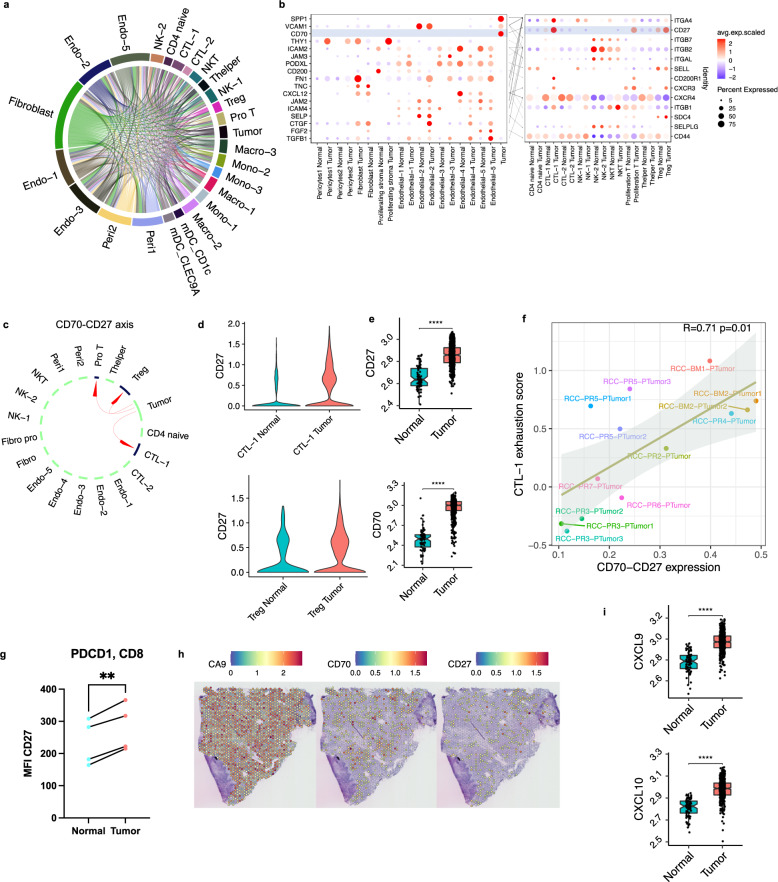
Clear cell renal cell carcinoma (ccRCC) is the most common type of kidney cancer in adults. When ccRCC is localized to the kidney, surgical resection or ablation of the tumor is often curative. However, in the metastatic setting, ccRCC remains a highly lethal disease. Here we use fresh patient samples that include treatment-naive primary tumor tissue, matched adjacent normal kidney tissue, as well as tumor samples collected from patients with bone metastases. Single-cell transcriptomic analysis of tumor cells from the primary tumors reveals a distinct transcriptional signature that is predictive of metastatic potential and patient survival. Analysis of supporting stromal cells within the tumor environment demonstrates vascular remodeling within the endothelial cells. An in silico cell-to-cell interaction analysis highlights the CXCL9/CXCL10-CXCR3 axis and the CD70-CD27 axis as potential therapeutic targets. Our findings provide biological insights into the interplay between tumor cells and the ccRCC microenvironment.


Conflict of interest statement

P.V.K. serves on the Scientific Advisory Board to Celsius Therapeutics Inc. and Biomage Inc. D.T.S. is a director and shareholder for Agios Therapeutics and Editas Medicines; a founder, director, shareholder, and scientific advisory board member for Magenta Therapeutics and LifeVault Bio, a shareholder and founder of Fate Therapeutics, and a director, founder, and shareholder for Clear Creek Bio, a consultant for FOG Pharma and VCanBio, and a recipient of sponsored research funding from Novartis. D.B.S. is a founder, consultant, and shareholder for Clear Creek Bio. The remaining authors declare no competing interests.

Figures

Fig. 1
Fig. 1. Single-cell landscape of the ecosystem in primary ccRCC and adjacent normal tissue.
a Experimental design created with Biorender.com and Adobe Illustrator. b Integrative analysis of scRNA-seq samples from 26 RCC samples, visualized using a common UMAP embedding for adj-normal (left) and tumor kidney tissue (right). c Heatmap showing expression of markers for major cell populations. d Changes in the composition of all compartments combining all sample fractions and is visualized as cell density on the joint embedding. e Statistical assessment of the cell density differences comparing tumor with adjacent normal. A two-side Wilcoxon test was used, visualized as a Z score. Red indicates increased cell abundance in tumor, blue indicates decreased cell abundance in tumor. f Change in cell composition evaluated by Compositional Data Analysis. The x-axis indicates the separating coefficient for each cell type, with the positive values corresponding to increased abundance in tumor, and negative to decreased abundance. The boxplots and individual data points show uncertainty based on bootstrap resampling of samples and cells (see Methods). Boxplot includes center line: median; box limits: upper and lower quartiles; whiskers extend at most 1.5× interquartile range past upper and lower quartiles. g The boxplots showing the magnitude of transcriptional change between primary RCC and normal kidney tissue in major cell populations. The magnitude is assessed based on a Pearson linear correlation coefficient, normalized by the medium variation within primary RCC and normal kidney tissue (see Methods). Statistics significance within each cell type is measured with permutation test in sample group (Pericytes **p = 0.003; Endothelial **p = 0.003; Fibroblast **p = 0.003; Erythroid **p = 0.005; Macro **p = 0.004; Proliferation T cell *p = 0.01; Treg **p = 0.009). Boxplot includes center line: median; box limits: upper and lower quartiles; whiskers extend at most 1.5× interquartile range past upper and lower quartiles. h MDS embedding of different samples, based on their overall expression distance. The similarity measure measures the magnitude of expression change for each subpopulation, using size-weighted average to combine them into an overall expression distance that controls the compositional differences. Shape indicates different sample fractions. Source data are provided as a Source Data file.
Fig. 2
Fig. 2. An immunosuppressive environment in ccRCC.
a UMAP embedding demonstrating myeloid subpopulations. b Boxplots showing the proportions of myeloid subsets divided by the total myeloid cell number (macro-2 ****p = 1.2e-05; mDC_CD1C **p = 0.0024), based on two-side Wilcoxon rank-sum test (tumor n = 14 samples, normal adjacent kidney, n = 10 samples). c Average expression of the M1 and M2 macrophage signature gene panel across different monocyte populations shown as boxplot. Statistics are accessed using two-side Wilcoxon rank-sum test (M1: macro-1 vs. macro-3 ****p = 3.4e-05; macro-2 vs. macro-3 **p = 0.0019. M2: macro-1 vs. macro-3 ****p = 4.2e-06; macro-2 vs. macro-3 *p = 0.046). d UMAP embedding showing T-cell subpopulations. e Changes in the composition of the myeloid compartment between tumor and normal is visualized as cell density on the joint embedding. f Boxplot presenting the exhaustion score of the T-cell population comparing the adjacent normal kidney samples (turquoise) with tumor samples (red). Statistics are accessed using two-side Wilcoxon rank-sum test. IQR range similar to panel b. Single-cell samples, tumor n = 14 samples, normal, n = 10 samples. CTL-1 *p = 0.013; CTL-2 p = ns. g Boxplots illustrate significant increase of Treg activity in the primary ccRCC. Statistics are accessed using two-side Wilcoxon rank-sum test. Treg ***p = 0.00065. Boxplots in b, c)and f, g include center line, median; box limits, upper and lower quartiles; whiskers are highest and lowest values no greater than 1.5× IQR. h Correlation of proliferation T cells abundance and CTL-1 abundance is shown as scatter plot. Pearson linear correlation estimate, and p-values are shown. The error band indicates 95% confidence interval. i Correlation of exhaustion signature score in CTL-1 and Treg activity score in Tregs is shown as scatter plot. Pearson linear correlation estimate, and p-values are shown. The error band indicates 95% confidence interval. j RNA velocity analysis of the transitions of CTL-1, CTL-2, and proliferating T cells. k Visualization of exhaustion score shown on T-cell UMAP embedding. l Expression trends of the top 200 genes whose expression correlates with velocity pseudotime in panel j. Source data are provided as a Source Data file.
Fig. 3
Fig. 3. Intratumoral heterogeneity reveals distinctive malignant cell subclones.
a Joint alignment of nephron anatomy cells from normal kidney tissue and tumor cells from primary ccRCC tissue in UMAP embedding, colored by cell annotation. b Expression distance of different cell subpopulations is shown as a dendrogram. c Violin plot showing representative marker gene expression of tumor cells. d Inferred CNV profile of tumor cells with normal nephron anatomy cells as normal reference. e Summary of tumor cell subclones, number of tumor cells (Top), clinic pathological features (middle), cell abundance of tumor subclones (bottom) in each sample. f Violin plot showing metastatic signature gene expression in patient tumor cells from primary ccRCC, local kidney metastasis and bone metastasis. g Overall survival (OS) analysis for TCGA KIRC (n = 533) and CheckMate (n = 250) bulk RNA-seq data. Patients were stratified into two groups based on the average expression (binary: top 25% versus bottom 25%) of metastatic signatures as annotated by key marker genes in panel f. Statistics are accessed by two-side log-rank test. Bootstrap resampling was performed on signature genes and p-value was calculated using the 95% reproducibility power p-value (see Methods). h Expression of APOL1 and SAA1 are shown as boxplot, stratifying patients by disease stage (TCGA KIRC) with a two-side Wilcoxon rank-sum test (APOL1: stage i–iii ***p = 0.00016; stage i–iv ****p = 1.9e-05. Sample size: stage i = 267; stage ii = 58, stage iii = 123; stage iv = 82). Boxplots: center line: median; box limits: upper and lower quartiles; whiskers extend at most 1.5× interquartile range past upper and lower quartiles. Source data are provided as a Source Data file.
Fig. 4
Fig. 4. ccRCC is driven by vascular remodeling through angiogenic and EMT switch in stromal cells.
a UMAP embedding of stromal cells, color-coded by the cell subtypes. b Changes in the composition of stromal cell is visualized as cell density on UMAP embedding. c Dot plots showing representative marker gene expression across different stromal subsets. The color represents scaled average expression of marker genes in each cell type, and the size indicates the proportion of cells expressing marker genes. d Boxplot plot illustrate EMT and angiogenesis signature score across different stromal cell subpopulations of normal kidney tissue and primary RCC. Statistics significances are accessed using a two-side Wilcoxon rank-sum test (Angiogenesis: endo-1 ****p = 1.9e-05; endo-2 **p = 0.0059; endo-3 ***p = 4.0e-04; endo-4 **p = 0.002; endo-5 ***p = 1.00e-04; peri-1 ***p = 0,00067; peri-2 **** p = 1.0E-06. EMT: endo-1 ****p = 1.0e-06; endo-2 ****p = 1.0e-06; endo-3 **p = 0.0016; endo-5 **p = 0.002; peri-1 ****p = 3.1e-05; peri-2 ****p = 4.1e-06. tumor n = 14 samples, normal adjacent kidney, n = 10 samples). e Boxplots showing the proportions of pericytes subsets divided by the total pericytes cell number. Peri-1 ****p = 1.9e-05; peri-2 ****p = 1.9e-05. f Boxplots showing the proportions of endothelial subsets divided by the total endothelial cell number. Statistics significances are accessed using a two-side Wilcoxon rank-sum test (Endo-1 ****p = 3.1e-05; endo-3 ****p = 2.0e-06; endo-4 ****p = 4.7e-05). Boxplots in df include center line, median; box limits, upper and lower quartiles; and whiskers are highest and lowest values no greater than 1.5× interquartile range. g The enriched GO BP terms of top 200 upregulated genes for each stromal cell subtype comparing to adjacent normal. The statistical analysis was performed by over-representation test. h Violin plots showing cancer-associated fibroblast (CAF) signature gene expression in tumor and adjacent normal fibroblast. i Similar with Fig. 3g, showing ccRCC samples with higher CAF signature gene expression have worse overall survival in TCGA KIRC (top, n = 533) and CheckMate (bottom, n = 250) data. Statistics are accessed by two-side log-rank test. Bootstrap resampling was performed on signature genes and p-value was calculated using the 95% reproducibility power p-value (see Methods). j INSR and CD36 expression in UMAP embedding separately for tumor and adjacent normal tissue. Source data are provided as a Source Data file.
Fig. 5
Fig. 5. Cell–cell interaction analysis reveals potential therapeutic targets in ccRCC.
a Overview of potential ligand-receptor interactions of cell subpopulations. b Bubble heatmap showing expression of ligand (tumor cells and stromal cell subsets) and receptor (immune cell subsets) pairs in different stromal and immune subsets. Dot size indicates expression ratio, color represents average gene expression. Significance of ligand-receptor pair is determined by permutation test, gene differential expression analysis and specific cellular expression (Methods). c The predicted interactions between CD70 and CD27. d Violin plot showing CD27 expression in CTL-1 and Tregs. e CD27 and CD70 expression in TCGA KIRC data are shown as boxplot. Statistics are accessed with a two-side Wilcoxon rank-sum test (CD27 ****p < 2e-16; CD70 ****p < 2e-16. Sample size: Tumor n = 533, Normal n = 53). Boxplots include center line, median; box limits, upper and lower quartiles; and whiskers are highest and lowest values no greater than 1.5× interquartile range. f Correlation of CD70–CD27 (tumor cells-CTL-1) average expression and CTL-1 exhaustion score is shown as scatter plot. Pearson linear correlation estimate, and p-values are shown. The error band indicates 95% confidence interval. g Flow cytometric analysis of CD27 expression on PDCD1 + CD8 + T cells from Tumor and paired adjacent normal tissue. (n = 4 per group). Statistics are accessed with paired two-side t-test (**p = 0.0031). h Spatial feature plots showing CA9, CD70, and CD27 expression in ccRCC patient. Tumor spots are marked by CA9 expression. i CXCL9 and CXCL10 expression in TCGA KIRC data are shown as boxplot. Statistics are accessed with a two-side Wilcoxon rank-sum test (CXCL9 ****p < 2e-16; CXCL10 **** p < 2e-16. Sample size: Tumor n = 533, Normal n = 53). Boxplots include center line, median; box limits, upper and lower quartiles; and whiskers are highest and lowest values no greater than 1.5× interquartile range. Source data are provided as a Source Data file.

References

    1. Moch H, Cubilla AL, Humphrey PA, Reuter VE, Ulbright TM. The 2016 WHO Classification of Tumours of the Urinary System and Male Genital Organs—Part A: Renal, penile, and testicular tumours. Eur. Urol. 2016;70:93–105. doi: 10.1016/j.eururo.2016.02.029. - DOI - PubMed
    1. Dudani S, et al. Evaluation of clear cell, papillary, and chromophobe renal cell carcinoma metastasis sites and association with survival. JAMA Netw. Open. 2021;4:e2021869. doi: 10.1001/jamanetworkopen.2020.21869. - DOI - PMC - PubMed
    1. Hsieh JJ, et al. Renal cell carcinoma. Nat. Rev. Dis. Prim. 2017;3:17009. doi: 10.1038/nrdp.2017.9. - DOI - PMC - PubMed
    1. Hanahan D, Coussens LM. Accessories to the crime: functions of cells recruited to the tumor microenvironment. Cancer Cell. 2012;21:309–322. doi: 10.1016/j.ccr.2012.02.022. - DOI - PubMed
    1. Prasetyanti PR, Medema JP. Intra-tumor heterogeneity from a cancer stem cell perspective. Mol. Cancer. 2017;16:41. doi: 10.1186/s12943-017-0600-4. - DOI - PMC - PubMed

Publication types