. 2022 Sep 30;5(1):1039.
doi: 10.1038/s42003-022-03986-6.

SARS-CoV-2 Nsp6 damages Drosophila heart and mouse cardiomyocytes through MGA/MAX complex-mediated increased glycolysis

Affiliations

SARS-CoV-2 Nsp6 damages Drosophila heart and mouse cardiomyocytes through MGA/MAX complex-mediated increased glycolysis

Jun-Yi Zhu et al. Commun Biol. .

Abstract

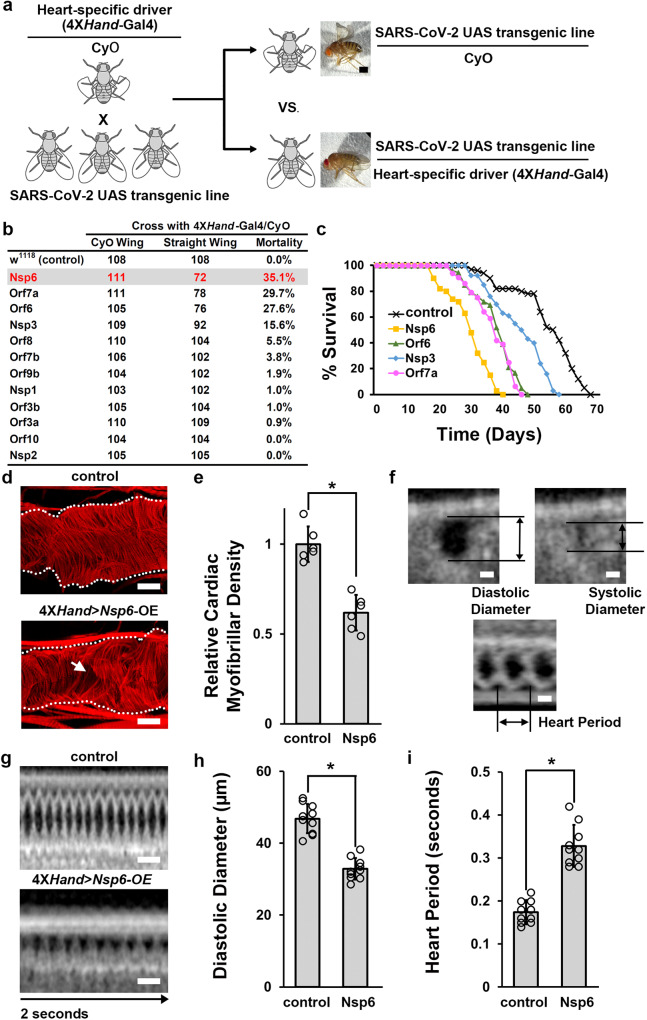
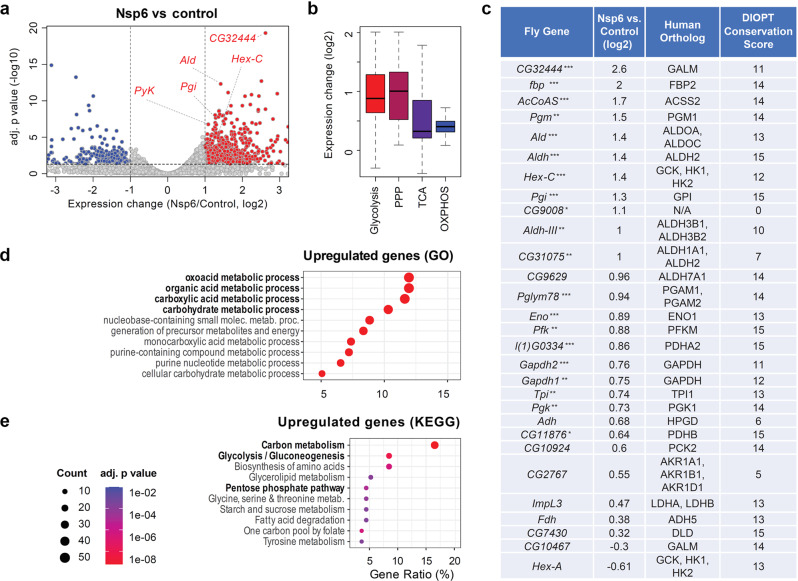
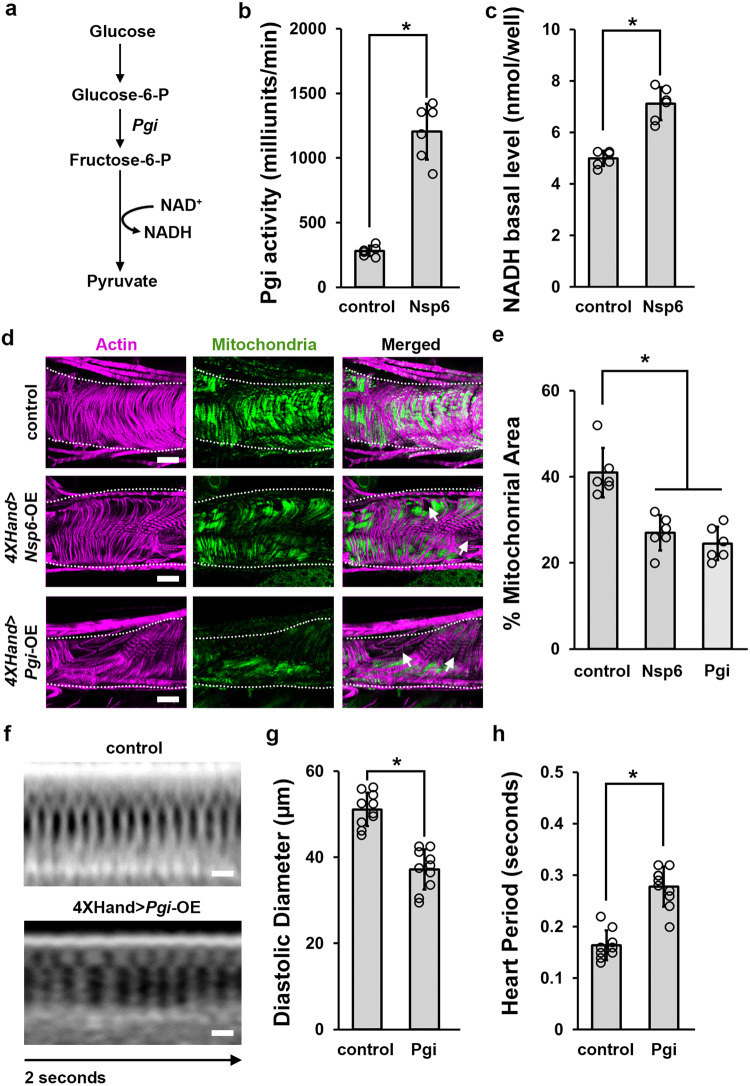
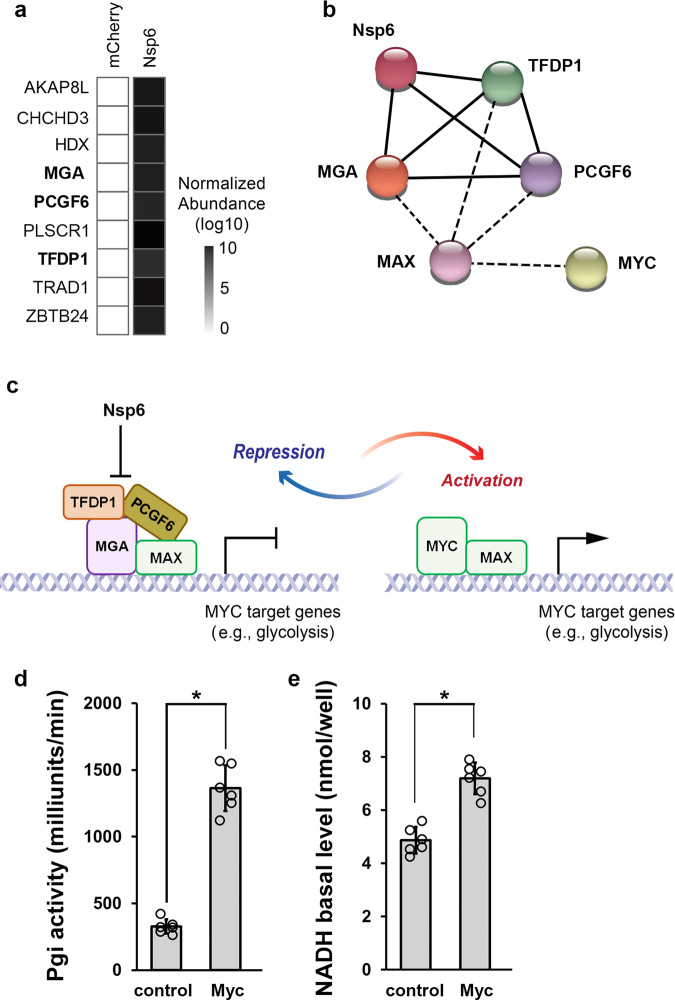
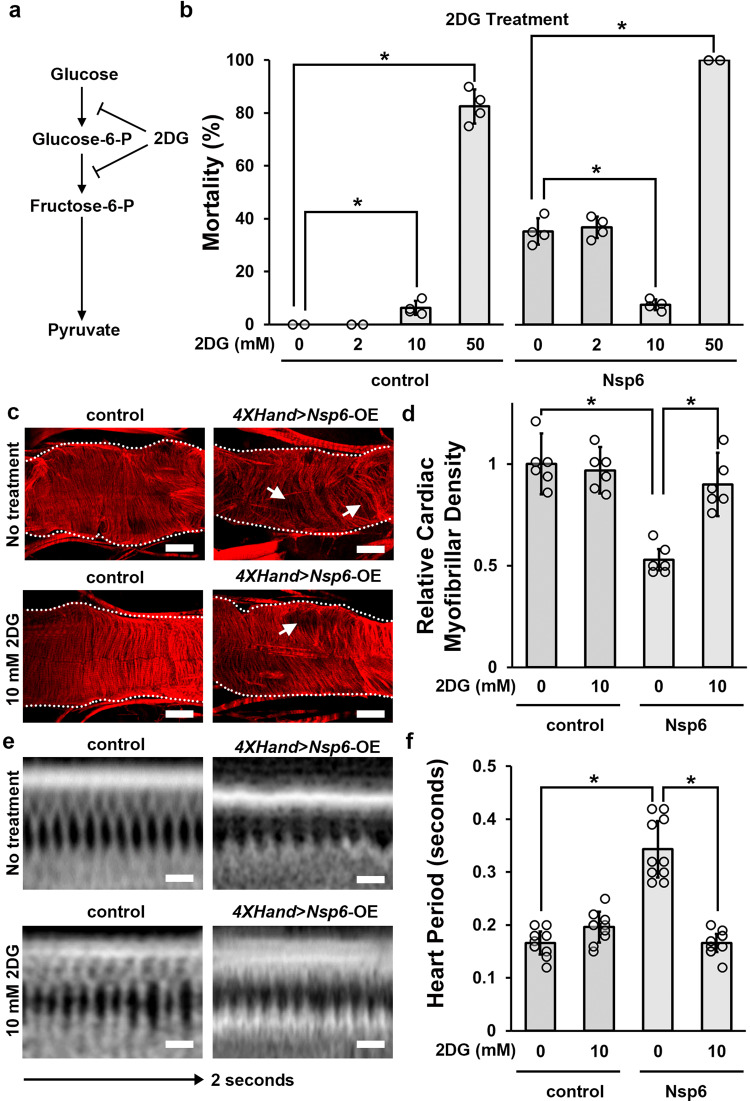
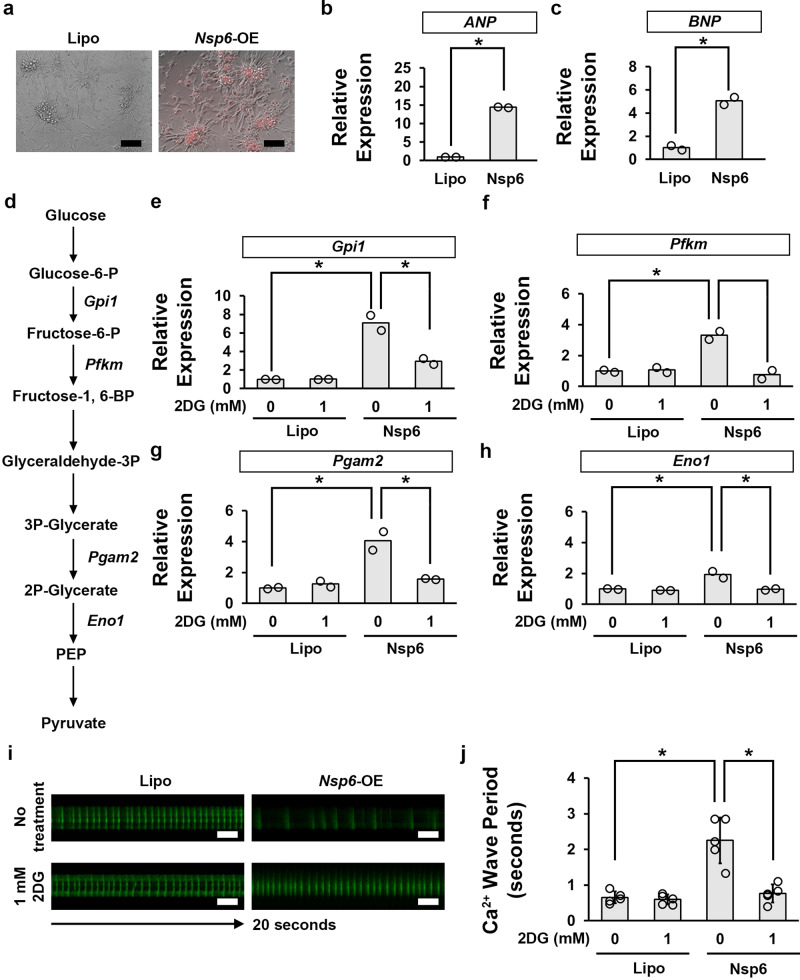
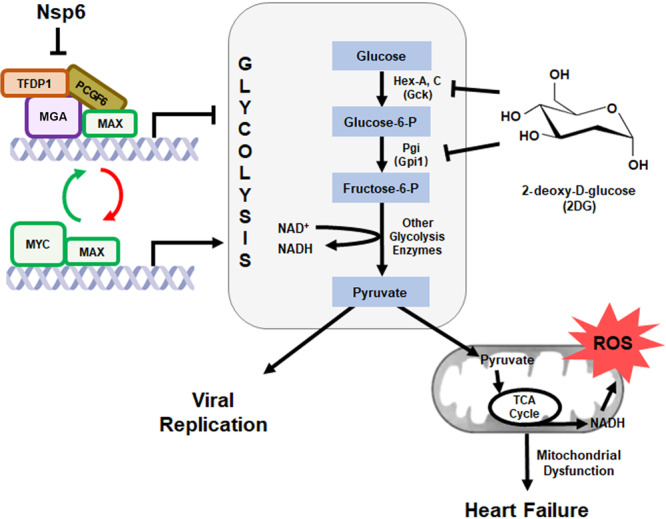
SARS-CoV-2 infection causes COVID-19, a severe acute respiratory disease associated with cardiovascular complications including long-term outcomes. The presence of virus in cardiac tissue of patients with COVID-19 suggests this is a direct, rather than secondary, effect of infection. Here, by expressing individual SARS-CoV-2 proteins in the Drosophila heart, we demonstrate interaction of virus Nsp6 with host proteins of the MGA/MAX complex (MGA, PCGF6 and TFDP1). Complementing transcriptomic data from the fly heart reveal that this interaction blocks the antagonistic MGA/MAX complex, which shifts the balance towards MYC/MAX and activates glycolysis-with similar findings in mouse cardiomyocytes. Further, the Nsp6-induced glycolysis disrupts cardiac mitochondrial function, known to increase reactive oxygen species (ROS) in heart failure; this could explain COVID-19-associated cardiac pathology. Inhibiting the glycolysis pathway by 2-deoxy-D-glucose (2DG) treatment attenuates the Nsp6-induced cardiac phenotype in flies and mice. These findings point to glycolysis as a potential pharmacological target for treating COVID-19-associated heart failure.


Conflict of interest statement

The authors declare no competing interests.

Figures

Fig. 1
Fig. 1. SARS-CoV-2 Nsp6, Orf6 or Orf7a transgene expression causes developmental lethality, heart morphological and functional defects.
a Schematic representation of the genetic screen to identify individual SARS-CoV-2 genes with cardiac pathology. Fly images taken using a ZEISS SteREO Discovery.V12 microscope. Scale bar = 0.5 mm. b Quantitation of mortality rate prior to eclosion for each individually expressed SARS-CoV-2 gene from the crosses in a. Mortality was calculated as (CyO wing − straight wing)/CyO wing × 100. n = ~200 flies (across 4 vials). c Graph displaying the lifespan for adult flies carrying SARS-CoV-2 Nsp6, Orf6, Orf7a or Nsp3 transgene expression. w1118 is a wild-type control. d The adult heart phenotype induced by 4XHand-Gal4, cardioblast-specific overexpression (OE) of the UAS-SARS-CoV-2 Nsp6 transgene. Cardiac actin myofibers were visualized by phalloidin staining. Dotted lines delineate the outline of the heart tube. Arrow points to missing cardiac myofibers. w1118 is a wild-type control. Scale bars (both) = 40 μm. e Quantitation of adult heart cardiac myofibrillar density relative to control. SARS-CoV-2 Nsp6 (4XHand-Gal4) flies, and w1118 is a wild-type control. P value = 5.3E−05. n = 6 flies per genotype. f Schematic representation of heart diastolic and systolic diameter, and the heart period by optical coherence tomography (OCT). Scale bars (top two panels) = 20 μm; (bottom) = 30 μm. g Drosophila heartbeat video images from flies induced by 4XHand-Gal4 cardioblast-specific overexpression (OE) of the UAS-SARS-CoV-2 Nsp6 transgene. w1118 is a wild-type control. Scale bars (both) = 25 μm. h Quantitation of adult heart diastolic diameter. n = 10 flies per genotype. P value = 8.3E−08. i Quantitation of heart period, i.e., indication of heart rate. n = 10 flies per genotype. P value = 4.0E−08. Statistical significance (*) defined as P < 0.05 (Student’s t test); data shown as mean ± SD.
Fig. 2
Fig. 2. SARS-CoV-2 Nsp6 alters the expression of host glycolysis genes in the fly heart.
a Differential expression of fly heart genes upon 4XHand-Gal4 cardioblast-specific transgenic overexpression (OE) of UAS-SARS-CoV-2 Nsp6. X-axis: Gene expression differences between the Nsp6-expressing heart versus wild-type control (w1118) in log2 scale. Y-axis: Adjusted P values in −log10 scale. Each dot represents a gene: Red color denotes genes upregulated in Nsp6-OE fly hearts; Blue color denotes genes downregulated in Nsp6-OE fly hearts. b Box plot summarizes differentially expressed genes in SARS-CoV-2 Nsp6-OE fly heart compared to wild-type control (w1118) heart, involved in Glycolysis, Pentose Phosphate Pathway (PPP), TriCarboxylic Acid cycle (TCA) and OXidative PHOSphorylation (OXPHOS). The top and bottom of each box corresponds to the upper and lower quartiles, respectively. Each thick line represents the median value. Whiskers indicate the largest, or smallest, observations within 1.5 times of the interquartile range (upper-lower) from the top/bottom of the boxes, respectively. c Gene expression changes of fly glycolysis genes with their human orthologs. Orthology information and conservation scores were obtained from DIOPT (max conservation score = 15). * adjusted P < 0.05, ** adjusted P < 0.01, *** adjusted P < 0.001. Enrichment of genes with specific Gene Ontology (GO) terms (d) or KEGG-defined pathways (e). Circle size: Number of genes associated with the function. Color: Adjusted P values. X-axis represents the percentage of genes with the function among all the significantly upregulated (adj. P value < 0.05) genes.
Fig. 3
Fig. 3. SARS-CoV-2 Nsp6 increases glycolysis activity and heart-specific Pgi overexpression causes heart morphological and functional defects.
a Key metabolites in the glycolysis pathway. b Quantitation of the enzymatic activity of Phosphoglucose isomerase (Pgi) in flies with ubiquitous (Tub-Gal4 driver) overexpression of UAS-SARS-CoV-2 Nsp6 transgene or wild-type control (w1118). P value = 1.3E−06. n = 6 flies per genotype. c Quantitation of the NADH level in flies with ubiquitous (Tub-Gal4 driver) overexpression of UAS-SARS-CoV-2 Nsp6 transgene or wild-type control (w1118). P value = 2.4E−05. n = 6 flies per genotype. d Adult heart mitochondrial phenotype induced by 4XHand-Gal4, cardioblast-specific overexpression (OE) of the UAS-SARS-CoV-2 Nsp6 or Pgi transgenes. Cardiac actin myofibers were visualized by phalloidin staining. Mitochondria were visualized by ATP5a antibody staining. Dotted lines delineate the outline of the heart tube. Arrow points to missing mitochondria. w1118 is a wild-type control. Scale bars (all) = 40 μm. e Quantitation of percentage of mitochondrial area in fly heart (see images in b). P value (control-Nsp6) = 0.01; P value (control-Pgi) = 0.001. n = 6 flies per genotype. f Drosophila heartbeat video images from flies induced by cardioblast-specific (4XHand-Gal4 driver) overexpression (OE) of UAS-Pgi transgene. w1118 is a wild-type control. Scale bars (both) = 25 μm. g Quantitation of adult heart diastolic diameter (in d). n = 10 flies per genotype. h Quantitation of heart period (in d). P value = 3.5E−07. n = 10 flies per genotype. Statistical significance (*) defined as P < 0.05 (Student’s t test in a, e, f; Kruskal–Wallis H-test followed by Dunn’s test in c); data shown as mean ± SD.
Fig. 4
Fig. 4. SARS-CoV-2 Nsp6 increases glycolysis gene expression by inhibiting an MGA-containing repressive complex.
a Heatmap summarizes the abundance of transcription factors (obtained from mass spectrometry analysis) in the mCherry (left) and SARS-CoV-2 Nsp6 (right) expressing HEK 293T cells. b Known protein-protein interactions among SARS-CoV-2 Nsp6-binding transcription factors, as well as MYC and MAX. Solid line: Interaction identified in this study. Dotted line: Other known interactions from the STRING database. c Schematic illustration depicting regulation of glycolysis gene expression by MGA or MYC-containing protein complexes. Quantitation of the enzymatic activity of Phosphoglucose isomerase (Pgi) (d; P value = 6.4E−08) and NADH (e; P value = 2.4E−05) levels in flies with ubiquitous (Tub-Gal4 driver) expression of the UAS-Myc transgene or wild-type control (w1118). n = 6 flies per genotype. Statistical significance (*) defined as P < 0.05 (Student’s t test); data shown as mean ± SD. MGA MAX gene-associated protein, MAX MYC-associated factor X, MYC MYC proto-oncogene, basic helix-loop-helix (BHLH) transcription factor, PCGF6 Polycomb group ring finger 6, TFDP1 Transcription factor Dp-1.
Fig. 5
Fig. 5. Inhibiting glycolysis activity by 2DG attenuates SARS-CoV-2 Nsp6-induced heart morphological and functional defects.
a Key metabolites in the glycolysis pathway, with the conversion steps inhibited by 2-deoxy-D-glucose (2DG) indicated. b Quantitation of mortality rate prior to eclosion induced by cardioblast-specific (4XHand-Gal4 driver) overexpression of the UAS-SARS-CoV-2 Nsp6 transgene, or wild-type (w1118) control, following different doses of 2DG. Mortality was calculated as (CyO wing − straight wing)/CyO wing × 100. P value (control 0–10 mM) = 0.05; (control 0–50 mM) = 0.002; (Nsp6 0–10 mM) = 0.05; (Nsp6 0–50 mM) = 0.0003. n = 4 repeats (~50 flies/vial). c Adult heart phenotype induced by cardioblast-specific (4XHand-Gal4 driver) overexpression (OE) of the UAS-SARS-CoV-2 Nsp6 transgene, compared to wild-type (w1118) control, following different doses of 2DG. Cardiac actin myofibers were visualized by phalloidin staining. Dotted lines delineate the outline of the heart tube. Arrow points to missing cardiac myofibers. Scale bars (all) = 40 μm. d Quantitation of adult heart cardiac myofibrillar density (in b) relative to control. P value (0 mM control-Nsp6) = 0.0006; (Nsp6 0–10 mM) = 0.03. n = 6 flies per genotype. e Drosophila heartbeat video images from flies carrying cardioblast-specific (4XHand-Gal4 driver) overexpression (OE) of the UAS-SARS-CoV-2 Nsp6 transgene, or wild-type (w1118) control flies, following different doses of 2DG. Scale bars (all) = 25 μm. f Quantitation of heart period (in d). P value (0 mM control-Nsp6) = 0.00001; (Nsp6 0–10 mM) = 0.00001. n = 10 flies per genotype. Statistical significance (*) defined as P < 0.05 (Kruskal–Wallis H-test followed by Dunn’s test); data shown as mean ± SD.
Fig. 6
Fig. 6. Inhibiting glycolysis activity by 2DG attenuates SARS-CoV-2 Nsp6-induced heart hypertrophy and functional defects in mouse primary cardiomyocytes.
a Mouse primary cardiomyocytes were transfected with the SARS-CoV-2 Nsp6 transgene. The SARS-CoV-2 Nsp6 transgene was visualized in red. Lipofectamine only treated mouse primary cardiomyocytes (Lipo) served as the control. Scale bars (both) = 100 µm. b Quantitation of hypertrophy marker ANP relative to control. P value = 3.7E−05. ANP, Atrial natriuretic peptide. n = 2 mice (cardiomyocytes) per condition. c Quantitation of hypertrophy marker BNP relative to control. P value = 0.008. BNP, type B natriuretic peptide. n = 2 mice (cardiomyocytes) per condition. d Key metabolites in the mammalian glycolysis pathway. eh Graphs Quantitation of the glycolysis gene expression levels in mouse primary cardiomyocytes transfected with the SARS-CoV-2 Nsp6 transgene, or lipofectamine (Lipo) control mouse primary cardiomyocytes. Gpi1 (e) P value (0 mM Lipo-Nsp6) = 0.03; (Nsp6 0–1 mM) = 0.04. Pfkm (f) P value (0 mM Lipo-Nsp6) = 0.01; (Nsp6 0–1 mM) = 0.02. Pgam2 (g) P value (0 mM Lipo-Nsp6) = 0.04; (Nsp6 0–1 mM) = 0.05. Eno1 (h) P value (0 mM Lipo-Nsp6) = 0.05; (Nsp6 0–1 mM) = 0.05. n = 2 mice (cardiomyocytes) per condition. i Mouse primary cardiomyocyte Ca2+ wave video images from cells transfected with the UAS-SARS-CoV-2 Nsp6 transgene, or lipofectamine (Lipo) control mouse primary cardiomyocytes. Scale bars (all) = 200 µm. j Quantitation of the Ca2+ wave rate (in d). P value (0 mM Lipo-Nsp6) = 0.006; (Nsp6 0–1 mM) = 0.03. n = 5 primary cells (cardiomyocytes) per condition. Statistical significance (*) defined as P < 0.05 (Student’s t test in b, c; Kruskal–Wallis H-test followed by Dunn’s test in eh, j); data shown as mean ± SD for n > 5.
Fig. 7
Fig. 7. Model of SARS-CoV-2 Nsp6-mediated disruption of glycolysis.
Graphic depiction of proposed model by which SARS-CoV-2 Nsp6 disrupts the MGA/MAX:MYC/MAX balance thereby increasing glycolysis pathway activity, which in turn leads to heart failure and potentially facilitates virus replication. The model also indicates where 2-deoxy-D-glucose (2DG) might intervene and inhibit the Nsp6-glycolysis-induced cardiac phenotype. MGA MAX gene-associated protein, MAX MYC-associated factor X, MYC MYC proto-oncogene, basic helix-loop-helix (BHLH) transcription factor, PCGF6 Polycomb group ring finger 6, ROS reactive oxygen species, TCA cycle tricarboxylic acid cycle (a.k.a. Krebs cycle), TFDP1 Transcription factor Dp-1, Hex-A/Hex-C Hexokinase-A/-C, Phosphoglucose isomerase (Pgi).

Similar articles

Cited by

References

    1. Escher F, et al. Detection of viral SARS-CoV-2 genomes and histopathological changes in endomyocardial biopsies. ESC Heart Fail. 2020;7:2440–2447. doi: 10.1002/ehf2.12805. - DOI - PMC - PubMed
    1. Lindner D, et al. Association of cardiac infection with SARS-CoV-2 in confirmed COVID-19 autopsy cases. JAMA Cardiol. 2020;5:1281–1285. doi: 10.1001/jamacardio.2020.3551. - DOI - PMC - PubMed
    1. Tavazzi G, et al. Myocardial localization of coronavirus in COVID-19 cardiogenic shock. Eur. J. Heart Fail. 2020;22:911–915. doi: 10.1002/ejhf.1828. - DOI - PMC - PubMed
    1. Dal Ferro M, et al. SARS-CoV-2, myocardial injury and inflammation: insights from a large clinical and autopsy study. Clin. Res. Cardiol. 2021;110:1822–1831. doi: 10.1007/s00392-021-01910-2. - DOI - PMC - PubMed
    1. D’Onofrio N, et al. Glycated ACE2 receptor in diabetes: open door for SARS-COV-2 entry in cardiomyocyte. Cardiovasc. Diabetol. 2021;20:99. doi: 10.1186/s12933-021-01286-7. - DOI - PMC - PubMed

MeSH terms

Substances