. 2022 Nov;27(11):4372-4384.
doi: 10.1038/s41380-022-01787-1. Epub 2022 Sep 30.

High-fat diet induces depression-like phenotype via astrocyte-mediated hyperactivation of ventral hippocampal glutamatergic afferents to the nucleus accumbens

Affiliations

High-fat diet induces depression-like phenotype via astrocyte-mediated hyperactivation of ventral hippocampal glutamatergic afferents to the nucleus accumbens

Sheng-Feng Tsai et al. Mol Psychiatry. 2022 Nov.

Abstract

Comorbidity exists between metabolic disorders and depressive syndrome with unclear mechanisms. To characterize the causal relationship, we adopted a 12-week high-fat diet (HFD) to induce metabolic disorder and depressive phenotypes in mice. Initially, we identified an enhanced glutamatergic input in the nucleus accumbens of HFD mice. Retrograde tracing and chemogenetic inhibition showed that the hyperactive ventral hippocampal glutamatergic afferents to the nucleus accumbens determined the exhibition of depression-like behavior in HFD mice. Using lentiviral knockdown and overexpression approaches, we proved that HFD-induced downregulation of glial glutamate transporters, GLAST and GLT-1, contributed to the observed circuit maladaptations and subsequent depression-like behaviors. Finally, we identified a potential therapeutic agent, riluzole, which could mitigate the HFD-induced behavioral deficits by normalizing the expressions of GLAST and GLT-1 and ventral hippocampal glutamatergic afferents to the nucleus accumbens. Overall, astrocyte-mediated disturbance in glutamatergic transmission underlies the metabolic disorder-related depressive syndrome and represents a therapeutic target for this subtype of depressive mood disorders.


Conflict of interest statement

The authors declare no competing interests.

Figures
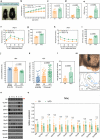
Fig. 1
Fig. 1. HFD induces MetD and depression-like behavior and enhances NAc glutamatergic inputs in mice.
Effects of a 12-week HFD on parameters of interests. a Representative photograph of physical appearances of mice after the feedings. b Body weight of mice during the feedings. n = 40 mice per group. ce Measurements of e fasting blood glucose levels, d fasting plasma insulin levels, and e HOMA-IR index in mice. n = 9 mice per group. Results of IPGTT. f Blood glucose levels during IPGTT in mice. g Analysis of area under the curve (AUC) of IPGTT results. n = 8 mice per group. Results of IPITT. h Blood glucose levels during IPITT in mice. i analysis of AUC of IPITT results. n = 8 mice per group. j Results of sucrose preference in SPT. n = 10 cages of mice in 8-wk-old group; n = 16 cages of mice in 20-wk-old CD and HFD groups. k Results of exhibition of immobility in FST. n = 20 mice in 8-wk-old group; n = 40 mice in 20-wk-old CD and HFD groups. Measurement of extracellular glutamate concentrations in the NAc of mice. l Quantitative results. n = 5 mice per group. m Locations of biosensor tips in real-time measurement of extracellular level of glutamate. Blue dash line indicates the inserting track in the upper panel. a: anterior commissure; CPu: caudate putamen; HDB: horizontal diagonal band of Broca; LNAcSh: NAc lateral shell. Measurements of expression of glutamatergic transmission-related molecules in the NAc of mice. n Representative micrographs of Western blots. The red arrow indicates the accurate molecular weight of GS. o Quantitative results. n = 5 samples per group. Each sample contained NAc protein lysates from 2 mice in equal amount of proteins. All data are expressed as mean ± SD. n.s., not significant. See also Supplementary Tables S1 and S2 for details of animal usage and statistical test results.
Fig. 2
Fig. 2. HFD induces hyperactivation of the vHPC→NAc projecting neurons, which contributes to the development of HFD-induced depressive phenotype in mice.
a Experimental timeline and schematic of intra-NAc infusion of retrograde tracer, FG. b Representative images of immunohistochemistry of FG in the mPFC, BLA, and vHPC of mice that received intra-NAc infusion of FG. Red boxes indicate the sampled areas for cell counting in this study. Stereotaxic coordinates of each brain region are given beneath each region. Scale bar, 1 mm. Effects of a 12-week HFD on c-Fos expression in the FG-labeled NAc-projecting neurons in the mPFC, BLA, and vHPC of mice. c Representative fluorescence images of c-Fos-immunoreactive (green) and FG-labeled (blue) cells. Scale bar, 100 µm. d Number of FG-labeled cells. e Percentage of FG-labeled cells also expressing c-Fos. n = 10 mice per group. f Experimental timeline and schematic of chemogenetic inhibition of the vHPC→NAc glutamatergic neurons in mice. Effects of chemogenetic inhibition of the vHPC→NAc neurons on exhibition of depression-like behaviors in mice. g Representative fluorescence images of c-Fos-immunoreactive cells (green) and retrogradely labeled mCherry-expressing NAc-projecting neurons in the vHPC (red). Scale bar, 100 µm. h Number of mCherry-labeled NAc-projecting neurons in the vHPC. i Percentage of mCherry-labeled neurons also expressing c-Fos. j Results of FST. k Body weight of mice before FST. n = 17 mice in CD-Saline group; n = 17 mice in CD-CNO group; n = 20 mice in HFD-Saline group; n = 19 in HFD-CNO group. All data are expressed as mean ± SD. n.s. not significant. See also Supplementary Tables S1 and S2 for details of animal usage and statistical test results.
Fig. 3
Fig. 3. HFD downregulates glutamate transporters, GLAST and GLT-1, in the vHPC of mice and knockdown of the vHPC GLAST and GLT-1 reproduces HFD-related circuit and behavioral impairments in naïve mice.
Effects of a 12-week HFD on parameters of interests. a and b Measurements of expression of glutamatergic transmission-related molecules in the vHPC of mice. a Representative micrographs of Western blots. b Quantitative results. n = 10 mice per group. Measurements of expression of GABAergic transmission-related molecules in the vHPC of mice. c Representative micrographs of Western blots. d Quantitative results. n = 10 mice per group. Measurement of extracellular glutamate concentrations in the vHPC of mice. e Quantitative results. n = 10 mice per group. f Locations of biosensor tips in real-time measurement of extracellular level of glutamate. Blue dash line indicates the inserting track in the upper panel. S: subiculum; CA1: cornu ammonis 1; SNR: substantia nigra pars reticulata. g Experimental timelines of studies determining effects of lentiviral knockdown of vHPC GLAST and GLT-1 on activity of vHPC→NAc glutamatergic transmission and depression-like behaviors in naïve mice. h Efficacy of lentiviral knockdown of vHPC GLAST and GLT-1. Left panels show representative micrographs of Western blots. Right panel shows quantitative results. n = 8 mice in shLacZ group; n = 11 mice in shGLAST+shGLT-1 group. i Results of SPT. n = 4 cages of mice in shLacZ group; n = 5 cages of mice in shGLAST+shGLT-1 group. j Results of FST. n = 8 mice in shLacZ group; n = 11 mice in shGLAST+shGLT-1 group. Measurements of c-Fos expression in the FG-labeled vHPC→NAc glutamatergic neurons in naïve mice. k Representative fluorescence images of c-Fos-immunoreactive cells (green) and FG-labeled NAc-projecting cells (blue) in the vHPC. Scale bar, 100 µm. l Number of FG-labeled cells. m Percentage of FG-labeled cells also expressing c-Fos. n = 6 mice per group. All data are expressed as mean ± SD. n.s. not significant. See also Supplementary Tables S1 and S2 for details of animal usage and statistical test results.
Fig. 4
Fig. 4. Restoring the vHPC GLAST and GLT-1 reverses HFD-induced hyperactivation in the vHPC→NAc glutamatergic transmission and depression-like behavior.
a Experimental timelines of studies determining effects of lentiviral overexpression of vHPC GLAST and GLT-1 on activity of vHPC→NAc glutamatergic transmission and depression-like behaviors in CD and HFD mice. b Efficacy of lentiviral overexpression of vHPC GLAST and GLT-1. Left panels show representative micrographs of Western blots. Right panels shows quantitative results. n = 10 mice in CD-GFP group; n = 9 mice in CD-OE group (OE: overexpression); n = 10 mice in HFD-GFP group; n = 10 mice in HFD-OE group. c Results of SPT. n = 9 cages of mice in CD-GFP group; n = 10 cages of mice in CD-OE group; n = 9 cages of mice in HFD-GFP group; n = 10 cages of mice in HFD-OE group. d Results of FST. n = 19 mice in CD-GFP group; n = 20 mice in CD-OE group; n = 18 mice in HFD-GFP group; n = 20 mice in HFD-OE group. Measurements of c-Fos expression in the FG-labeled NAc-projecting neurons in the vHPC of mice. e Representative fluorescence images of c-Fos-immunoreactive cells (green) and FG-labeled NAc-projecting cells (blue) in the vHPC. Scale bar, 100 µm. f Number of FG-labeled cells. g Percentage of FG-labeled cells also expressing c-Fos. n = 10 mice in CD-GFP group; n = 12 mice in CD-OE group; n = 9 mice in HFD-GFP group; n = 10 mice in HFD-OE group. h Body weight of mice during the experimental period. n = 19 mice in CD-GFP group; n = 20 mice in CD-OE group; n = 18 mice in HFD-GFP group; n = 20 mice in HFD-OE group. Measurements of i fasting blood glucose levels, j fasting plasma insulin levels, and k HOMA-IR index in mice. n = 9 mice in CD-GFP group; n = 11 mice in CD-OE group; n = 8 mice in HFD-GFP group; n = 10 mice in HFD-OE group. Results of IPGTT. l Blood glucose levels during IPGTT in mice. m Analysis of AUC of IPGTT results. n = 9 mice in CD-GFP group; n = 11 mice in CD-OE group; n = 8 mice in HFD-GFP group; n = 10 mice in HFD-OE group. Results of IPITT. n Blood glucose levels during IPITT in mice. o Analysis of AUC of IPITT results. n = 9 mice in CD-GFP group; n = 11 mice in CD-OE group; n = 8 mice in HFD-GFP group; n = 10 mice in HFD-OE group. All data are expressed as mean ± SD. n.s., not significant. See also Supplementary Tables S1 and S2 for details of animal usage and statistical test results.
Fig. 5
Fig. 5. Riluzole corrects HFD-induced hyperactivation of glutamatergic transmissions and depression-like behaviors.
a Experimental timelines of studies determining effects of a 3-week systemic (intraperitoneal injection) riluzole (RLZ) treatment on expressions of GLAST and GLT-1 in the vHPC, activity of vHPC→NAc glutamatergic transmission, and depression-like behaviors in CD and HFD mice. b Measurements of expressions of GLAST and GLT-1 in the vHPC of mice. Left panels show the representative micrographs of Western blots. Right panel shows quantitative results. n = 9 mice per group. c Results of SPT. n = 8 cages of mice in CD-Veh group (Veh: vehicle control); n = 8 cages of mice in CD-RLZ group; n = 9 cages of mice in HFD-Veh group; n = 10 cages of mice in HFD-RLZ group. d Results of FST. n = 20 mice in CD-Veh group; n = 19 mice in CD-RLZ group; n = 20 mice in HFD-Veh group; n = 22 mice in HFD-RLZ group. Measurements of c-Fos expression in the FG-labeled vHPC→NAc glutamatergic neurons in mice. e Representative fluorescence images of c-Fos-immunoreactive cells (green) and FG-labeled NAc-projecting cells (blue) in the vHPC. Scale bar, 100 µm. f Number of FG-labeled cells. g Percentage of FG-labeled cells also expressing c-Fos. n = 7 mice in CD-Veh group; n = 7 mice in CD-RLZ group; n = 8 mice in HFD-Veh group; n = 8 mice in HFD-RLZ group. h Experimental timelines of studies determining effects of a 7-day central (intra-vHPC infusion) RLZ treatment on expressions of GLAST and GLT-1 in the vHPC, activity of vHPC→NAc glutamatergic transmission, and depression-like behaviors in CD and HFD mice. i Measurements of expressions of GLAST and GLT-1 in the vHPC of mice. Left panels show the representative micrographs of Western blots. Right panel shows quantitative results. n = 10 mice per group. j Results of SPT. n = 10 cages per group. k Results of FST. n = 20 mice per group. Measurements of c-Fos expression in the FG-labeled vHPC→NAc glutamatergic neurons in mice. l Representative fluorescence images of c-Fos-immunoreactive cells (green) and FG-labeled NAc-projecting cells (blue) in the vHPC. Scale bar, 100 µm. m Number of FG-labeled cells. n Percentage of FG-labeled cells also expressing c-Fos. n = 8 mice in CD-Veh group; n = 9 mice in CD-RLZ group; n = 9 mice in HFD-Veh group; n = 10 mice in HFD-RLZ group. All data are expressed as mean ± SD. n.s., not significant. See also Supplementary Tables S1 and S2 for details of animal usage and statistical test results.

Similar articles

Cited by

References

    1. Gold SM, Kohler-Forsberg O, Moss-Morris R, Mehnert A, Miranda JJ, Bullinger M, et al. Comorbid depression in medical diseases. Nat Rev Dis Prim. 2020;6:69. - PubMed
    1. Golden SH, Lazo M, Carnethon M, Bertoni AG, Schreiner PJ, Diez Roux AV, et al. Examining a bidirectional association between depressive symptoms and diabetes. JAMA. 2008;299:2751–9. - PMC - PubMed
    1. Demakakos P, Zaninotto P, Nouwen A. Is the association between depressive symptoms and glucose metabolism bidirectional? Evidence from the English Longitudinal Study of Ageing. Psychosom Med. 2014;76:555–61. - PMC - PubMed
    1. McIntyre RS, Rasgon NL, Kemp DE, Nguyen HT, Law CW, Taylor VH, et al. Metabolic syndrome and major depressive disorder: co-occurrence and pathophysiologic overlap. Curr Diab Rep. 2009;9:51–9. - PubMed
    1. Faith MS, Matz PE, Jorge MA. Obesity-depression associations in the population. J Psychosom Res. 2002;53:935–42. - PubMed