. 2022 Nov;19(11):1263-1278.
doi: 10.1038/s41423-022-00925-7. Epub 2022 Sep 30.

Serine metabolism orchestrates macrophage polarization by regulating the IGF1-p38 axis

Affiliations

Serine metabolism orchestrates macrophage polarization by regulating the IGF1-p38 axis

Xiao Shan et al. Cell Mol Immunol. 2022 Nov.

Abstract

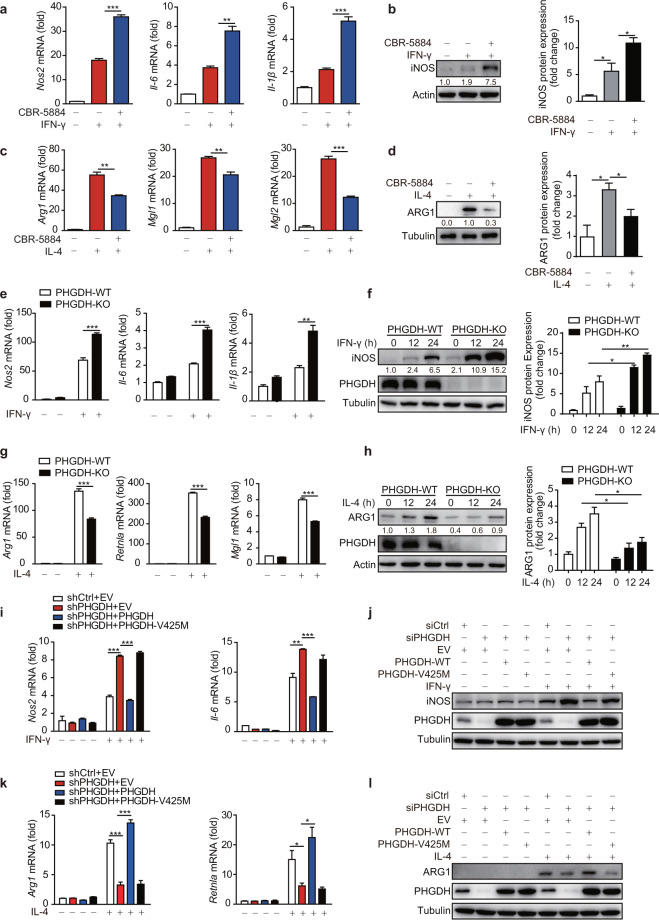
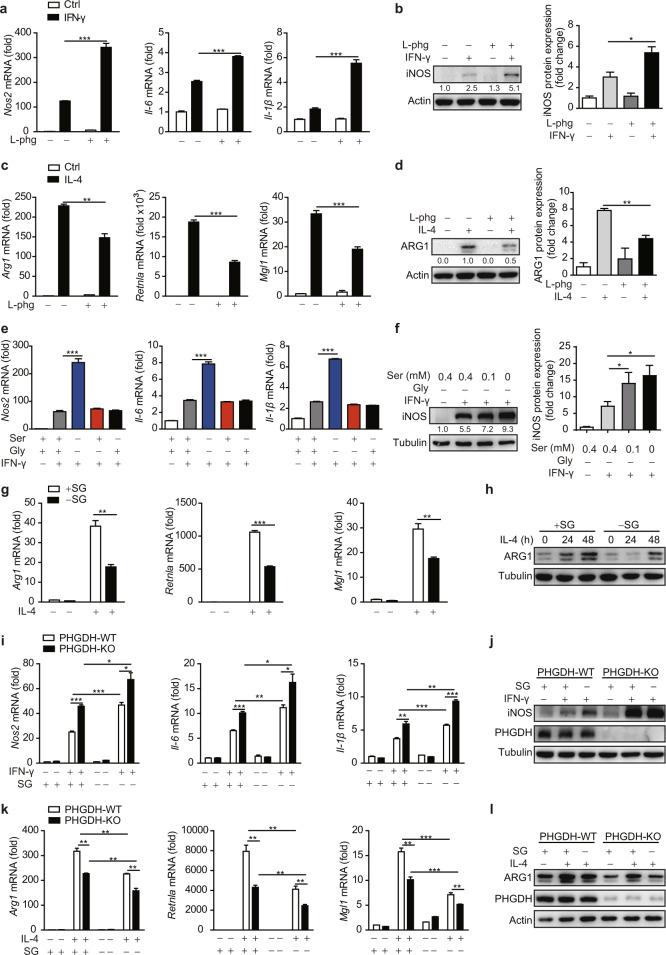
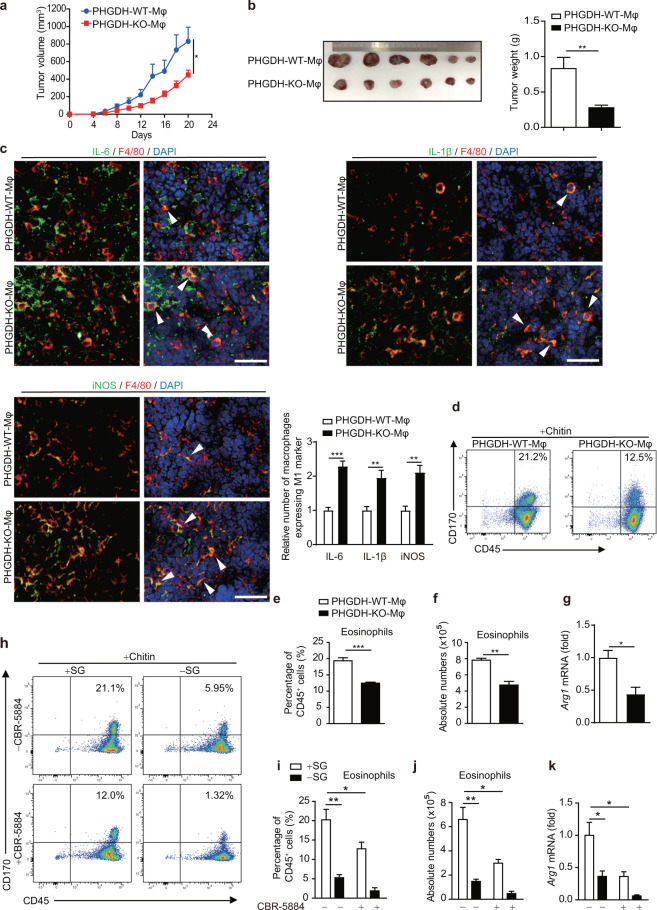
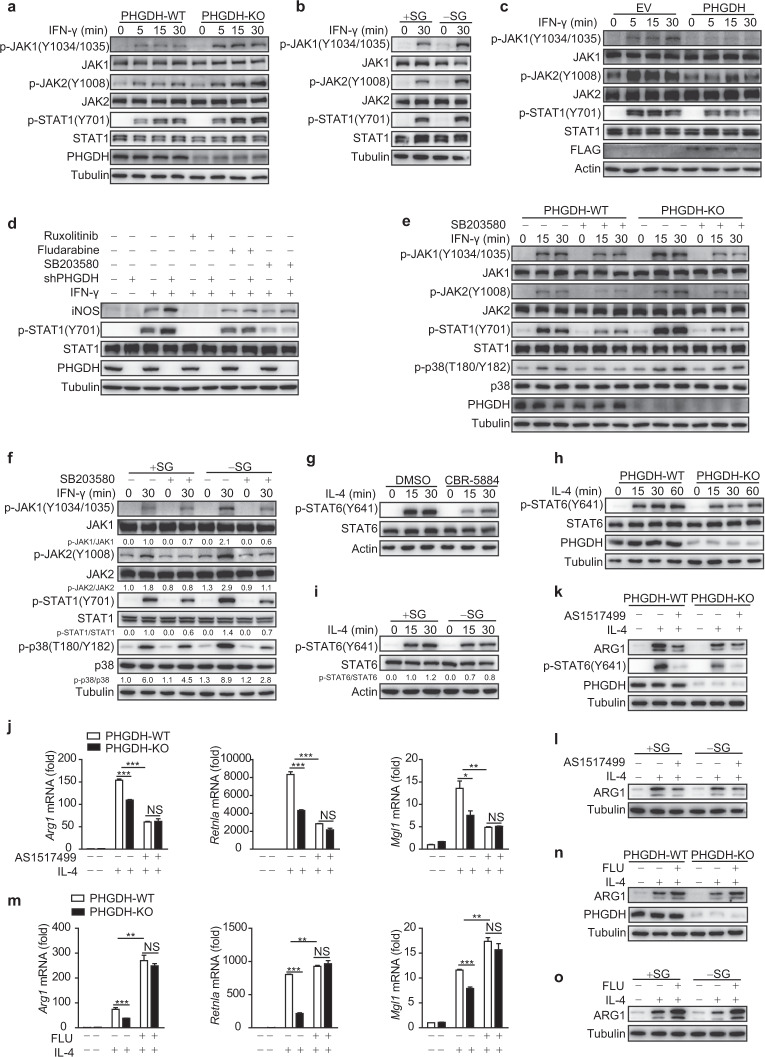
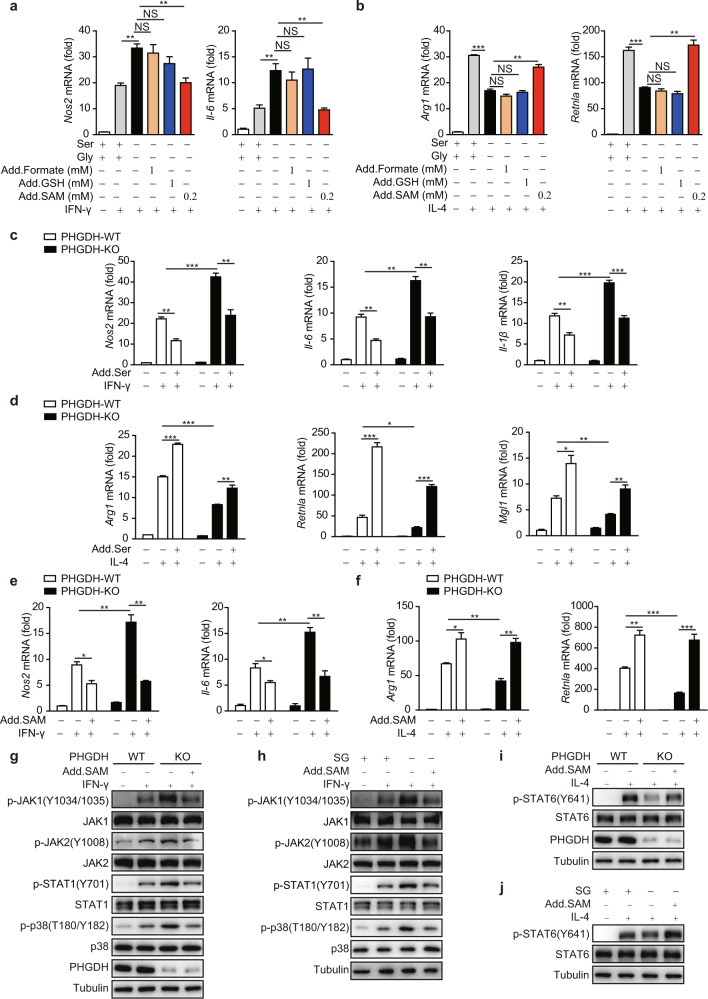
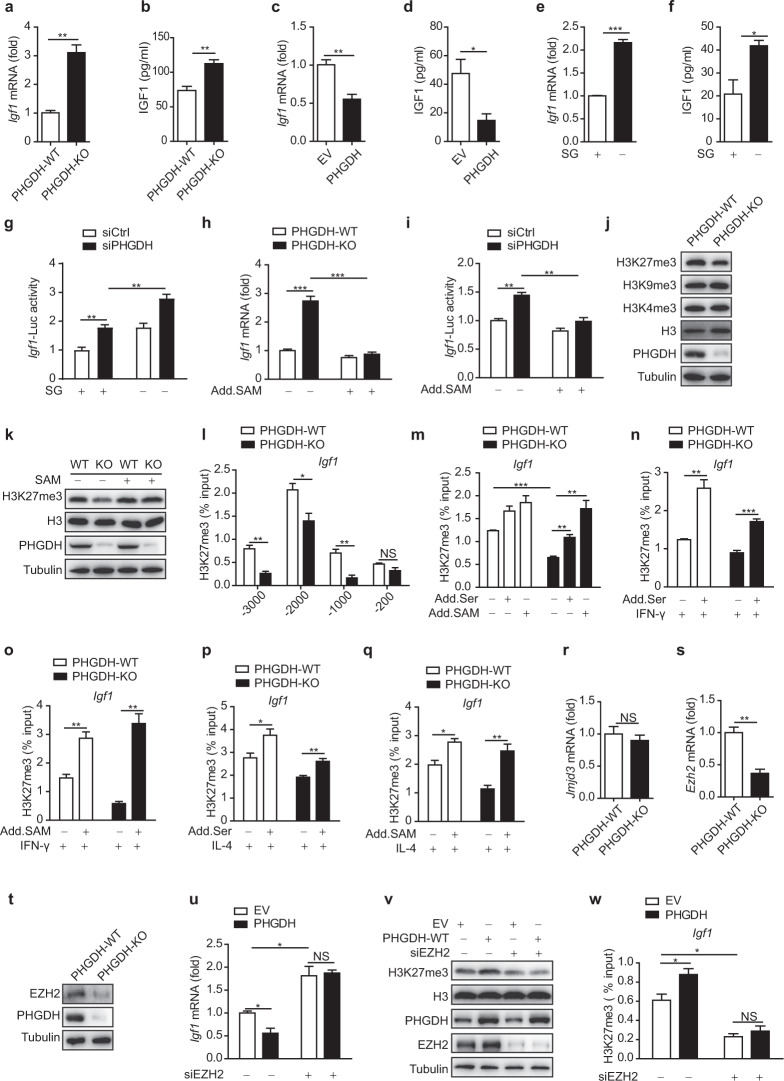
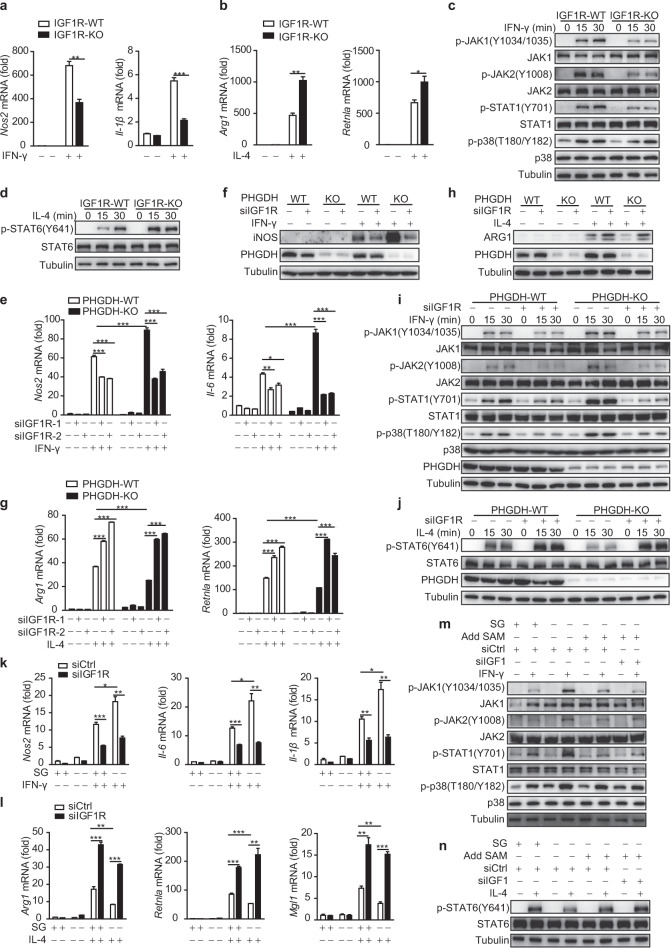
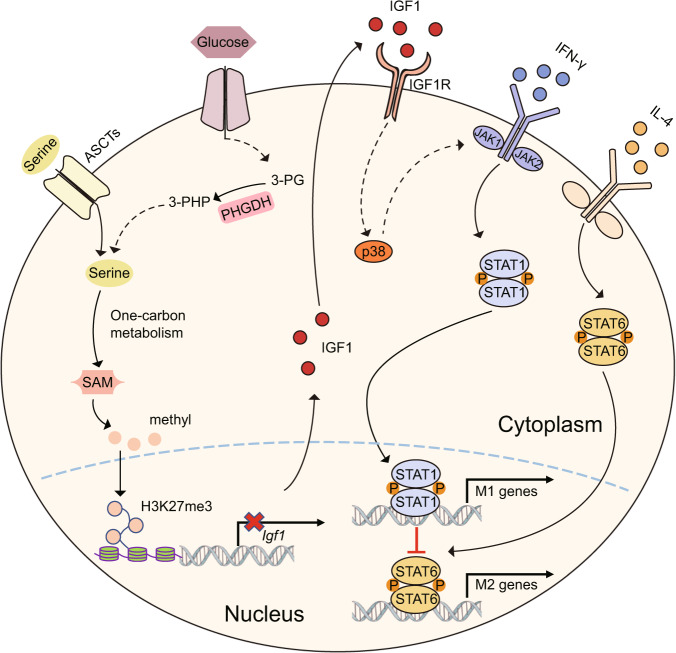
Serine metabolism is reportedly involved in immune cell functions, but whether and how serine metabolism regulates macrophage polarization remain largely unknown. Here, we show that suppressing serine metabolism, either by inhibiting the activity of the key enzyme phosphoglycerate dehydrogenase in the serine biosynthesis pathway or by exogenous serine and glycine restriction, robustly enhances the polarization of interferon-γ-activated macrophages (M(IFN-γ)) but suppresses that of interleukin-4-activated macrophages (M(IL-4)) both in vitro and in vivo. Mechanistically, serine metabolism deficiency increases the expression of IGF1 by reducing the promoter abundance of S-adenosyl methionine-dependent histone H3 lysine 27 trimethylation. IGF1 then activates the p38-dependent JAK-STAT1 axis to promote M(IFN-γ) polarization and suppress STAT6-mediated M(IL-4) activation. This study reveals a new mechanism by which serine metabolism orchestrates macrophage polarization and suggests the manipulation of serine metabolism as a therapeutic strategy for macrophage-mediated immune diseases.

Keywords: IGF1; Macrophage polarization; PHGDH; SAM; Serine metabolism; p38.


Conflict of interest statement

The authors declare no competing interests.

Figures

Fig. 1
Fig. 1
PHGDH inhibits M(IFN-γ) but promotes M(IL-4) polarization through its enzymatic activity. Wild-type bone marrow-derived macrophages (BMDMs) were pretreated with the PHGDH inhibitor CBR-5884 (15 μM) for 12 h and were then stimulated with IFN-γ (100 ng/ml) for 12 h (a, b) or with IL-4 (20 ng/ml) for 24 h (c, d), followed by qRT‒PCR or western blot analysis of M1 (a, b) and M2 (c, d) marker expression. Phgdhfl/flLyz2-Cre- (PHGDH-WT) and Phgdhfl/flLyz2-Cre+ (PHGDH-KO) mouse BMDMs were stimulated with IFN-γ for 12 h or the indicated times, followed by qRT‒PCR (e) or western blot (f) analysis of M1 marker expression. PHGDH-WT and PHGDH-KO BMDMs were stimulated with IL-4 for 24 h or the indicated times, followed by qRT‒PCR (g) or western blot (h) analysis of M2 marker expression. RAW264.7 cells with siRNA-mediated PHGDH silencing or stable shRNA-mediated PHGDH knockdown were transfected with an RNA interference (RNAi)-resistant PHGDH ectopic expression plasmid or a plasmid expressing a catalytically dead PHGDH mutant (V425M) and were then either stimulated with IFN-γ for 12 h to evaluate M1 marker expression by qRT‒PCR (i) or western blot analysis (j) or stimulated with IL-4 for 24 h to detect M2 marker expression by qRT‒PCR (k) or western blot analysis (l). siCtrl siControl, shCtrl shControl, EV empty vector. The data are from three independent experiments with biological duplicates in each and are shown as the mean ± SEM values (n = 3) (a, c, e, g, i, k) or are representative of three independent experiments (b, d, f, h, j, l). *p < 0.05, **p < 0.01, ***p < 0.001
Fig. 2
Fig. 2
Serine metabolism modulates macrophage polarization in vitro. Wild-type BMDMs were pretreated with the ASCT-specific inhibitor L-phenylglycine (50 μM) for 12 h and were then stimulated with IFN-γ (100 ng/ml) for 12 h (a, b) or with IL-4 (20 ng/ml) for 24 h (c, d), followed by qRT‒PCR or western blot analysis of M1 (a, b) and M2 (c, d) marker expression. e WT BMDMs were starved of serine and/or glycine for 12 h and were then stimulated with IFN-γ for 12 h, followed by qPCR analysis of M1 marker expression. f WT BMDMs were cultured with the indicated concentration of serine in the absence of glycine for 12 h and were then stimulated with IFN-γ for 12 h, followed by western blot analysis of iNOS. BMDMs were starved of serine and glycine (SG) and were then stimulated with IL-4 for 24 h or the indicated times, followed by qPCR (g) or western blot (h) analysis of M2 marker expression. PHGDH-WT and PHGDH-KO BMDMs were starved of SG for 12 h and were then stimulated with IFN-γ for 12 h (i, j) or IL-4 for 24 h (k, l), followed by qPCR or western blot analysis of M1 (i, j) or M2 (k, l) marker expression. The data are from three independent experiments with biological duplicates in each and are shown as the mean ± SEM values (n = 3) (a, c, e, g, i, k) or are representative of three independent experiments (b, d, f, h, j, l). *p < 0.05, **p < 0.01, ***p < 0.001
Fig. 3
Fig. 3
Serine metabolism regulates macrophage polarization in vivo. ac PHGDH-WT and PHGDH-KO mice were subcutaneously injected with 2 × 106 LLC cells per mouse (n = 6). Tumor volume was calculated every 2 days beginning 4 days after cell inoculation (a). Tumor xenografts and tumor weights on the 21st day are shown (b). Immunofluorescence staining was performed with the indicated antibodies on tumor sections from PHGDH-WT and PHGDH-KO mice. Representative images are shown (c). Scale bars, 100 μm. Semiquantitative histological analysis was performed (10 fields of 5 biological replicates for each group). dg Eosinophil populations in the peritoneal cavities of PHGDH-WT and PHGDH-KO mice (n = 4) were analyzed by flow cytometry 2 days post-chitin administration. The percentages of eosinophils among CD45+ cells (d, e) and the total numbers of eosinophils (f) are shown. The expression of Arg1 mRNA in isolated peritoneal macrophages was measured by qPCR (g). hk Eosinophil populations in the peritoneal cavities of wild-type mice treated with or without CBR-5884 and/or SG starvation (n = 4) were analyzed as described above. Shown are the percentages of eosinophils among CD45+ cells (h, i) and the total numbers of eosinophils (j). The expression of Arg1 mRNA in isolated peritoneal macrophages was measured by qPCR (k). The data are shown as the mean ± SEM values (n = 6 in a and the right panel of b; n = 10 in the right panel of c; n = 4 in eg and ik) or are representative of four mice (d, h). *p < 0.05, **p < 0.01, ***p < 0.001
Fig. 4
Fig. 4
Serine metabolism modulates macrophage polarization through the p38–JAK–STAT1 signaling axis. ai Western blot analyses were performed with the indicated antibodies. PHGDH-WT and PHGDH-KO BMDMs were treated with IFN-γ for the indicated times (a). WT BMDMs were starved of SG for 12 h and were then treated with IFN-γ for 30 min (b). RAW264.7 cells were transfected with the PHGDH ectopic expression plasmid and were then stimulated with IFN-γ for the indicated times (c). RAW264.7 cells were transfected with siControl or siPHGDH, treated with JAK (ruxolitinib), STAT1 (fludarabine), or p38 (SB203580) inhibitors for 6 h, and were then stimulated with IFN-γ for 12 h (d). PHGDH-WT and PHGDH-KO BMDMs were pretreated with the p38 inhibitor SB203580 for 6 h and were then stimulated with IFN-γ for the indicated times (e). WT BMDMs were starved of SG for 12 h, treated with the p38 inhibitor SB203580 for 6 h, and then stimulated with IFN-γ for 30 min (f). WT BMDMs were pretreated with the PHGDH inhibitor CBR-5884 for 6 h and were then stimulated with IL-4 for the indicated times (g). PHGDH-WT and PHGDH-KO BMDMs were stimulated with IL-4 for the indicated times (h). WT BMDMs were starved of SG for 12 h and were then stimulated with IL-4 for the indicated times (i). PHGDH-WT and PHGDH-KO BMDMs were pretreated with the STAT6 inhibitor AS1517499 for 6 h and were then stimulated with IL-4 for 24 h, followed by analysis of M2 markers by qRT‒PCR (j) or western blotting (k). l WT BMDMs were starved of SG for 12 h, treated with AS1517499 for 6 h, and then stimulated with IL-4 for 24 h, followed by analysis of ARG1 by western blotting. PHGDH-WT and PHGDH-KO BMDMs were pretreated with the STAT1 inhibitor fludarabine for 6 h and were then stimulated with IL-4 for 24 h, followed by analysis of M2 markers by qRT‒PCR (m) or western blotting (n). o WT BMDMs were starved of SG for 12 h, treated with fludarabine for 6 h, and then stimulated with IL-4 for 24 h, followed by analysis of ARG1 by western blotting. The data are from three independent experiments with biological duplicates in each and are shown as the mean ± SEM values (n = 3) (j, m) or are representative of three independent experiments (ai and k, l, n, o); NS not significant (p ≥ 0.05); *p < 0.05; **p < 0.01, ***p < 0.001
Fig. 5
Fig. 5
SAM derived from serine metabolism modulates macrophage polarization. qPCR analysis of M1 (a) or M2 markers (b) in WT BMDMs starved of SG for 12 h; supplemented with the indicated concentration of formate, GSH, or SAM; and then treated with IFN-γ for 12 h (a) or IL-4 for 24 h (b). qPCR analysis of M1 and M2 markers in PHGDH-WT and PHGDH-KO BMDMs supplemented with or without 400 μM serine (c, d) or 400 μM SAM (e, f) for 12 h and then treated with IFN-γ for 12 h or IL-4 for 24 h. gj Western blot analysis with the indicated antibodies. PHGDH-WT and PHGDH-KO BMDMs supplemented with or without 400 μM SAM for 12 h were treated with IFN-γ for 12 h (g) or IL-4 for 24 h (i). WT BMDMs starved of SG for 12 h and supplemented with 400 μM SAM were treated with IFN-γ for 12 h (h) or IL-4 for 24 h (j). The data are from three independent experiments with biological duplicates in each and are shown as the mean ± SEM values (n = 3) (af) or are representative of three independent experiments (gj). NS not significant (p ≥ 0.05); *p < 0.05; **p < 0.01; ***p < 0.001
Fig. 6
Fig. 6
Serine metabolism reduces IGF1 expression by increasing the promoter abundance of SAM-dependent H3K27me3. qPCR analysis of Igf1 mRNA expression (a) and ELISA (b) of IGF1 in the supernatants of PHGDH-WT and PHGDH-KO BMDMs. qPCR analysis of Igf1 mRNA expression (c) and ELISA (d) of IGF1 in the supernatants of RAW264.7 cells transfected with empty vector or the PHGDH overexpression plasmid. qPCR analysis of Igf1 mRNA expression (e) or ELISA (f) of IGF1 in the supernatants of BMDMs starved of SG. g Analysis of Igf1-Luc activity in PHGDH-WT and PHGDH-KO BMDMs starved of SG. h qPCR analysis of Igf1 mRNA expression in PHGDH-WT and PHGDH-KO BMDMs supplemented with or without 400 μM SAM. i Analysis of Igf1-Luc activity in RAW264.7 cells transfected with siControl or siPHGDH and supplemented with or without 400 μM SAM. j, k Western blot analysis of histone modification markers in PHGDH-WT and PHGDH-KO BMDMs supplemented with or without 400 μM SAM for 12 h. l ChIP‒qPCR analysis of H3K27me3 enrichment at the indicated positions in the Igf1 promoter in PHGDH-WT and PHGDH-KO BMDMs. PHGDH-WT and PHGDH-KO BMDMs were supplemented with or without 400 μM serine or 400 μM SAM for 12 h and were then treated with or without IFN-γ for 12 h (mo) or IL-4 for 24 h (p, q), followed by ChIP‒qPCR analysis of H3K27me3 enrichment in the promoter of the Igf1 gene. r, s qPCR analysis of Jmjd3 and Ezh2 mRNA expression in PHGDH-WT and PHGDH-KO BMDMs. t Western blot analysis of EZH2 expression in PHGDH-WT and PHGDH-KO BMDMs. BMDMs with siRNA-mediated EZH2 silencing were transfected with empty vector or the PHGDH expression plasmid. qPCR analysis of Igf1 mRNA expression (u), western blot analysis performed with the indicated antibodies (v), and ChIP‒qPCR analysis of H3K27me3 enrichment in the promoter of the Igf1 gene (w). The data are from three independent experiments with biological duplicates in each and are shown as the mean ± SEM values (n = 3) (ai, ls, u, w) or are representative of three independent experiments (j, k, t, v). NS not significant (p ≥ 0.05); *p < 0.05; **p < 0.01; ***p < 0.001
Fig. 7
Fig. 7
Serine metabolism deficiency orchestrates macrophage polarization and JAK–STAT1 signaling via IGF1-dependent p38 activation. Igf1fl/flLyz2-Cre (IGF1R-WT) and Igf1Rfl/flLyz2-Cre+ mouse (IGF1R-KO) BMDMs were stimulated with IFN-γ for 12 h or IL-4 for 24 h, followed by qRT‒PCR analysis of M1 (a) and M2 (b) marker expression. IGF1R-WT and IGF1R-KO BMDMs were treated with IFN-γ (c) or IL-4 (d) for the indicated times, followed by western blot analysis with the indicated antibodies. PHGDH-WT and PHGDH-KO BMDMs were transfected with siControl or siIGF1R and were then stimulated either with IFN-γ for 12 h (e, f) or the indicated times (i) or with IL-4 for 24 h (g, h) or the indicated times (j), followed by qRT‒PCR or western blot analysis. WT BMDMs transfected with siControl or siIGF1R were starved of SG, supplemented with or without 400 μM SAM, and then stimulated either with IFN-γ for 12 h (k) or 30 min (m) or with IL-4 for 24 h (l) or 30 min (n), followed by qRT‒PCR or western blot analysis. The data are from three independent experiments with biological duplicates in each and are shown as the mean ± SEM values (n = 3) (a, b, e, g, k, l) or are representative of three independent experiments (c, d, f, h, i, j, m, n). *p < 0.05, **p < 0.01, ***p < 0.001
Fig. 8
Fig. 8
Serine metabolism regulates the SAM-IGF1-p38 axis to orchestrate macrophage polarization. Suppressing the serine biosynthesis pathway either by inhibition of PHGDH activity or by exogenous serine and glycine restriction, robustly enhances M(IFN-γ) polarization but suppresses M(IL-4) polarization both in vitro and in vivo. Serine metabolism deficiency increases the expression of IGF1 by reducing the abundance of SAM-dependent H3K27me3 in the promoter of the Igf1 gene. IGF1 then activates the p38-dependent JAK–STAT1 axis to promote M(IFN-γ) polarization and suppress STAT6-mediated M(IL-4) activation

References

    1. Sica A, Mantovani A. Macrophage plasticity and polarization: in vivo veritas. J Clin Investig. 2012;122:787–95. - PMC - PubMed
    1. Qian BZ, Pollard JW. Macrophage diversity enhances tumor progression and metastasis. Cell. 2010;141:39–51. - PMC - PubMed
    1. Murray PJ, Allen JE, Biswas SK, Fisher EA, Gilroy DW, Goerdt S, et al. Macrophage activation and polarization: nomenclature and experimental guidelines. Immunity. 2014;41:14–20. doi: 10.1016/j.immuni.2014.06.008. - DOI - PMC - PubMed
    1. Langston PK, Shibata M, Horng T. Metabolism supports macrophage activation. Front Immunol. 2017;8:61. doi: 10.3389/fimmu.2017.00061. - DOI - PMC - PubMed
    1. Van den Bossche J, O’Neill LA, Menon D. Macrophage immunometabolism: where are we (going)? Trends Immunol. 2017;38:395–406. doi: 10.1016/j.it.2017.03.001. - DOI - PubMed

Publication types