. 2022 Oct;25(10):1379-1393.
doi: 10.1038/s41593-022-01167-6. Epub 2022 Sep 30.

A tool for mapping microglial morphology, morphOMICs, reveals brain-region and sex-dependent phenotypes

Affiliations

A tool for mapping microglial morphology, morphOMICs, reveals brain-region and sex-dependent phenotypes

Gloria Colombo et al. Nat Neurosci. 2022 Oct.

Abstract

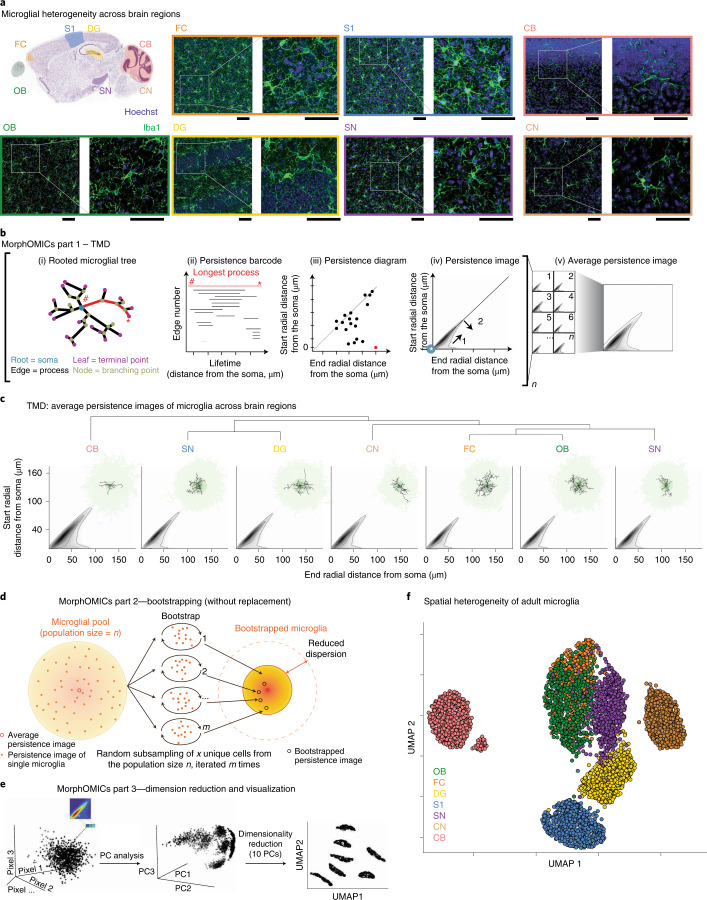
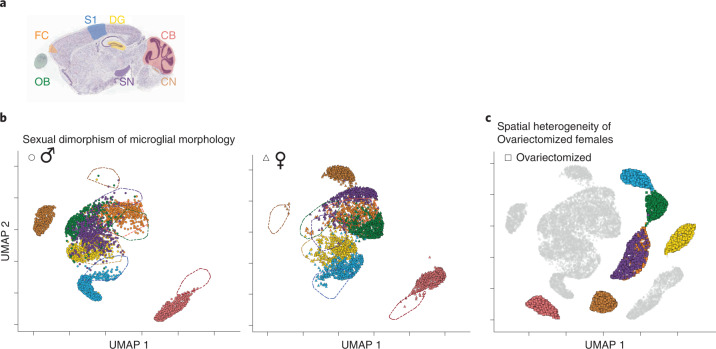
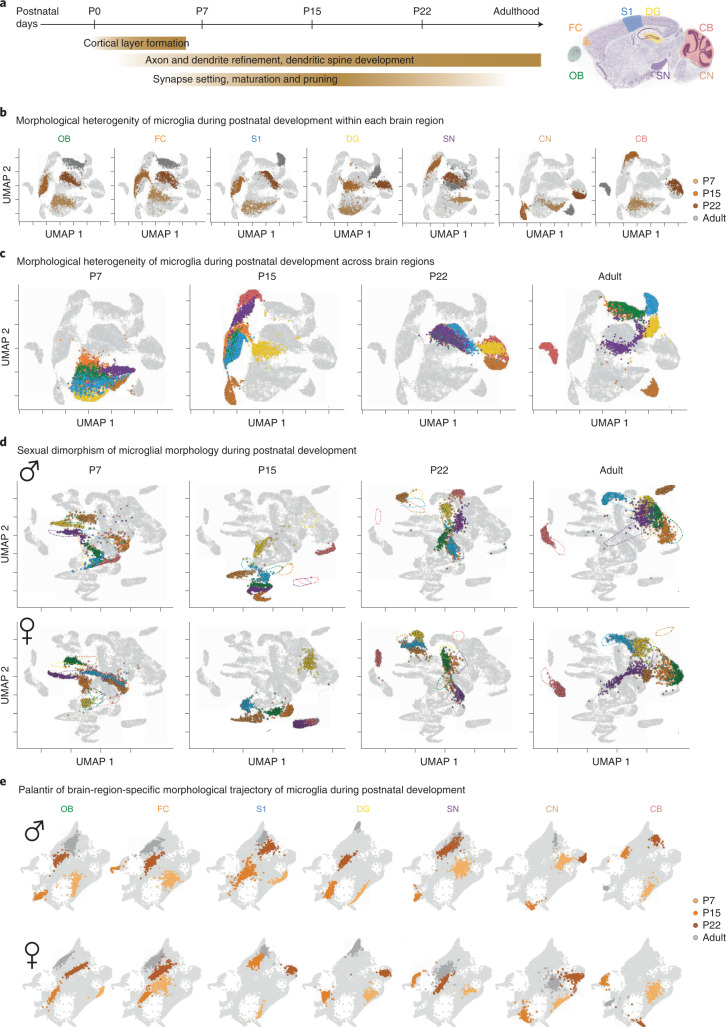
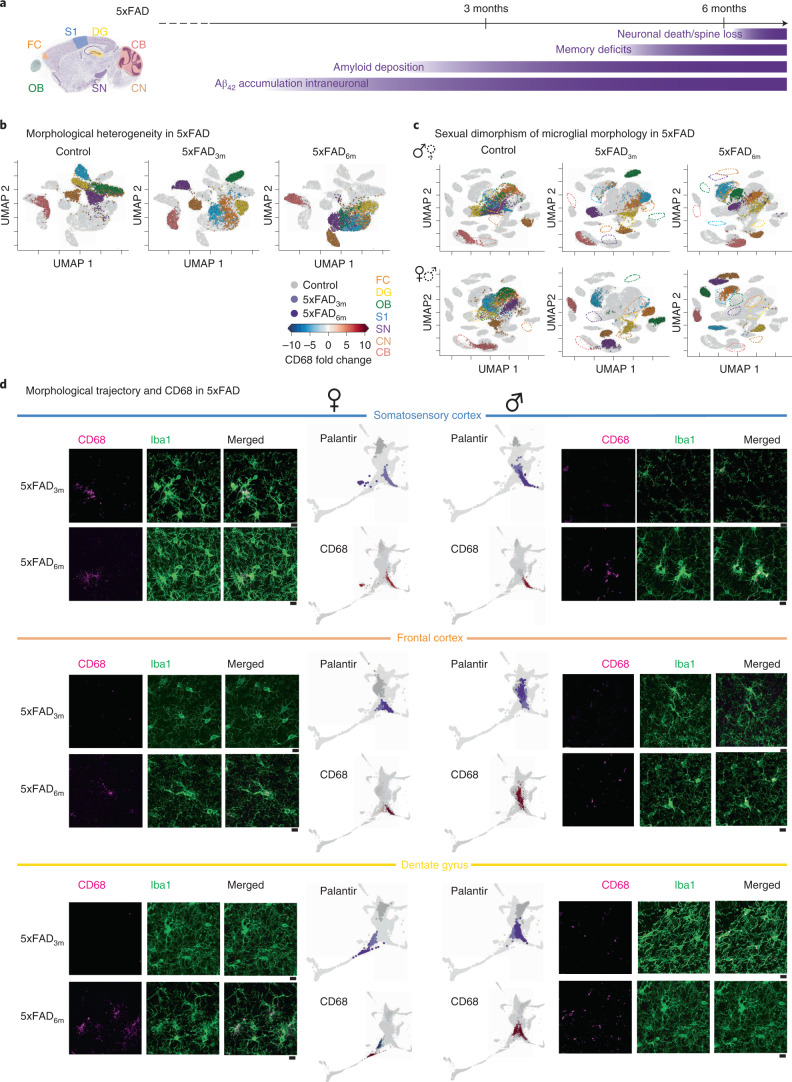
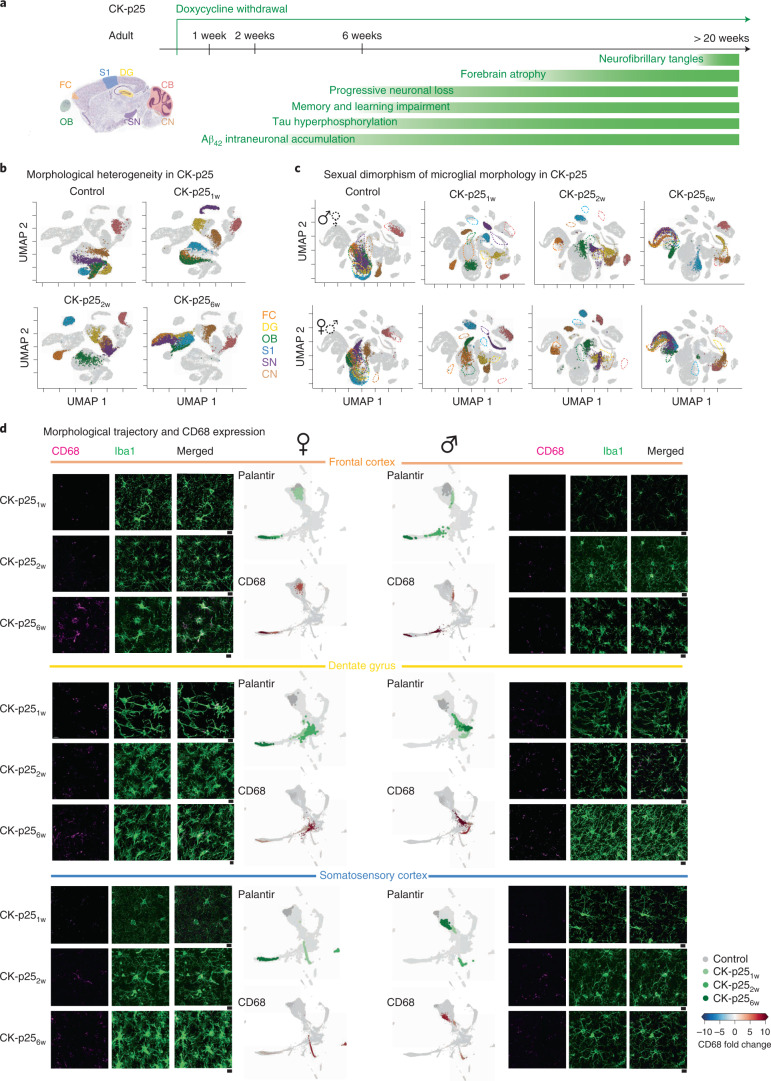
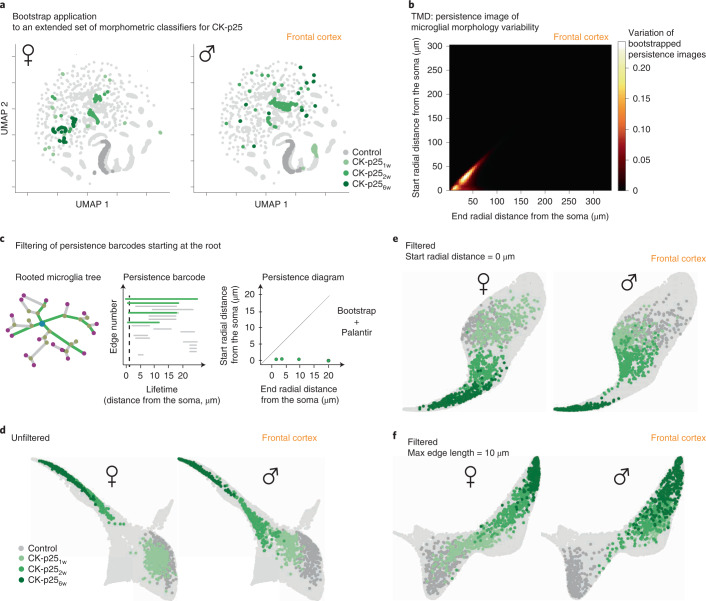
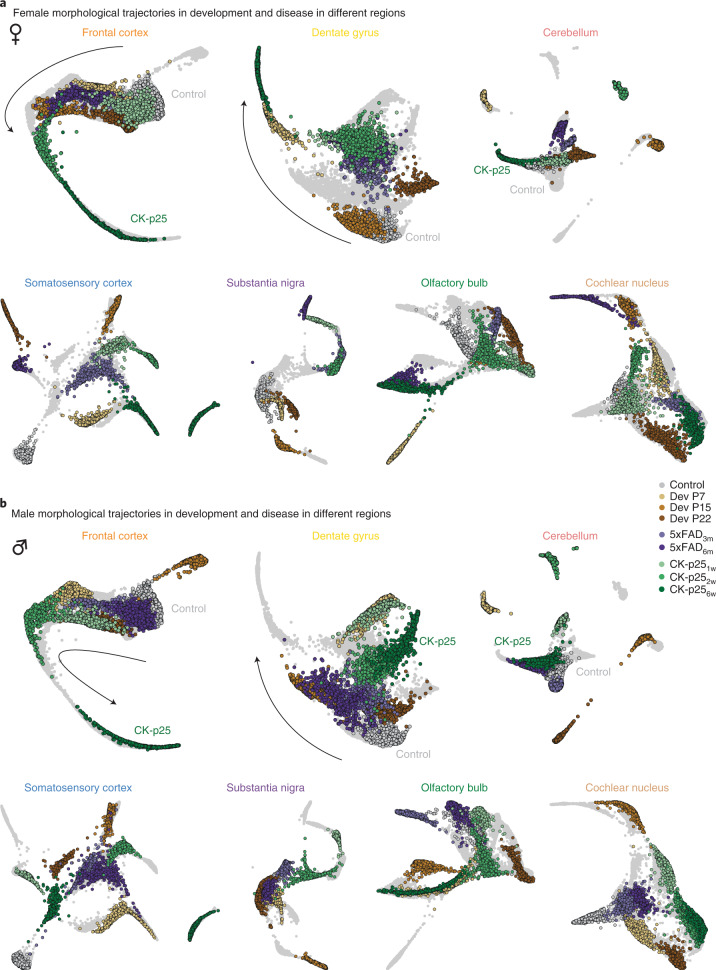
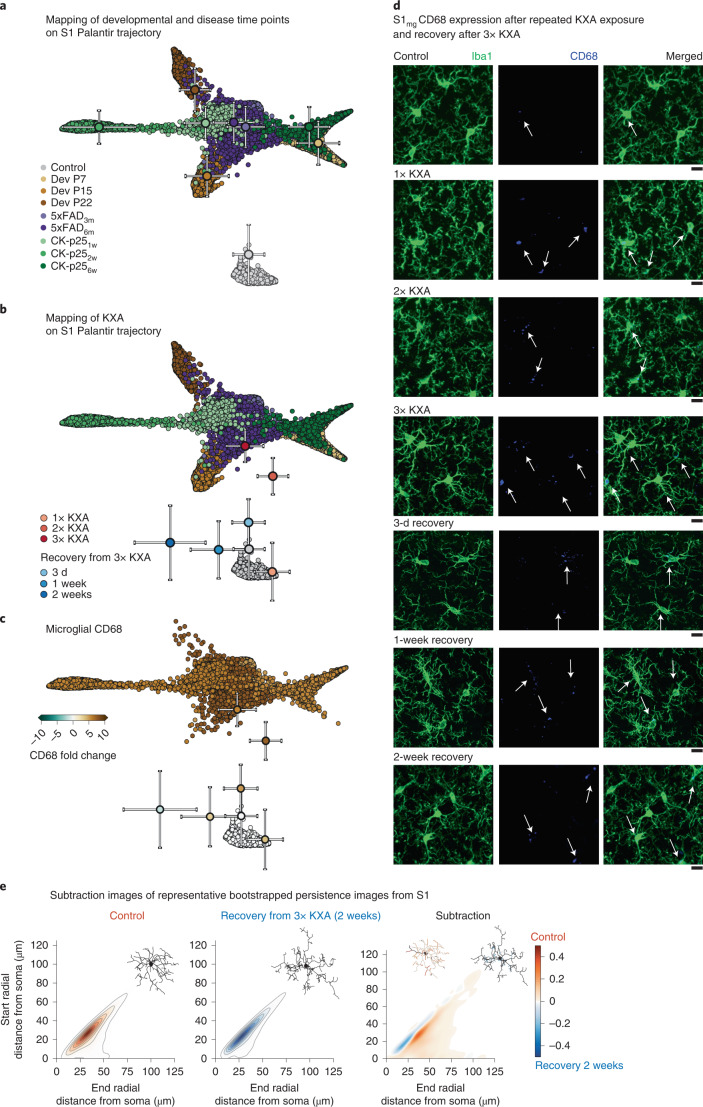
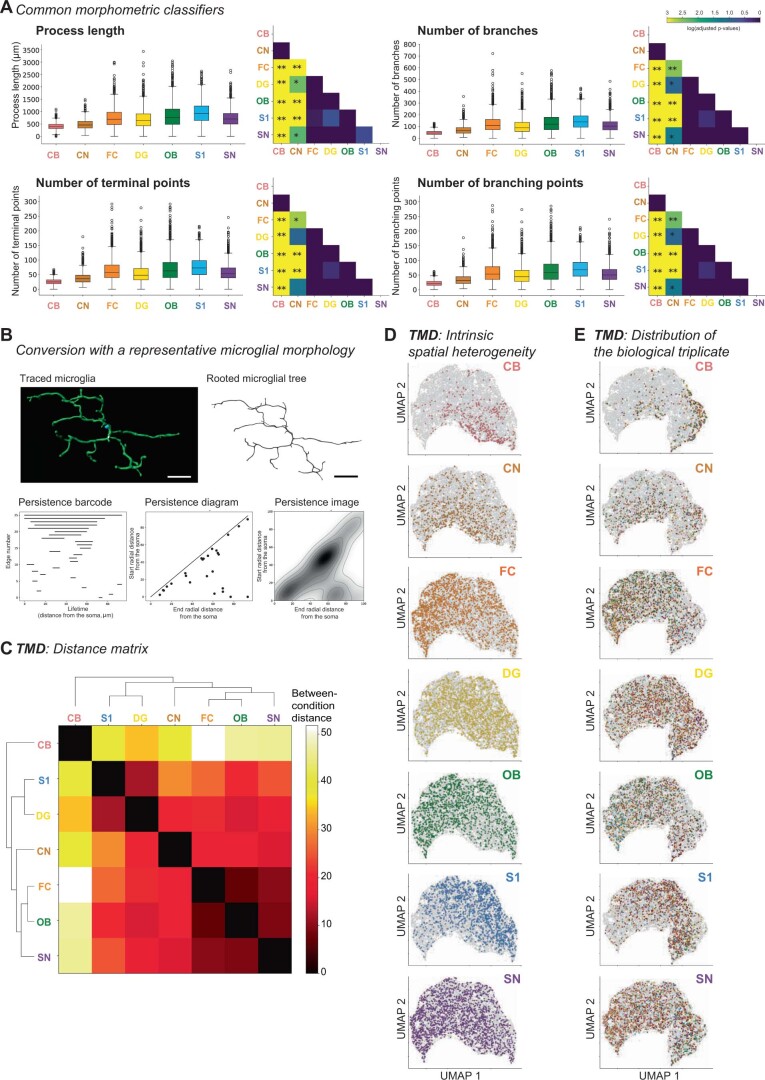
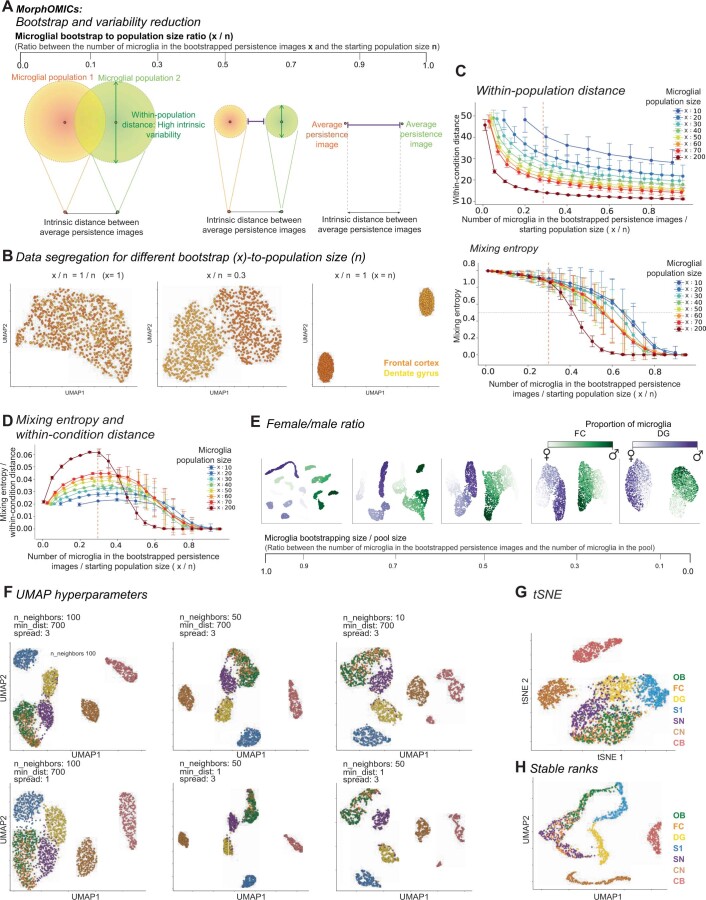
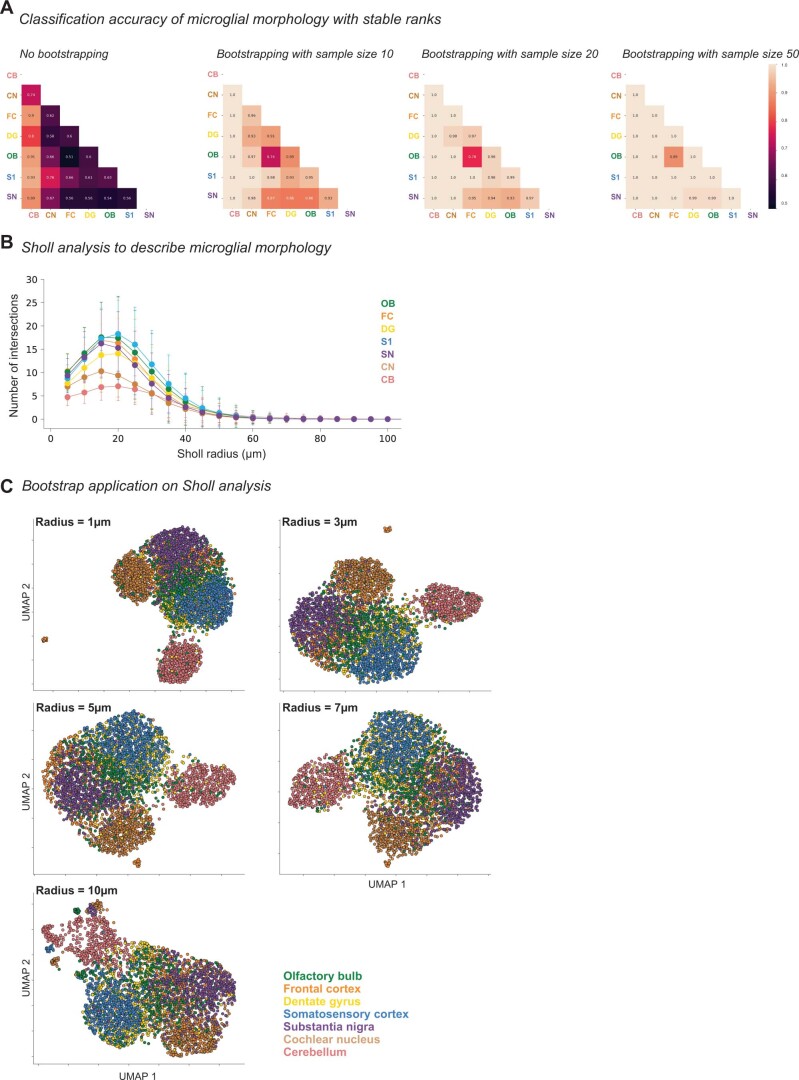
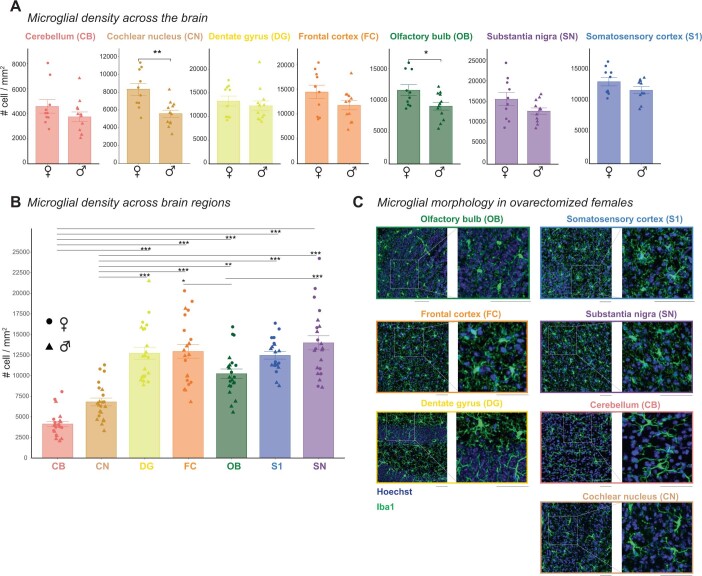
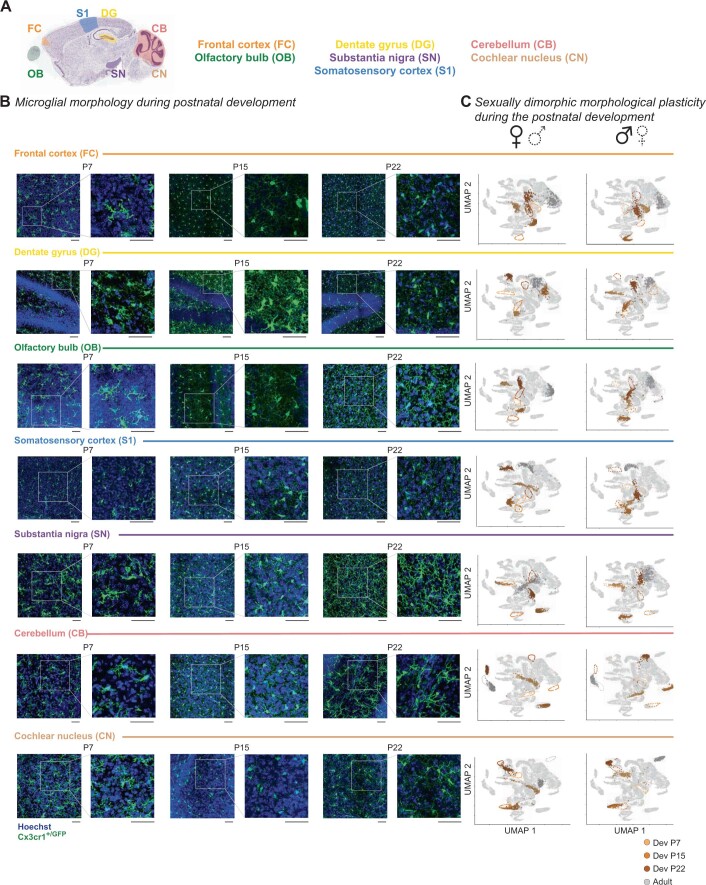
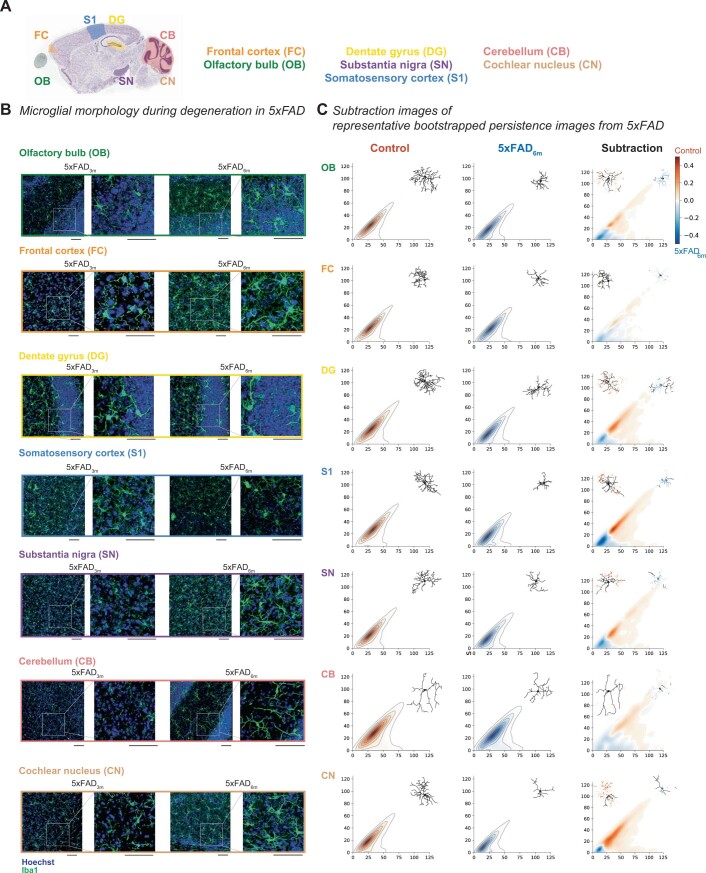
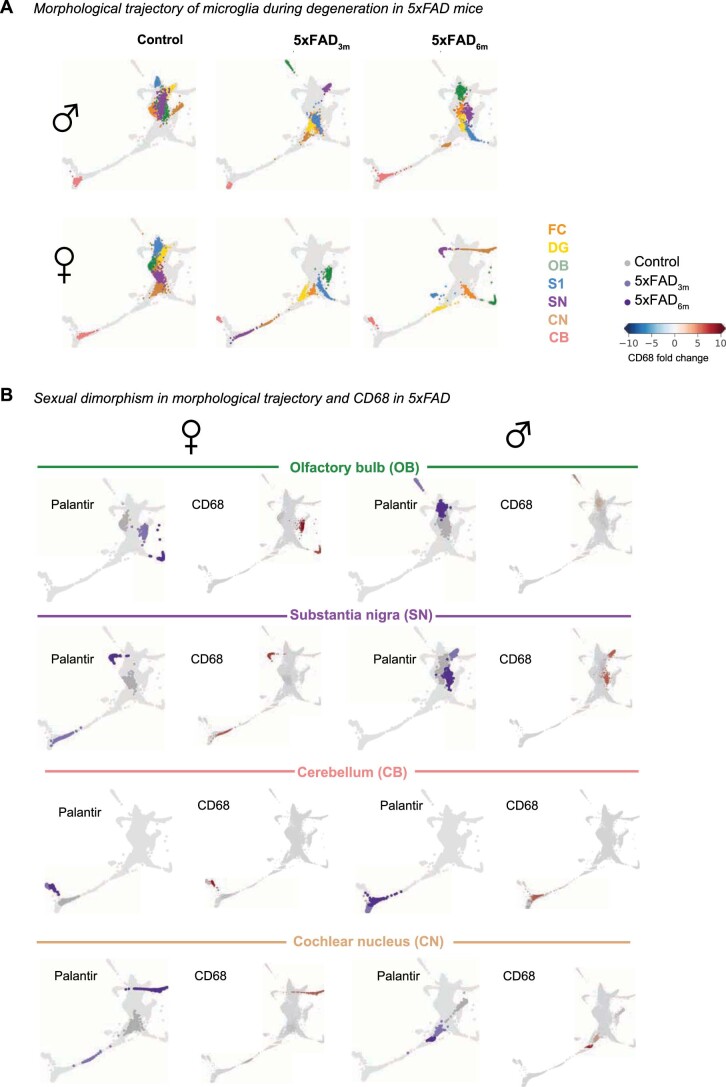
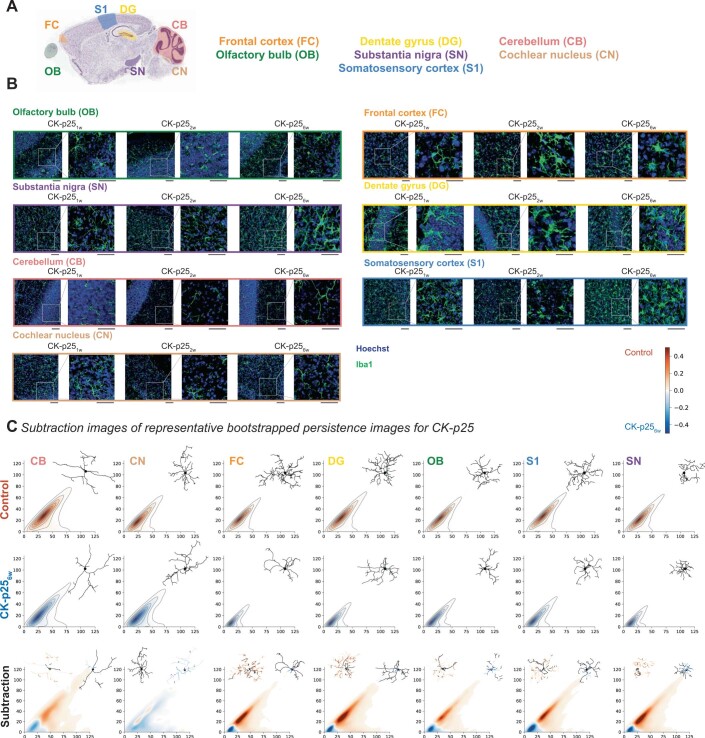
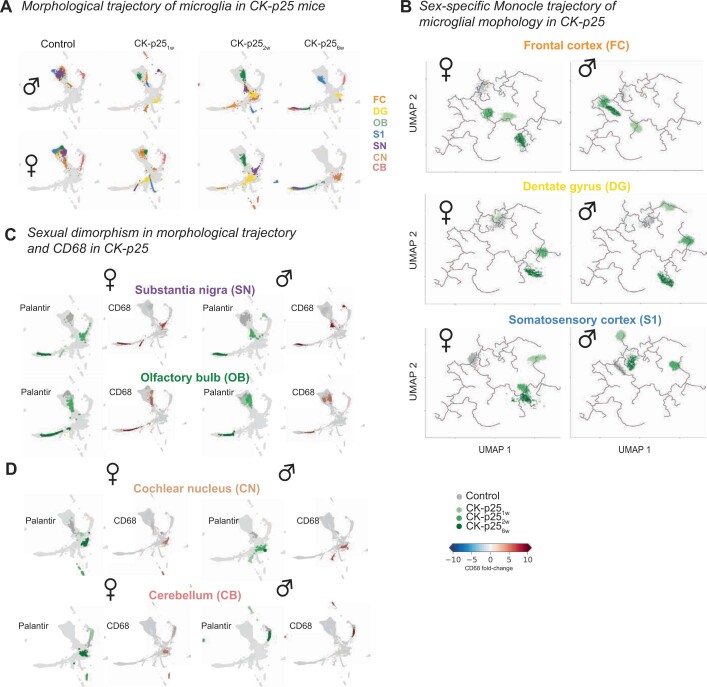
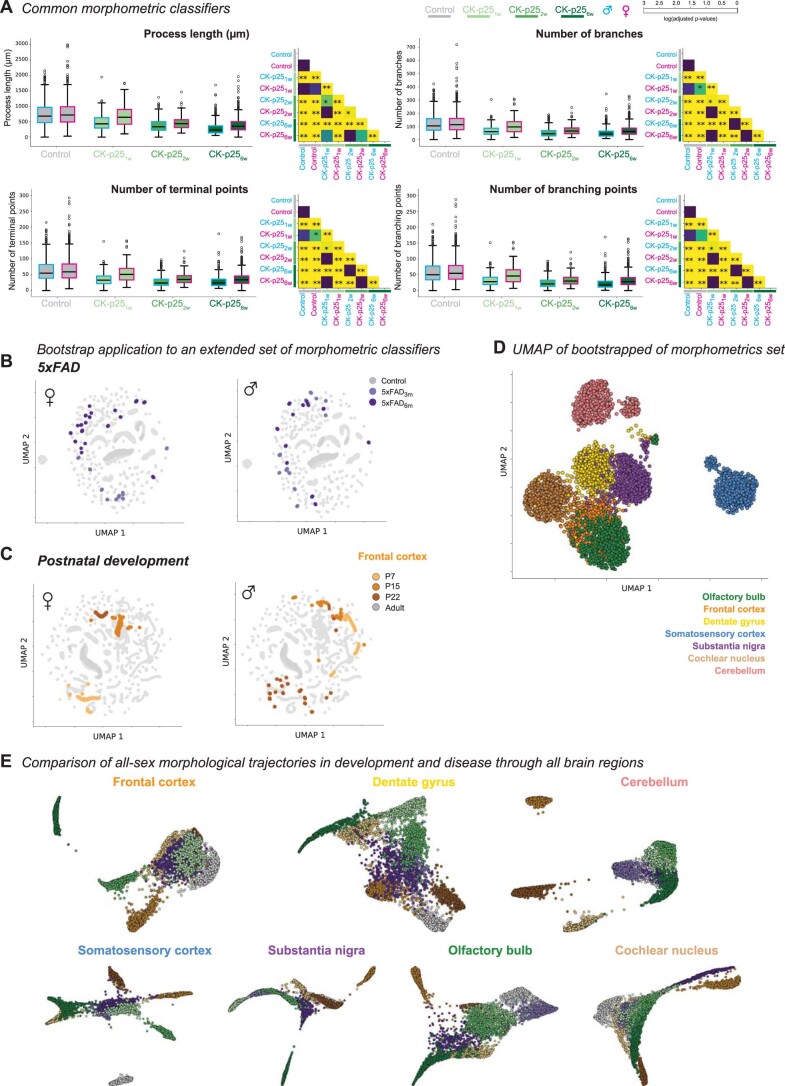
Environmental cues influence the highly dynamic morphology of microglia. Strategies to characterize these changes usually involve user-selected morphometric features, which preclude the identification of a spectrum of context-dependent morphological phenotypes. Here we develop MorphOMICs, a topological data analysis approach, which enables semiautomatic mapping of microglial morphology into an atlas of cue-dependent phenotypes and overcomes feature-selection biases and biological variability. We extract spatially heterogeneous and sexually dimorphic morphological phenotypes for seven adult mouse brain regions. This sex-specific phenotype declines with maturation but increases over the disease trajectories in two neurodegeneration mouse models, with females showing a faster morphological shift in affected brain regions. Remarkably, microglia morphologies reflect an adaptation upon repeated exposure to ketamine anesthesia and do not recover to control morphologies. Finally, we demonstrate that both long primary processes and short terminal processes provide distinct insights to morphological phenotypes. MorphOMICs opens a new perspective to characterize microglial morphology.


Conflict of interest statement

The authors declare no competing interests.

Figures

Fig. 1
Fig. 1. MorphOMICs dissects microglial morphology in adult healthy brains.
a, Sagittal view of the mouse brain (image from Allen Institute) with annotated brain regions. Confocal images of immunostained microglia (Iba1, green) and cell nuclei (Hoechst, blue) from adult C57BL/6J mice with zoom-in view. Scale bars, 50 μm. b, Schematic of MorphOMICs pipeline covering the TMD with a mock microglia skeleton and plots. Red, longest process with start (#) and end (*). Each traced microglia wass converted into a rooted tree (i), followed by a persistence barcode (ii), a persistence diagram (iii) and a persistence image (iv) with grayscale process density in 2D space. Blue spot, soma location. Arrow 1 indicates the distance from the soma. Arrow 2 indicates the length of processes, which increases with distance from the diagonal. Each persistence image (n) is summarized to an average persistence image of a condition. c, Average persistence images of the seven analyzed brain regions organized by hierarchical clustering (Extended Data Fig. 1b). Top-right corner: representative traced microglia. The darker the green, the higher the frequency distribution of the processes. d, Schematic of MorphOMICs pipeline covering bootstrapping. Left: microglial population (n) contains individual persistence images. Center: average persistence image; x unique persistence images were drawn from each of n microglial pools to generate a bootstrapped persistence image. Right: repeating this process m times forms the bootstrapped pool. e, Schematic of MorphOMICs pipeline covering dimension reduction and data visualization with UMAP. Left: each persistence image is pixelated; each pixel represents a dimension. Middle: reducing dimensions with principal component (PC) analysis. Right: further dimensionality reduction based on the first ten PCs. f, UMAP plot of MorphOMICs-analyzed adult microglia, color-coded for each brain region. Each dot represents a bootstrapped persistence image. nsamples = 500 per condition (‘Average and bootstrapped persistence images’). In d, see Supplementary Table 5 for the number of animals. Points situated close in the UMAP space indicate similar bootstrapped persistence image; however, the point’s actual position is irrelevant.
Fig. 2
Fig. 2. MorphOMICs identifies sexually dimorphic microglial morphology in healthy adults.
a, Sagittal view of analyzed brain regions. b,c, MorphOMICs-analyzed microglia in male, female and ovariectomized adult mice. b, UMAP plot for each brain region color coded for males (left) or females (right) with dashed lines as reference. Each dot represents a bootstrapped persistence image. c, UMAP plot of ovariectomized females. Ovariectomized brain regions are highlighted. Gray indicates the non-ovariectomized counterpart as reference. nsamples = 500 per condition (‘Average and bootstrapped persistence images’).
Fig. 3
Fig. 3. Microglial phenotypes during postnatal development.
a, Timeline of postnatal brain development with highlighted events. Sagittal view of analyzed brain regions. bd, UMAP plots of MorphOMICs-analyzed microglia across seven brain regions in Cx3cr1-GFP+/− mice at P7, P15, P22 and adults (b), and color-coded brain regions for both sexes (c) and for each sex independently with dashed lines as the reference for each developmental time point (d). e, Palantir reconstruction of microglia morphological trajectory from d with P7, P15, P22 and adults highlighted for each brain region. Nearby points indicate similar persistence images. Each dot represents a bootstrapped persistence image. nsamples = 500 per condition (‘Average and bootstrapped persistence images’).
Fig. 4
Fig. 4. Microglia phenotypic spectrum in 5xFAD transgenic model of neurodegeneration is sexually dimorphic.
a, Sagittal view of analyzed brain regions with color coding. Timeline of degeneration events in the 5xFAD transgenic mouse model. b,c, UMAP plots of MorphOMICs-analyzed microglia across seven brain regions (color coded) for control, 5xFAD3m and 5xFAD6m with both sexes (b) or for each sex separately (c). Each degeneration time point is highlighted in a separate UMAP. Each dot represents a bootstrapped persistence image. nsamples = 500 per condition (‘Average and bootstrapped persistence images’). d, Representative confocal images of immunostained microglia (Iba1; green) and lysosome (CD68; magenta), followed by Palantir reconstruction of microglial trajectory (top) with corresponding color-coded average CD68 fold change (bottom) across three animals from females and males for 5xFAD3m and 5xFAD6m in S1, FC and DG. Scale bar, 10 μm. Fold change < 0 in blue and >0 in red. Aβ42, amyloid beta.
Fig. 5
Fig. 5. The microglia phenotype of females in CK-p25 model of neurodegeneration exhibit an earlier morphological shift than in males.
a, Sagittal view of analyzed brain regions with color coding. Timeline of degeneration events upon doxycycline withdrawal in the CK-p25 transgenic mouse model. b,c, UMAP plots displaying microglial morphological heterogeneity in adult control mice and CK-p25 mice at 1, 2 and 6 weeks after doxycycline withdrawal across all the analyzed brain regions for both sexes (b) or for each sex separately (c). Each dot represents a bootstrapped persistence image, and each UMAP highlights a distinct degeneration time point. nsamples = 500 per condition (‘Average and bootstrapped persistence images’). d, Representative confocal images of immunostained microglia (Iba1; green) and lysosomes (CD68; magenta) in CK-p25 mice at 1, 2 and 6 weeks after doxycycline withdrawal in FC, DG and S1. Scale bar, 10 μm. Palantir reconstruction of microglial trajectory (top) with corresponding color-coded average CD68 fold change (bottom) across three animals. Females, left. Males, right. Fold change < 0 in blue and > 0 in red.
Fig. 6
Fig. 6. MorphOMICs applied to primary processes reiterates sexual dimorphism in CK-p25 mice.
a, Bootstrapping and UMAP representations of an extended set of morphological classifiers (Supplementary Table 4) for control, CK-p251w, CK-p252w and CK-p256w female and male mice across all brain regions (without cochlear nucleus and cerebellum for simplicity). The frontal cortex is highlighted. Each dot represents an averaged extended set of morphometric classifiers across 30 microglia that form the bootstrap population. b, Heat map of the bootstrapped persistence images pixel-wise standard variation across control and CK-p25 conditions of the frontal cortex. Black denotes no variation; white denotes high variation. c, Schematic for filtering persistence barcodes with MorphOMICs. Starting from microglial rooted tree, only bars are selected that are born at 0 µm independent of their length (representing likely primary branches, green), and are converted into a persistence diagram. df, Palantir trajectory of all brain regions (without cochlear nucleus and cerebellum for simplicity) from control and CK-p25 condition with highlighted FC microglia trajectory for females and males with unfiltered bars (d) or filtered bars (e, start radial distance from the soma, 0 µm; f, maximum bar length, 10 µm). nsamples = 300 per condition (‘Average and bootstrapped persistence images’).
Fig. 7
Fig. 7. Development and disease phenotypes integrate into a reactivity spectrum.
a,b, Palantir reconstructions calculated independently for each brain region for control, P7, P15, P22, CK-p251w, CK-p252w, CK-p256w, 5xFAD3m and 5xFAD6m male and female mice. Microglial trajectory is highlighted for females (a) and males (b). Black arrow, control-to-disease spectrum. nsamples = 200 per condition (‘Average and bootstrapped persistence images’).
Fig. 8
Fig. 8. MorphOMICs applied to KXA-treated microglia.
a, Mapping of S1 microglial morphology on Palantir trajectory. Centroids indicating the mean position of mapped points in a given condition with the corresponding standard deviations. b, Palantir reconstruction of microglia morphological trajectory in S1 from adult control, P7, P15, P22, 5xFAD3m, 5xFAD6m, CK-p251w, CK-p252w and CK-p256w after 1×, 2× and 3× KXA and 3× KXA recovery after 3 d, 1 week and 2 weeks. Centroids indicate the mean position of mapped points in a given condition with the corresponding standard deviations. nsamples = 300 per condition (‘Average and bootstrapped persistence images’). c, Corresponding color-coded average CD68 fold change across three animals. Fold change, blue < 0; brown > 0. d, Representative confocal images of immunostained microglia (Iba1; green) and endosomal/lysosomal CD68 (blue) from control, 1×, 2× and 3× KXA and 3× KXA recovery after 3 d, 1 week and 2 weeks from the S1. Arrows indicate CD68 inside of microglia. Scale bar, 10 μm. e, Representative persistence images corresponding to control and 3× KXA2w centroids from b with color-coded process density. Top-right corner: representative traced microglia. Subtraction image with highlighted overrepresented processes on the representative microglia.
Extended Data Fig. 1
Extended Data Fig. 1. Classic morphometry analysis and intrinsic variability of microglial morphology.
a: Box plots for the following morphometric features: process length, number of branches, and terminal and branching points for traced adult C57BL/6J microglia across different brain regions color-coded: CB (cerebellum, n = 299), CN (cochlear nucleus, n = 498), FC (frontal cortex, n = 926), DG (dentate gyrus, n = 902), OB (olfactory bulb, n = 796), S1 (somatosensory cortex, n = 719), SN (substantia nigra, n = 1050) from at least six animals. For number of animals per condition and region see also Supplementary Table 5. Box denotes first and last quartile with central line indicating the median. Whiskers: range of quantities. Open circle: outliers. Next, matrices with color-coded p-values for the pairwise comparison of each morphometric. Kruskal-Wallis test, Bonferroni correction using Dunn’s test, * p < 0.05, ** p < 0.01 (see Supplementary Table 1, 3). b: Example of a 3D-traced microglia and its conversion to a persistence image. Top: left, Imaris-traced skeleton of a microglia. Scale bar: 10 µm. Right, formatted rooted microglia tree, which is used for the persistence plots. Bottom: persistence barcode (left), persistence diagram (middle), and persistence image (right) exactly matching the rooted tree. c: Hierarchically-ordered heat map for pairwise TMD intrinsic distances between average persistence images from microglia across brain regions from Fig. 1a. d-e: UMAP plots of the entire microglial population size (grey) with color-highlighted brain regions (d) or animals (e). Each dot represents a single persistence image. (e) Triangle and circle for females and males, respectively. Each animal is color-coded.
Extended Data Fig. 2
Extended Data Fig. 2. Details about the MorphOMICs paradigm.
a: Schematic of the bootstrapping effects on the distance between tree structures from the same population (within-population distance, green arrows) and two distinct populations (distance between average persistence images, purple lines). Increase of bootstrap-to-population size ratio (x/n) reduces within-population distance and increases distance between average persistence images. b: UMAP plots of MorphOMICs-analyzed microglia for frontal cortex (orange) and dentate gyrus (yellow) for different bootstrap-to-population size ratios. Left: x = 1, allows no segregation. Middle: x/n = 0.3. Right: x/n = 1 causes accentuation. c, d: Line plot ± SD displays how within-population distance (c, top) and mixing entropy (c, bottom), and the ratio between mixing entropy and within-condition distance (d) varies by enhancing bootstrap-to-population size ratio (x/n). An empirical threshold of 0.3 was selected (red dashed line). Data are presented as mean values ± SD. e: UMAP plots of MorphOMICs-analyzed microglia for frontal cortex (green) and dentate gyrus (purple) for different bootstrap-to-population size ratios and varying male-to-female ratios within the population size. f: UMAP plots of MorphOMICs-analyzed microglial morphology across seven brain regions as shown for Fig. 1f with examples of tested hyperparameters for number of neighbors (n_neighbors), minimum distance (min_dist), and spread. Olfactory bulb (OB), frontal cortex (FC), dentate gyrus (DG), somatosensory cortex (S1), substantia nigra (SN), cochlear nucleus (CN), and cerebellum (CB). g: tSNE plot of MorphOMICs-analyzed microglia across seven brain regions as shown in Fig. 1f. h: UMAP plots of stable ranks representation of microglial morphology (see Methods: Stable Ranks) across seven brain regions. nsamples = 500 per condition (see also Methods: Average and bootstrapped persistence images). SD: standard deviation.
Extended Data Fig. 3
Extended Data Fig. 3. Classification accuracy of microglial morphology and bootstrap application on Sholl analysis.
a: Heat-map of classification accuracy between pairs of brain regions using stable ranks for different bootstrap sizes. Numbers indicates the percentage of microglia correctly assigned in the classification task, averaged over 10 repeated cross-validations. 1, perfect assignment; 0.5 random assignment. b: Sholl curves for each brain region. Data are presented as mean number of processes (points) ± SD that intersect with a series of concentric Sholl spheres centered on the soma and spaced at 5 µm. For number of animals per condition and region see Supplementary Table 4, 5. c: Bootstrapped and UMAP visualized Sholl-analyzed microglia, color-coded for each brain region. Each dot represents a bootstrapped Sholl analysis. Each plot has a set radius step size (1, 3, 5, 7, 10 µm). Olfactory bulb (OB), frontal cortex (FC), dentate gyrus (DG), somatosensory cortex (S1), substantia nigra (SN), cochlear nucleus (CN), and cerebellum (CB). nsamples = 300 per condition (see also Methods: Average and bootstrapped persistence images). SD: standard deviation.
Extended Data Fig. 4
Extended Data Fig. 4. Adult microglial density and microglial morphologies after ovariectomy.
a-b: Bar plot of microglial density distribution for each brain regions in C57BL/6J female and male adults. Data are presented as mean number of cells per mm2 ± SD. After determining normal distribution of the features with Shapiro-Wilk test, (a) sex averages for microglia from each region were compared with two-sided t-test. Each dot represents one animal. CNmg(n= 10, n= 12): t = 3.504, df = 15.1, p-value = 0.00312. OBmg(n= 10, n= 12): t = 2.401, df = 16.864, p-value = 0.0282. CBmg(n= 10, n= 12): t = 1.2564, df = 17.327, p-value = 0.2257. FCmg(n= 10, n= 12): t = 1.6236, df = 16.275, p-value = 0.1237. SNmg(n= 10, n= 12): t = 1.6261, df = 12.901, p-value = 0.1281. DGmg(n= 10, n= 12): t = 0.68892, df = 19.669, p-value = 0.4989. S1mg(n= 10, n= 12) t = 1.5618, df = 17.518, p-value = 0.1362.. SD: standard deviation. * p < 0.05, ** p < 0.01. (b) Analysis of variance (ANOVA) on densities yielded significant variation among conditions, F = 17.98, p < .001. F= 33.35, p < .001. Tukey post hoc test was computed for pairwise comparisons. (CN-CB)p.adj= 0.0523543; (DG-CB)p.adj= 0.0000000; (FC-CB)p.adj= 0.0000000; (OB-CB)p.adj= 0.0000000; (S1-CB)p.adj= 0.0000000; (SN-CB)p.adj= 0.0000000; (DG-CN)p.adj= 0.0000000; (FC-CN)p.adj= 0.0000000; (OB-CN)p.adj= 0.0036669; (S1-CN)p.adj= 0.0000002; (SN-CN)p.adj= 0.0000000; (FC-DG)p.adj= 0.9999824; (OB-DG)p.adj= 0.0898840; (S1-DG)p.adj= 0.9999557; (SN-DG)p.adj= 0.7953985; (OB-FC)p.adj= 0.0474778; (S1-FC)p.adj= 0.9985099; (SN-FC)p.adj= 0.9051447; (S1-OB)p.adj= 0.1998237; (SN-OB)p.adj= 0.0009832; (SN-S1)p.adj= 0.643197. Each dot represents one animal with symbols for female (circle) and male (triangle). Number of animals per region= 22. c: Confocal images of immunostained microglia (Iba1, green) and cell nuclei (Hoechst, blue) from ovariectomized C57BL/6J adult mice for each brain region with zoom-in. Scale bar: 50 μm. SD: standard deviation. Source data
Extended Data Fig. 5
Extended Data Fig. 5. Microglial phenotypic spectrum during postnatal development.
a: Sagittal view of analyzed brain regions: olfactory bulb (OB), frontal cortex (FC), dentate gyrus (DG), somatosensory cortex (S1), substantia nigra (SN), cochlear nucleus (CN) and cerebellum (CB). b: Confocal images of GFP+ microglia (green) and cell nuclei (Hoechst, blue) from Cx3cr1+/GFP mice at P7, P15, and P22 for each brain region with zoom-in. Scale bar: 50 μm. c: UMAP plots of MorphOMICs-analyzed microglia from b for females (left) and males (right) at P7, P15, P22, and adults. Separate UMAP for each brain region and sex. Each dot represents a bootstrapped persistence image. nsamples = 500 per condition (see also Methods: Average and bootstrapped persistence images).
Extended Data Fig. 6
Extended Data Fig. 6. Microglia phenotypic spectrum in the 5xFAD model of familiar Alzheimer’s neurodegeneration.
a: Sagittal view of analyzed brain regions: olfactory bulb (OB), frontal cortex (FC), dentate gyrus (DG), somatosensory cortex (S1), substantia nigra (SN), cochlear nucleus (CN) and cerebellum (CB). b: Confocal images showing immunostained microglia (Iba1, green) and cell nuclei (Hoechst, blue) from the analyzed brain regions in 5xFAD3m and 5xFAD6m (3 and 6 months, respectively) with zoom-in. Scale bar: 50 μm. c: Representative persistence images corresponding to each cluster centroid from Fig. 4b with color-coded process density. Top right corner, representative traced microglia. Subtraction image with highlighted overrepresented processes on the representative microglia.
Extended Data Fig. 7
Extended Data Fig. 7. Sexually dimorphic microglia phenotype in 5xFAD.
a: Palantir reconstruction of microglial morphological trajectory in males (top) and females (bottom). Each time-point highlighted in a separate Palantir plot. b: Palantir reconstruction of microglial trajectory with corresponding color-coded CD68 fold change next to it for females (left) and males (right) in control adult, 5xFAD3m, and 5xFAD6m of OB, SN, CN, and CB. Fold change: blue < 0; red > 0. Olfactory bulb (OB), frontal cortex (FC), dentate gyrus (DG), somatosensory cortex (S1), substantia nigra (SN), cochlear nucleus (CN), and cerebellum (CB). nsamples = 500 per condition (see also Methods: Average and bootstrapped persistence images).
Extended Data Fig. 8
Extended Data Fig. 8. Microglia phenotypic spectrum in the CK-p25 model of sporadic neurodegeneration.
a: Sagittal view of analyzed brain regions: olfactory bulb (OB), frontal cortex (FC), dentate gyrus (DG), somatosensory cortex (S1), substantia nigra (SN), cochlear nucleus (CN) and cerebellum (CB). b: Confocal images showing stained microglia (Iba1, green) and cell nuclei (Hoechst, blue) from analyzed brain regions and CK-p251w, CK-p252w, CK-p256w mice (1-, 2- and 6-weeks after doxycycline withdrawal) with zoom-in. Scale bar: 50 μm. c: Representative persistence images corresponding to each cluster centroid from Fig. 5b with color-coded process density. Top right corner, representative traced microglia. Subtraction image with highlighted overrepresented processes on the representative microglia.
Extended Data Fig. 9
Extended Data Fig. 9. Sexually dimorphic microglial phenotype in CK-p25.
a: Palantir reconstruction of microglial morphological trajectory in males (top) and females (bottom) in control and CK-p25 mice. Each disease time-point highlighted in a separate Palantir plot. b: Monocle reconstruction of microglia trajectory of females (left) and males (right) in control, adult and CK-p25 mice FC, DG, and S1. c-d: Palantir reconstruction of microglia trajectory and corresponding color-coded CD68 fold-change of females (left) and males (right) for SN, OB (c) and CN, CB (d). Fold change: blue < 0; red > 0. nsamples = 500 per condition (see also Methods: Average and bootstrapped persistence images).
Extended Data Fig. 10
Extended Data Fig. 10. Classical morphometric do not recapitulate MorphOMICs observations.
a: Box plots for the selected features process length, number of branches, terminal- and branching points of control (n= 926, n= 894), and CK-p251w (n= 219, n= 194), CK-p252w (n= 264, n= 492), CK-p256w (n= 858, n= 462) mice (1-, 2- and 6-weeks after doxycycline withdrawal, respectively) in the frontal cortex (FC). For number of animals per condition and region see also Supplementary Table 5. Box denotes first and last quartile with central line indicating the median. Whiskers: range of quantities. Open circle: outliers. Next: Matrices showing color-coded p-values for the pairwise comparison of each morphometric. Kruskal-Wallis test, Bonferroni correction using Dunn’s test, * p < 0.05, ** p < 0.01 (see Supplementary Table 1). b, c: Bootstrapped and UMAP representations of an extended set of morphological classifiers (see Supplementary Table 3) applied to females (left) and males (right) in 5xFAD (b) and developmental time points (c) with highlighted frontal cortex (calculation without cochlear nucleus and cerebellum for simplicity). Each dot represents an averaged extended set of morphometric classifiers across 30 microglia that form the bootstrap population. d: Morphometric UMAP of the bootstrapped comprehensive 27 morphometrics set showing regional heterogeneity of microglia in adult healthy mice. Brain regions are color-coded. e: Reference atlas for each brain region represented as Palantir reconstruction containing both sexes.nsamples = 300(B-D) and nsamples = 200 (E) per condition (see also Methods: Average and bootstrapped persistence images).

References

    1. Gouwens NW, et al. Classification of electrophysiological and morphological neuron types in the mouse visual cortex. Nat. Neurosci. 2019;22:1182–1195. doi: 10.1038/s41593-019-0417-0. - DOI - PMC - PubMed
    1. Morrison, H. W. & Filosa, J. A. A quantitative spatiotemporal analysis of microglia morphology during ischemic stroke and reperfusion. J. Neuroinflammation10, 4 (2013). - PMC - PubMed
    1. Heindl, S. et al. Automated morphological analysis of microglia after stroke. Front. Cell. Neurosci. 12, 106 (2018). - PMC - PubMed
    1. Kongsui R, Beynon SB, Johnson SJ, Walker FR. Quantitative assessment of microglial morphology and density reveals remarkable consistency in the distribution and morphology of cells within the healthy prefrontal cortex of the rat. J. Neuroinflammation. 2014;11:182. doi: 10.1186/s12974-014-0182-7. - DOI - PMC - PubMed
    1. Tan YL, Yuan Y, Tian L. Microglial regional heterogeneity and its role in the brain. Mol. Psychiatry. 2019;25:351–367. doi: 10.1038/s41380-019-0609-8. - DOI - PMC - PubMed

Publication types

LinkOut - more resources