

Oxidative stress genes in patients with esophageal squamous cell carcinoma: construction of a novel prognostic signature and characterization of tumor microenvironment infiltration
- PMID: 36180848
- PMCID: PMC9523924
- DOI: 10.1186/s12859-022-04956-9
Oxidative stress genes in patients with esophageal squamous cell carcinoma: construction of a novel prognostic signature and characterization of tumor microenvironment infiltration
Abstract
Background: Oxidative stress plays an important role in the progression of various types of tumors. However, its role in esophageal squamous cell carcinoma (ESCC) has seldom been explored. This study aimed to discover prognostic markers associated with oxidative stress in ESCC to improve the prediction of prognosis and help in the selection of effective immunotherapy for patients.
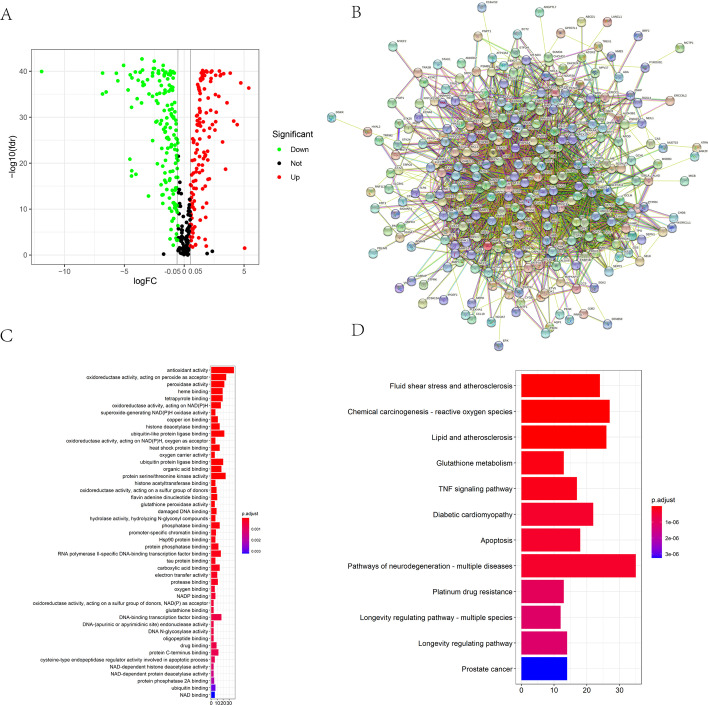
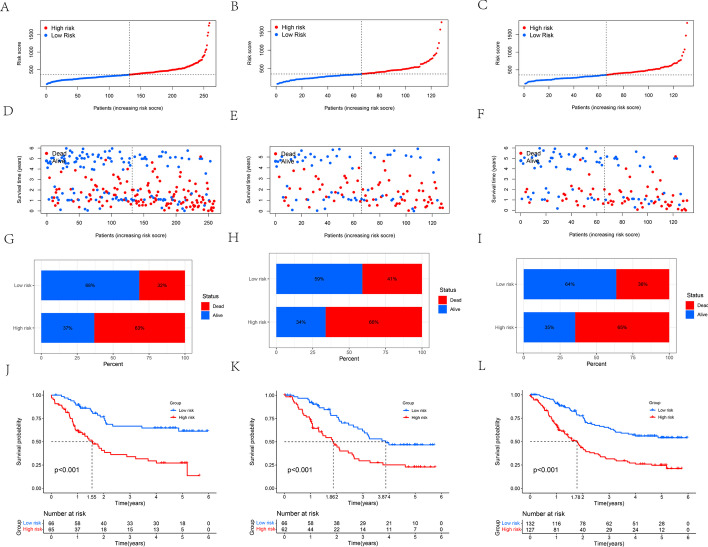
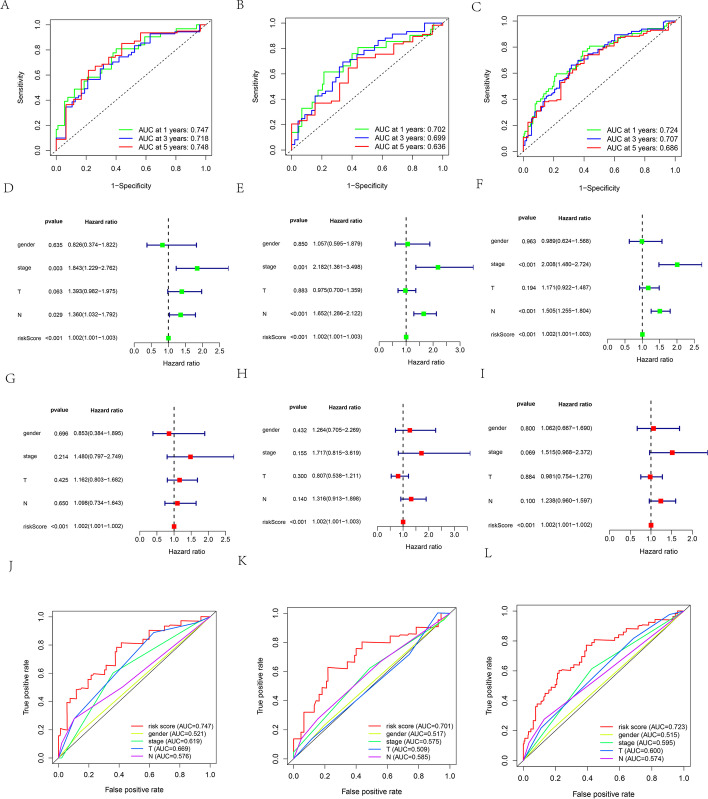
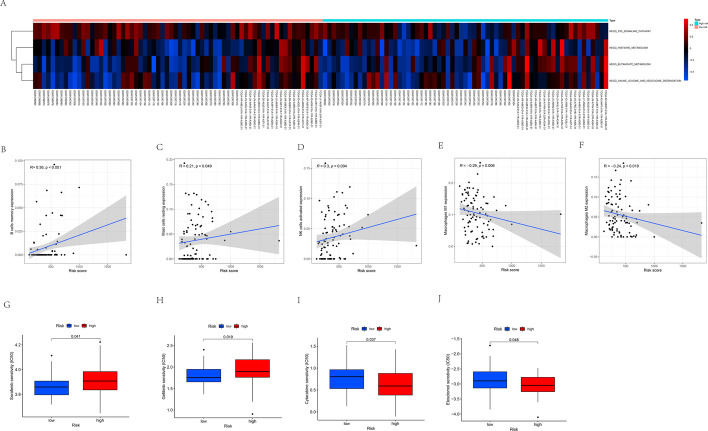
Results: A consensus cluster was constructed using 14 prognostic differentially expressed oxidative stress-related genes (DEOSGs) that were remarkably related to the prognosis of patients with ESCC. The infiltration levels of neutrophils, plasma cells, and activated mast cells, along with immune score, stromal score, and estimated score, were higher in cluster 1 than in cluster 2. A prognostic signature based on 10 prognostic DEOSGs was devised that could evaluate the prognosis of patients with ESCC. Calculated risk score proved to be an independent clinical prognostic factor in the training, testing, and entire sets. P53 signaling pathway was highly enriched in the high-risk group. The calculated risk score was positively related to the infiltration levels of resting mast cells, memory B cells, and activated natural killer (NK) cells and negatively associated with the infiltration levels of M1 and M2 macrophages. The relationship between clinical characteristics and risk score has not been certified. The half-maximal inhibitory concentration (IC50) values for sorafenib and gefitinib were lower for patients in the low-risk group.
Conclusion: Our prognostic signature based on 10 prognostic DEOSGs could predict the disease outcomes of patients with ESCC and had strong clinical value. Our study improves the understanding of oxidative stress in tumor immune microenvironment (TIME) and provides insights for developing improved and efficient immunotherapy strategies.
Keywords: Esophageal squamous cell carcinoma; Immune infiltrates; Marker; Oxidative stress; Prognosis.
© 2022. The Author(s).
Conflict of interest statement
The authors declare that the research was conducted in the absence of any commercial or financial relationships that could be construed as a potential conflict of interest.
Figures


Similar articles
-
Comprehensive Analysis of PD-L1 Expression, Immune Infiltrates, and m6A RNA Methylation Regulators in Esophageal Squamous Cell Carcinoma.Front Immunol. 2021 May 12;12:669750. doi: 10.3389/fimmu.2021.669750. eCollection 2021. Front Immunol. 2021. PMID: 34054840 Free PMC article.
-
Profiles of immune cell infiltration and immune-related genes in the tumor microenvironment of esophageal squamous cell carcinoma.BMC Med Genomics. 2021 Mar 10;14(1):75. doi: 10.1186/s12920-021-00928-9. BMC Med Genomics. 2021. PMID: 33691689 Free PMC article.
-
Identification and characterization of prognosis-related genes in the tumor microenvironment of esophageal squamous cell carcinoma.Int Immunopharmacol. 2021 Jul;96:107616. doi: 10.1016/j.intimp.2021.107616. Epub 2021 May 28. Int Immunopharmacol. 2021. PMID: 34162127
-
Tumor associated macrophages in esophageal squamous carcinoma: Promising therapeutic implications.Biomed Pharmacother. 2023 Nov;167:115610. doi: 10.1016/j.biopha.2023.115610. Epub 2023 Sep 30. Biomed Pharmacother. 2023. PMID: 37783153 Review.
-
Early development of esophageal squamous cell cancer: Stem cells, cellular origins and early clone evolution.Cancer Lett. 2023 Feb 28;555:216047. doi: 10.1016/j.canlet.2022.216047. Epub 2022 Dec 30. Cancer Lett. 2023. PMID: 36587837 Review.
Cited by
-
Complete Remission of Vulvar Squamous Cell Carcinoma After Volumetric Modulated Arc Therapy in Copper Smelting and Purification Workers: A Case Report.Clin Cosmet Investig Dermatol. 2023 Jan 20;16:185-192. doi: 10.2147/CCID.S398275. eCollection 2023. Clin Cosmet Investig Dermatol. 2023. PMID: 36711071 Free PMC article.
-
Development and Validation of the Oxidative Stress Related lncRNAs for Prognosis in Esophageal Squamous Cell Carcinoma.Cancers (Basel). 2023 Sep 2;15(17):4399. doi: 10.3390/cancers15174399. Cancers (Basel). 2023. PMID: 37686677 Free PMC article.
-
A prognosis model for predicting immunotherapy response of esophageal cancer based on oxidative stress-related signatures.Oncol Res. 2023 Nov 15;32(1):199-212. doi: 10.32604/or.2023.030969. eCollection 2023. Oncol Res. 2023. PMID: 38196829 Free PMC article.
-
A novel computational model ITHCS for enhanced prognostic risk stratification in ESCC by correcting for intratumor heterogeneity.Brief Bioinform. 2024 Nov 22;26(1):bbae631. doi: 10.1093/bib/bbae631. Brief Bioinform. 2024. PMID: 39690882 Free PMC article.
References
MeSH terms
Substances
Grants and funding
- 2019A1515011329/Natural Science Foundation of Guangdong Province
- 2019A1515011329/Natural Science Foundation of Guangdong Province
- 2019A1515011329/Natural Science Foundation of Guangdong Province
- 2019A1515011329/Natural Science Foundation of Guangdong Province
- 2019A1515011329/Natural Science Foundation of Guangdong Province
LinkOut - more resources
Full Text Sources
Other Literature Sources
Medical
Research Materials
Miscellaneous
