. 2022 Sep 30;12(1):162.
doi: 10.1186/s13578-022-00897-1.

A change of PD-1/PD-L1 expression on peripheral T cell subsets correlates with the different stages of Alzheimer's Disease

Affiliations

A change of PD-1/PD-L1 expression on peripheral T cell subsets correlates with the different stages of Alzheimer's Disease

Ching-Tse Wu et al. Cell Biosci. .

Abstract

Background: Immune checkpoints are a set of costimulatory and inhibitory molecules that maintain self-tolerance and regulate immune homeostasis. The expression of immune checkpoints on T cells in malignancy, chronic inflammation, and neurodegenerative diseases has gained increasing attention.

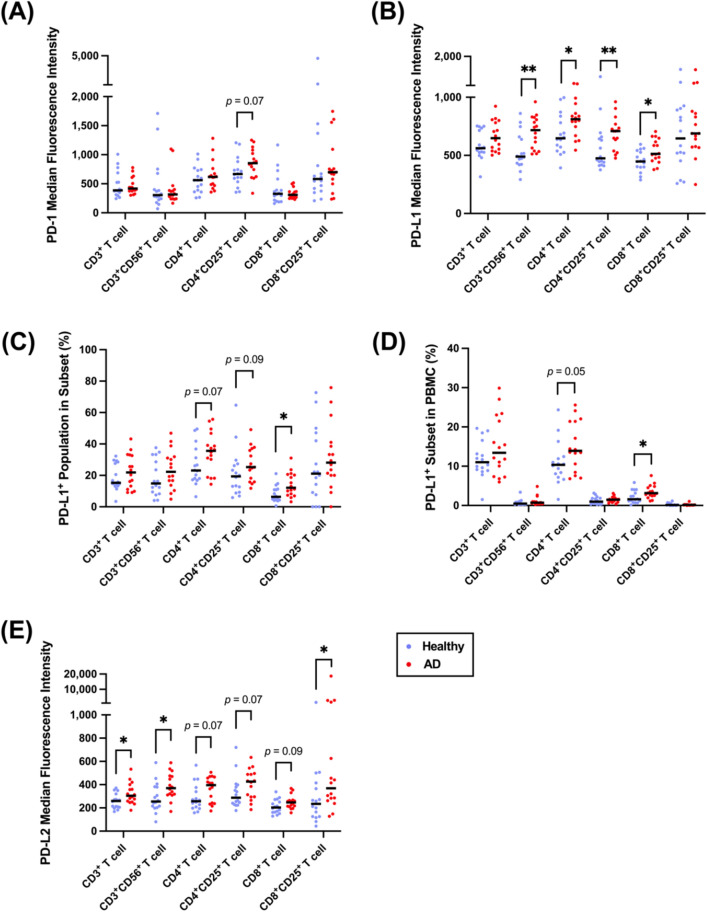
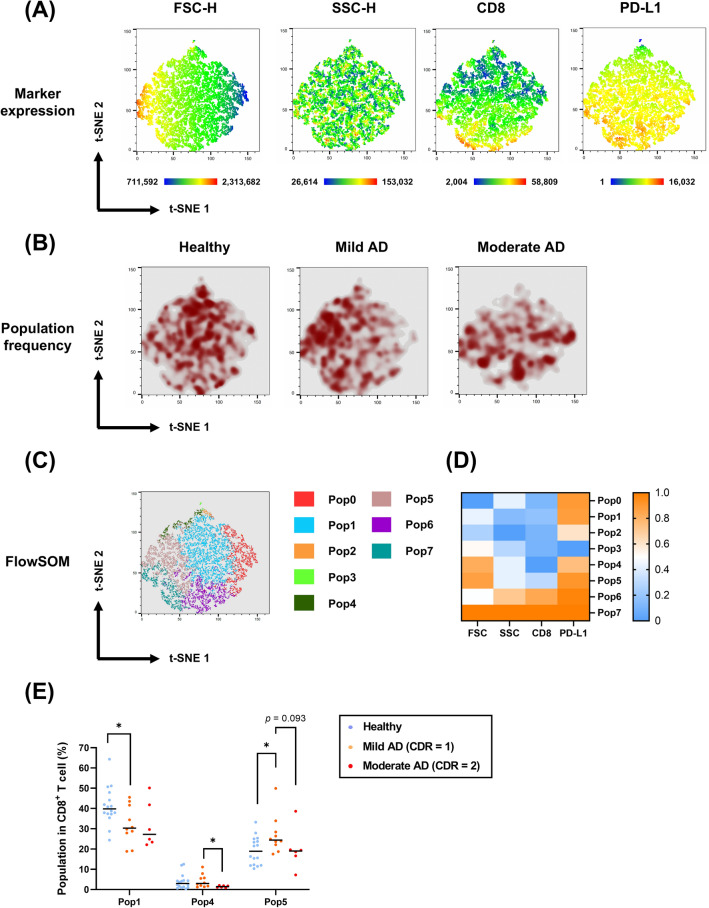
Results: To characterize immune checkpoints in neurodegenerative diseases, we aimed to examine the expression of the immune checkpoint PD-1/PD-L1 in peripheral T cells in different Alzheimer's disease (AD) patients. To achieve this aim, sixteen AD patients and sixteen age-matched healthy volunteers were enrolled to analyze their CD3+ T cells, CD3+CD56+ (neural cell adhesion molecule, NCAM) T cells, CD4+/CD8+ T cells, and CD4+/CD8+CD25+ (interleukin-2 receptor alpha, IL-2RA) T cells in this study. The expression of PD-1 on T cells was similar between the AD patients and healthy volunteers, but increased expression of PD-L1 on CD3+CD56+ T cells (natural killer T cells, NKT-like), CD4+ T cells (helper T cells, Th), CD4+CD25+ T cells, and CD8+ T cells (cytotoxic T lymphocytes, CTL) was detected in the AD patients. In addition, we found negative correlations between the AD patients' cognitive performance and both CD8+ T cells and CD8+CD25+ T cells. To identify CD8+ T-cell phenotypic and functional characteristic differences between the healthy volunteers and AD patients in different stages, a machine learning algorithm, t-distributed stochastic neighbor embedding (t-SNE), was implemented. Using t-SNE enabled the above high-dimensional data to be visualized and better analyzed. The t-SNE analysis demonstrated that the cellular sizes and densities of PD-1/PD-L1 on CD8+ T cells differed among the healthy, mild AD, and moderate AD subjects.

Conclusions: Our results suggest that changes in PD-1/PD-L1-expressing T cells in AD patients' peripheral blood could be a potential biomarker for monitoring disease and shed light on the AD disease mechanism. Moreover, these findings indicate that PD-1/PD-L1 blockade treatment could be a novel choice to slow AD disease deterioration.

Keywords: Alzheimer’s disease; Cognitive impairment; Immune checkpoint; Immunotherapy; PD-1, PD-L1.


Conflict of interest statement

The authors declare that the research was conducted without any commercial relationships that could be construed as potential conflicts of interest.

Figures

Fig. 1
Fig. 1
Single-cell-based staining as an indicator in the AD immune status analysis. A Experimental and analytical workflow from obtaining PBMCs to the flow cytometric data analysis. Whole blood was collected from 16 healthy volunteers and 16 age-matched AD patients. After purification, PBMCs were bound with antibodies against surface markers and PD-1/PD-L1 before the flow cytometric analysis. The raw data obtained from flow cytometry were compensated to correct the fluorescence spillover, and T-cell subsets were gated by cell surface markers. B Gating strategy for different T-cell subsets. Doublet cells were first excluded by the forward scatter height (FSC-H) versus FSC-A density plot. The lymphocyte population was gated by the FSC-H versus side scatter height (SSC-H) plot (indicated by a blue circle), and then, the T-cell subsets were gated by surface markers (CD3, CD4, CD8, and CD56). C Comparison of T-cell subset proportions between healthy volunteers and AD patients
Fig. 2
Fig. 2
Elevated PD-L1 was observed in AD CD8+ T cells and other T-cell subsets. A, B The median fluorescence intensity of PD-1 and PD-L1 expressed on T-cell subsets in healthy volunteers and AD patients. C, D The percentage of the PD-L1+ population in its subset and PBMCs, respectively, in healthy volunteers and AD patients. E The median fluorescence intensity of PD-L2 expressed on T-cell subsets in healthy volunteers and AD patients. A Mann‒Whitney U test was used to compare the healthy volunteers (n = 16) and AD patients (n = 16); median values are indicated by thick black lines in the scatter plots. *p < 0.05, **p < 0.01
Fig. 3
Fig. 3
Upregulation of the T-cell PD-L1 immune checkpoint status was detected in the moderate stage of AD. A Comparison of T-cell subset proportions among healthy volunteers, mild AD patients, and moderate AD patients. B Comparison of CD8+CD25+ T-cell population among healthy volunteers, mild AD patients, and moderate AD patients. C The median fluorescence intensity of PD-L1 expressed on T-cell subsets in healthy volunteers, mild AD patients, and moderate AD patients. D, E The percentage of the PD-L1+ population in its subset and PBMCs in healthy volunteers, mild AD patients, and moderate AD patients. A Mann‒Whitney U test was used to compare healthy volunteers (n = 16), mild AD patients (n = 10), and moderate AD patients (n = 6); median values are indicated by thick black lines in the scatter plots. *p < 0.05, **p < 0.01
Fig. 4
Fig. 4
Cognitive and functional declines were associated with diminished CD8+ T-cells and status changes in CD25 (IL-2RA) and PD-1. A Following the flow cytometric analysis, the PD-1+/PD-L1+ T-cell subset amounts were correlated with MMSE-minus and CDR-SOB to investigate the relationship between the immune status and disease progression. B Pearson correlation between CDR-SOB and MMSE/MMSE-minus (Pearson correlation coefficient r = − 0.555, p = 0.026 and r = 0.841, p = 0.000045). CE Pearson correlation between CD8+ T-cell percentage and CDR-SOB (r = − 0.509, p = 0.044), between CD8+CD25+ T-cell percentage and MMSE-minus (r = − 0.588, p = 0.016), and between PD-1+CD8+ T-cell percentage and CDR-SOB (r = − 0.600, p = 0.014)
Fig. 5
Fig. 5
t-SNE analysis of the CD8+ T-cell subset with PD-1. A t-SNE maps of all subjects demonstrating the numerical values of FSC-H, SSC-H, CD8, and PD-1 expression levels. B Pseudocolor smooth density plots displaying the change in the CD8+ T-cell population frequency with a selected marker, PD-1, among healthy volunteers, mild AD patients, and moderate AD patients. C Eight populations on the t-SNE map were clustered by the FlowSOM algorithm. D The heatmap demonstrates the frequency of each population with different markers (FSC, SSC, CD8, and PD-1). E Populations 3 and 7 in CD8+ T cells among healthy volunteers, mild AD patients, and moderate AD patients are shown in the scatter plots. A Mann‒Whitney U test was used to compare healthy volunteers (n = 16), mild AD patients (n = 10), and moderate AD patients (n = 6); median values are indicated by thick black lines in the scatter plots. *p < 0.05
Fig. 6
Fig. 6
t-SNE analysis of the CD8+ T-cell subset with PD-L1. A t-SNE maps of all subjects demonstrating the numerical values of FSC-H, SSC-H, CD8, and PD-L1 expression levels. B Pseudocolor smooth density plots displaying the change in the CD8+ T-cell population frequency with a selected marker, PD-L1, among healthy volunteers, mild AD patients, and moderate AD patients. C Eight populations on the t-SNE map were clustered by the FlowSOM algorithm. D The heatmap demonstrates the frequency of each population with different markers (FSC, SSC, CD8, and PD-L1). E Populations 1, 4, and 5 in CD8+ T cells among healthy volunteers, mild AD patients, and moderate AD patients are shown in the scatter plots. A Mann‒Whitney U test was used to compare healthy volunteers (n = 16), mild AD patients (n = 10), and moderate AD patients (n = 6); median values are indicated by thick black lines in the scatter plots. *p < 0.05

Similar articles

Cited by

References

    1. White MR, Kandel R, Tripathi S, Condon D, Qi L, Taubenberger J, et al. Alzheimer's associated beta-amyloid protein inhibits influenza A virus and modulates viral interactions with phagocytes. PLoS ONE. 2014;9(7):e101364. doi: 10.1371/journal.pone.0101364. - DOI - PMC - PubMed
    1. Sochocka M, Koutsouraki ES, Gasiorowski K, Leszek J. Vascular oxidative stress and mitochondrial failure in the pathobiology of Alzheimer's disease: a new approach to therapy. CNS Neurol Disord Drug Targets. 2013;12(6):870–881. doi: 10.2174/18715273113129990072. - DOI - PubMed
    1. Lahiri DK, Maloney B. The, "LEARn" (Latent Early-life Associated Regulation) model integrates environmental risk factors and the developmental basis of Alzheimer's disease, and proposes remedial steps. Exp Gerontol. 2010;45(4):291–296. doi: 10.1016/j.exger.2010.01.001. - DOI - PMC - PubMed
    1. Buxbaum JD, Oishi M, Chen HI, Pinkas-Kramarski R, Jaffe EA, Gandy SE, et al. Cholinergic agonists and interleukin 1 regulate processing and secretion of the Alzheimer beta/A4 amyloid protein precursor. Proc Natl Acad Sci USA. 1992;89(21):10075–10078. doi: 10.1073/pnas.89.21.10075. - DOI - PMC - PubMed
    1. Griffin WS, Stanley LC, Ling C, White L, MacLeod V, Perrot LJ, et al. Brain interleukin 1 and S-100 immunoreactivity are elevated in Down syndrome and Alzheimer disease. Proc Natl Acad Sci USA. 1989;86(19):7611–7615. doi: 10.1073/pnas.86.19.7611. - DOI - PMC - PubMed