. 2023 Feb;180(4):459-478.
doi: 10.1111/bph.15963. Epub 2022 Nov 20.

Neutrophil β1 adrenoceptor blockade blunts stroke-associated neuroinflammation

Affiliations

Neutrophil β1 adrenoceptor blockade blunts stroke-associated neuroinflammation

Agustín Clemente-Moragón et al. Br J Pharmacol. 2023 Feb.

Abstract

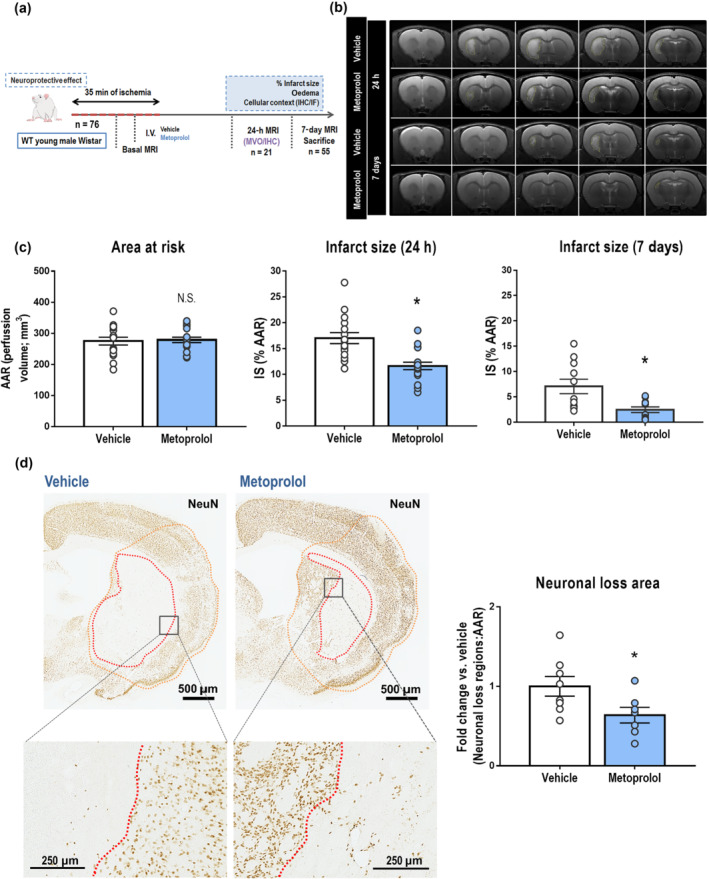
Background and purpose: Reperfusion therapy is the standard of care for ischaemic stroke; however, there is a need to identify new therapeutic targets able to ameliorate cerebral damage. Neutrophil β1 adrenoceptors (β1AR) have been linked to neutrophil migration during exacerbated inflammation. Given the central role of neutrophils in cerebral damage during stroke, we hypothesize that β1AR blockade will improve stroke outcomes.

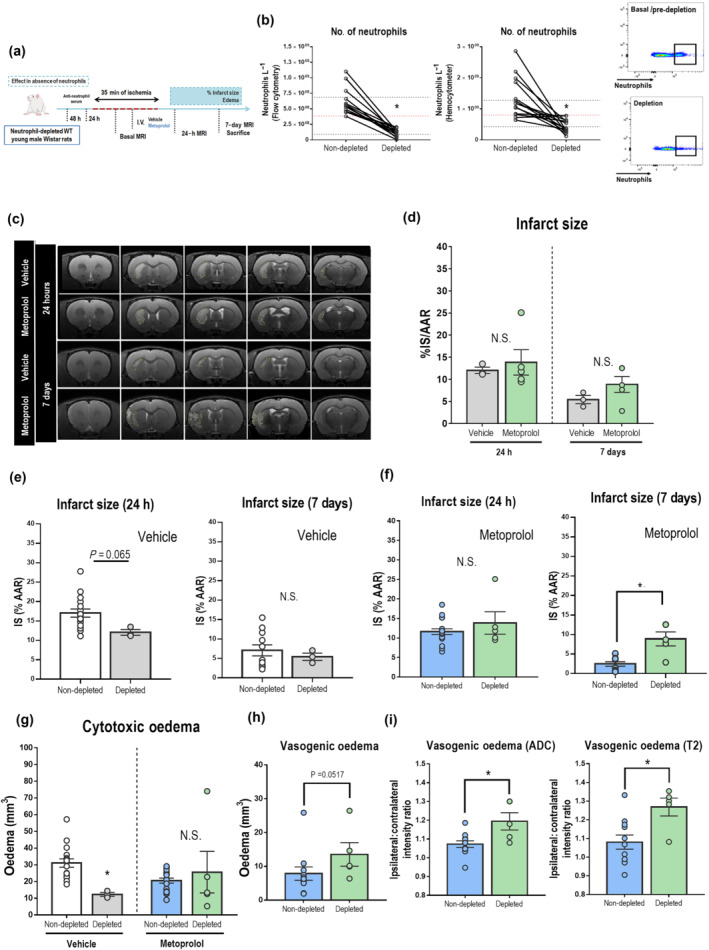
Experimental approach: Rats were subjected to middle cerebral artery occlusion-reperfusion to evaluate the effect on stroke of the selective β1AR blocker metoprolol (12.5 mg·kg-1 ) when injected i.v. 10 min before reperfusion.

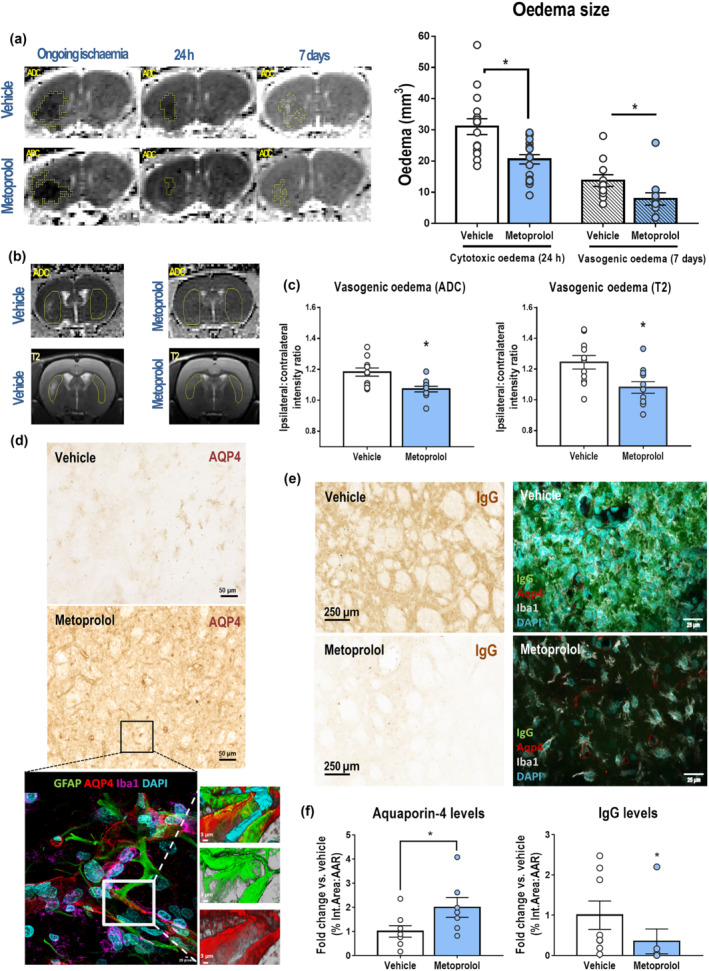
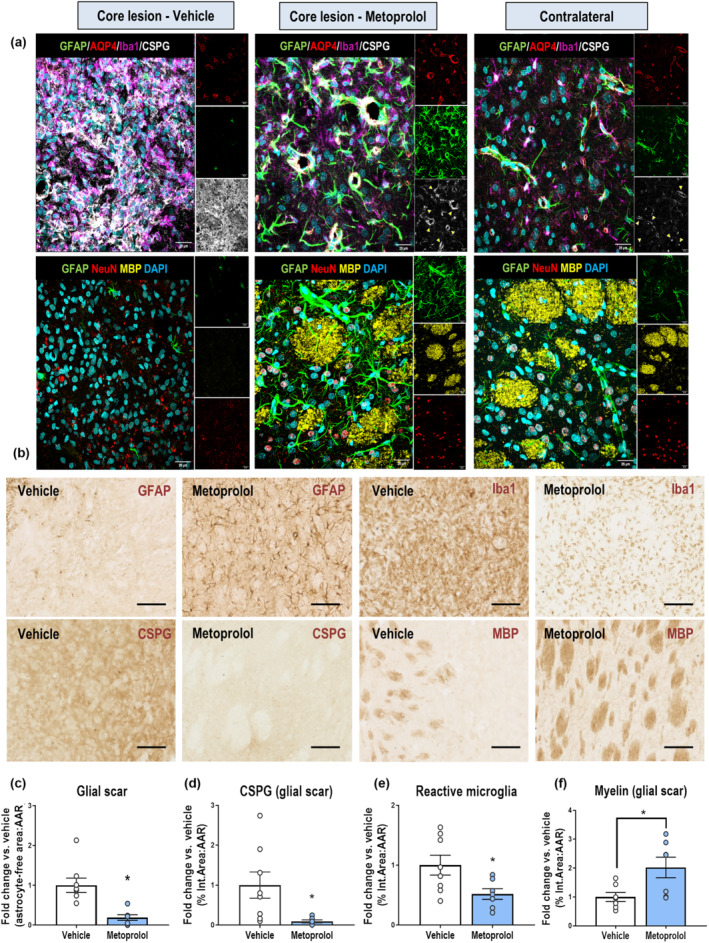
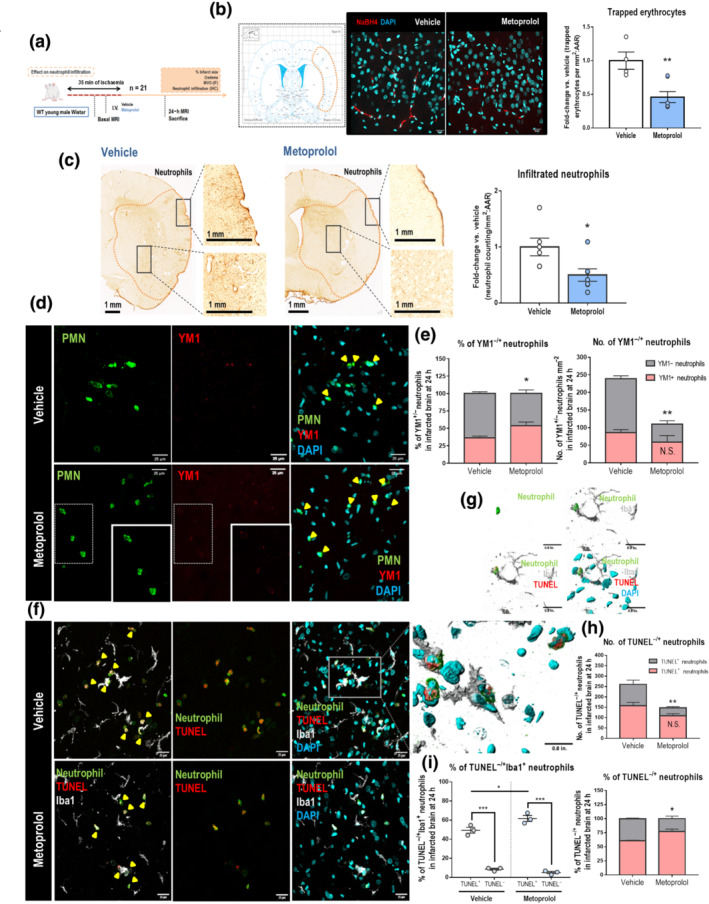
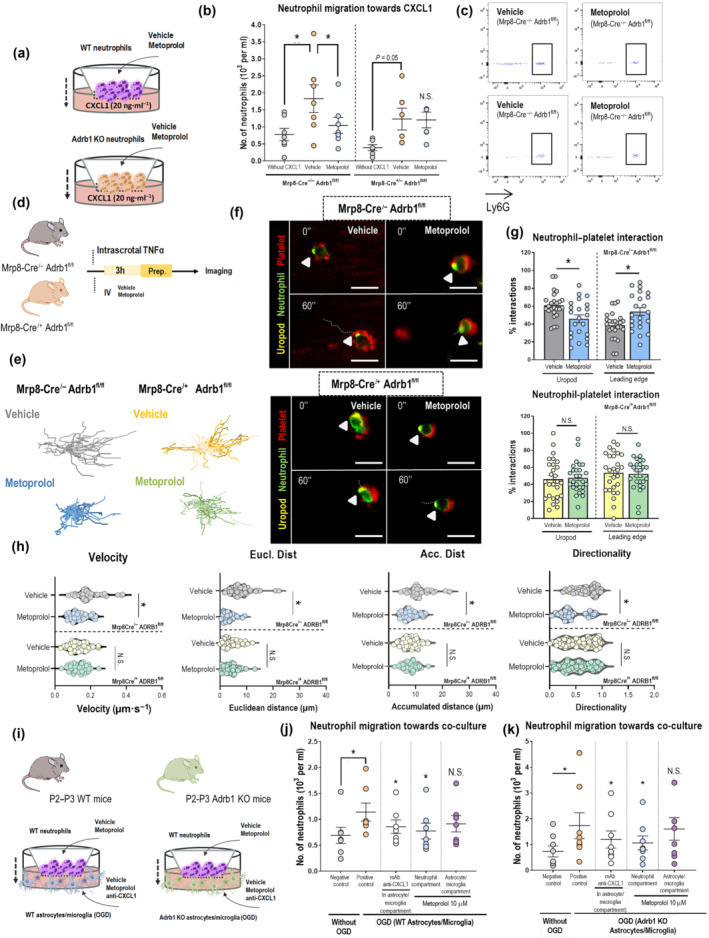
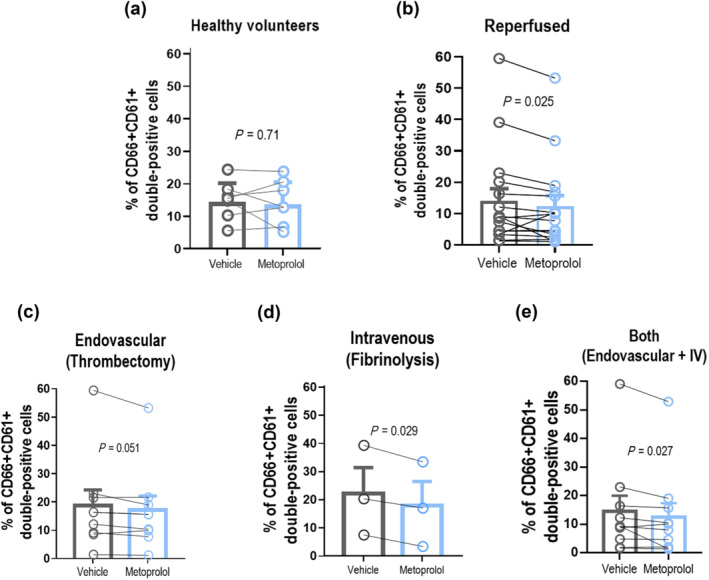
Key results: Magnetic resonance imaging and histopathology analysis showed that pre-reperfusion i.v. metoprolol reduced infarct size. This effect was accompanied by reduced cytotoxic oedema at 24 h and vasogenic oedema at 7 days. Metoprolol-treated rats showed reduced brain neutrophil infiltration and those which infiltrated displayed a high proportion of anti-inflammatory phenotype (N2, YM1+ ). Additional inflammatory models demonstrated that metoprolol specifically blocked neutrophil migration via β1AR and excluded a significant effect on the glia compartment. Consistently, metoprolol did not protect the brain in neutrophil-depleted rats upon stroke. In patients suffering an ischaemic stroke, β1AR blockade by metoprolol reduced circulating neutrophil-platelet co-aggregates.

Conclusions and implications: Our findings describe that β1AR blockade ameliorates cerebral damage by targeting neutrophils, identifying a novel therapeutic target to improve outcomes in patients with stroke. This therapeutic strategy is in the earliest stages of the translational pathway and should be further explored.

Keywords: Ischemic Stroke, Neutrophils, I/R, β1AR, Neuroinflammation.


Conflict of interest statement

Javier Sanchez‐Gonzalez is an employee of Philips Healthcare (Madrid, Spain). All other authors have declared no conflict of interest.

Figures

FIGURE 1
FIGURE 1
β1AR blockade by metoprolol reduces infarct size and neuronal loss. (a) Rat model of middle cerebral artery occlusion–reperfusion (MCAO/R), with euthanasia at 7 days post‐reperfusion. WT, wild‐type, MRI, magnetic resonance imaging, IF, immunofluorescence; IHC, immunohistochemistry; MVO, microvascular obstruction. (b) Comparative coronal T2‐weighted (T2W) MRI at 24 h (top rows) and 7 days (bottom rows) post‐reperfusion. Infarcted regions correspond to hyperintense areas. (c) Infarct size (IS) evaluated by coronal T2W MRI at 24 h (vehicle, n = 16; metoprolol, n = 18) and 7 days post‐reperfusion (vehicle, n = 11; metoprolol, n = 11). Final IS was calculated as the ratio of infarct volume to the area‐at‐risk (AAR) and expressed as %. (d) IHC of coronal sections with anti‐NeuN antibody. Higher magnifications of infarcted areas show territories of complete neuronal loss (delineated in red). Neuronal loss analysis in the middle cerebral artery territory (MCA, delineated in orange) of infarcted hemispheres shows neuronal preservation in metoprolol‐treated rats at 7 days post‐reperfusion (vehicle, n = 8; metoprolol, n = 7). Graphs show mean ± S.E.M. *P < 0.05
FIGURE 2
FIGURE 2
β1AR blockade by metoprolol reduces cerebral oedema and preserves the blood–brain barrier (BBB). (a) Coronal parametric MRI apparent diffusion coefficient (ADC) maps comparing rats receiving i.v. vehicle (top row) or metoprolol (bottom row) during ongoing ischaemia and 24 h and 7 days post‐reperfusion. Restricted diffusion was identified at 24 h as hypointense areas and increased diffusion at 7 days as hyperintense areas (outlined in yellow). Metoprolol reduces cytotoxic oedema at 24 h post‐reperfusion (vehicle, n = 16; metoprolol, n = 18) and vasogenic oedema at 7 days post‐reperfusion (vehicle, n = 11; metoprolol, n = 11). (b) Tissue water content analysed by comparison of ipsilateral (with infarct) and contralateral (without infarct) intensities in similar‐sized areas (yellow outlines), in a single slice per rat on ADC maps and T2W MRI. (c) Quantification of ipsilateral‐to‐contralateral intensity ratios from ADC maps and T2W images, showing reduced brain water content in metoprolol‐treated rats. (d) IHC of coronal sections at 7 days post‐reperfusion with anti‐aquaporin 4 (AQP4) antibody. The bottom panel shows representative triple GFAP+AQ4+Iba1+ immunofluorescence, illustrating AQP4 preservation (red) in astrocyte (GFAP; green) end‐feet and consequent preservation of BBB integrity. Microglia/macrophages (Iba1; purple) were found around vessels. Nuclei were revealed with DAPI (blue). (e) IHC of coronal sections at 7 days post‐reperfusion with anti‐immunoglobulin G (IgG) antibody (left panels). The right panels shows representative triple IgG+AQ4+Iba1+ immunofluorescence, illustrating IgG extravasation (green) in the absence of AQP4 (red). Microglia/macrophages (Iba1; grey) were found more reactive in the core lesion of vehicle‐treated rats and nuclei were revealed with DAPI (blue). (f) Quantification of AQP4 and IgG IHC in the MCA of infarcted hemispheres shows preservation of BBB integrity at 7 days post‐reperfusion in rats receiving i.v. metoprolol (vehicle, n = 8; metoprolol, n = 7). Graphs show mean ± S.E.M. *P < 0.05. Other abbreviations as in Figure 1
FIGURE 3
FIGURE 3
β1AR blockade by metoprolol prevents microglia/macrophage response and reduces subacute glial scar formation. (a) Single and merged channels of quadruple GFAP+AQP4+Iba1+CSPG+ (top row) and triple GFAP+MBP+NeuN (bottom row) IF. The quadruple IF shows glial scar formation (GFAP; green), proteoglycan deposition (CSPG; grey), microglia/macrophage response (Iba1; purple), and BBB disruption (AQP4; red) in a vehicle‐treated rat (left panels), contrasting the absence of glial scar in a metoprolol‐treated rat (central panels). Yellow arrowheads show a suggesting neural/glial antigen 2 expression by CSPG+ perivascular pericytes. The triple IF shows representative degeneration of neurons (NeuN; red) and the myelin sheath (MBP; yellow) in a vehicle‐treated rat (left panels) and their preservation in a metoprolol‐treated rat (central panels), where the lesion resembles the contralateral hemisphere (right panels) except for the astrocyte hypertrophy (GFAP; green). Nuclei were revealed with DAPI (blue). (b) Representative IHC (vehicle, left panels; metoprolol, right panels) of GFAP (glial fibrillary acidic protein), CSPGs (chondroitin sulfate proteoglycans), Iba1 (ionized calcium‐binding adapter molecule 1) and myelin basic protein (MBP) on coronal sections at 7 days post‐reperfusion, showing a reduction in glial scar formation (c), proteoglycans deposition (d), reactive microglia response and myelin sheath deterioration in metoprolol‐treated rats. Graphs show mean ± S.E.M. *P < 0.05. n = 6–8 rats per group. Other abbreviations as in Figure 1
FIGURE 4
FIGURE 4
Metoprolol reduces MVO and neutrophil infiltration into brain parenchyma via β1AR. (a) Rat model of MCAO/R. Rats were killed at 24 h post‐reperfusion. (b) Representative confocal imaging of NaBH4‐treated tissues, showing trapped erythrocytes (red) in penumbra areas of rats receiving pre‐reperfusion vehicle (left) or metoprolol (right). Penumbra areas correspond to the orange‐bordered brain cortex region in the rat brain atlas. Nuclei were revealed with DAPI (blue). The relative numbers of trapped erythrocytes mm−2 in penumbra areas show reduced MVO in metoprolol‐treated rats. (c) Representative anti‐neutrophil IHC on coronal sections at 24 h post‐reperfusion. Quantification of neutrophil infiltration shows lower numbers of neutrophils mm−2 in brain parenchyma of metoprolol‐treated rats at 24 h post‐reperfusion (vehicle, n = 5; metoprolol, n = 7). (d) Evaluation of infiltrated neutrophils in brain (green) expressing YM1 (Chitinase 3‐like 3 protein, red) by IF at 24 h post‐reperfusion in vehicle‐ (top row) and metoprolol‐treated rats (bottom row). Nuclei were revealed with DAPI (blue). (e) The number of YM1 neutrophils mm−2, but not of YM1+, is significantly reduced by metoprolol and, as a consequence, the % of alternative neutrophils (N2, YM1+) was then higher in brain parenchyma. (f) Evaluation by IF of apoptotic (TUNEL+, red) neutrophils (green) in brain being engulfed by microglia (Iba1, grey) at 24 h post‐reperfusion in vehicle‐ (top row) and metoprolol‐treated rats (bottom row). Nuclei were revealed with DAPI (blue). (g) 3D reconstructions of confocal images show how neutrophils undergoing apoptosis are preferably phagocytized by microglia. (h) % of apoptotic neutrophils was increased in brain parenchyma, as the number of TUNEL neutrophils mm−2, but not of TUNEL+, was significantly reduced by metoprolol. (i) Apoptotic neutrophils were preferentially engulfed by microglia. n = 3 rats per group. Graphs show mean ± S.E.M. *P < 0.05. Other abbreviations as in Figure 1
FIGURE 5
FIGURE 5
β1AR blockade by metoprolol blunts pro‐inflammatory neutrophils and favours an anti‐inflammatory environment in brain. (a) Experimental scheme for CXCL1‐induced transwell migration analysis. (b) Limiting effect of metoprolol on chemokine‐induced neutrophil migration in WT but not in conditional Adrb1 KO mice. (c) Flow cytometry plots illustrating reduced migration of neutrophils (Ly6G+ cells) upon treatment with metoprolol only in the presence of β1AR. Each independent experiment was conducted with leukocytes pooled from five to six animals, and each condition was run with two technical replicates (n = 8 for WT; n = 7 for Adrb1 KO). (d) Experimental scheme for 2D intravital microscopy. (e) Representative tracks of crawling neutrophils within inflamed vessels. (f) Representative time‐lapse images of platelets (CD41+ cells, red) with the polarized neutrophil uropod (CD62L+ domain, yellow) or leading edge (Ly6G+ domain, green). Arrowheads indicate interactions with the uropod domain, and dotted lines indicate displacement of the neutrophil over 60 s. (g) Percentage of platelet interactions with the neutrophil uropod or leading edge; n = 22–25 cells from three mice per condition. (h) 2D intravascular motility parameters: velocity (μm·s−1), accumulated and Euclidean distance (μm), and directionality; n = 35–54 cells from three mice per condition. WT mice: Mrp8‐Cre/− Adrb1fl/fl; neutrophil specific Adrb1 KO mice: Mrp8‐Cre/+ Adrb1fl/fl. (i) Experimental schemes of neutrophil migration towards WT (n = 7 per condition) or Adrb1 KO (n = 8 per condition) glia‐based co‐cultures. (j, k) The limiting effect of metoprolol on neutrophil migration was directly exerted on these cells, as it did not alter astrocyte/microglia chemoattractant properties. Graphs show mean ± S.E.M. *P < 0.05. Other abbreviations as in Figure 1
FIGURE 6
FIGURE 6
The neuroprotective effect of β1AR blockade by metoprolol is abolished in neutrophil‐depleted rats. (a) Rat model of neutrophil depletion before stroke induction by MCAO/R. Rats were killed at 7 days post‐reperfusion. (b) Depletion of circulating neutrophils with anti‐PMN serum assessed by flow cytometry and haemocytometry. Upper and lower dotted black lines represent peripheral blood neutrophil counting means (baseline and after depletion). Red dotted lines represent minimal neutrophil threshold of depletion. Flow cytometry plots illustrate the reduction in peripheral blood neutrophils after depletion. The black square outlines the anti‐neutrophil+ population. (c) Comparative coronal T2W MRI at 24 h (top rows) and 7 days (bottom rows) post‐reperfusion. Infarcted regions correspond to hyperintense areas. (d) IS evaluated by coronal T2W MRI at 24 h and 7 days post‐reperfusion. Final IS was calculated as the ratio of infarct volume to the AAR and expressed as %. (e) Neutrophil‐depletion was associated with smaller IS at 24 h but not at 7 days post‐reperfusion. (f) Metoprolol treatment in the absence of neutrophils did not provide any additional benefit at 24 h (f, g); however, its effect is completely abolished at 7 days post‐reperfusion, as determined by IS and oedema quantification (h, i). Non‐depleted vehicle, n = 16; non‐depleted metoprolol, n = 18; depleted vehicle, n = 3; depleted metoprolol, n = 5. Graphs show mean ± S.E.M. *P < 0.05. Abbreviations as in Figure 1.
FIGURE 7
FIGURE 7
β1AR blockade blocks neutrophil–platelet aggregates in ischaemic stroke patients. (a, b) Platelet (CD61+ cells) and neutrophils (CD45+/CD66+ cells) were detected by flow cytometry, and neutrophils positive for CD61 staining were identified as neutrophil–platelet co‐aggregates. Neutrophil–platelet interactions were inhibited by metoprolol in ischaemic stroke patients who received reperfusion therapy (therapy, n = 16; non‐therapy, n = 8). These interactions were also determined in healthy volunteers (n = 7), who did not respond to metoprolol treatment. A subanalysis was performed based on reperfusion therapy (endovascular thrombectomy, n = 9; fibrinolysis, n = 3; or both, n = 10). Likewise, metoprolol limited co‐aggregates in all groups of treatment (c–e). Graphs show mean ± S.E.M. *P < 0.05

References

    1. Abdullahi, W. , Tripathi, D. , & Ronaldson, P. T. (2018). Blood‐brain barrier dysfunction in ischemic stroke: Targeting tight junctions and transporters for vascular protection. American Journal of Physiology Cell Physiology, 315(3), C343–C356. 10.1152/ajpcell.00095.2018 - DOI - PMC - PubMed
    1. Ajmo, C. T. Jr. , Collier, L. A. , Leonardo, C. C. , Hall, A. A. , Green, S. M. , Womble, T. A. , Cuevas, J. , Willing, A. E. , & Pennypacker, K. R. (2009). Blockade of adrenoreceptors inhibits the splenic response to stroke. Experimental Neurology, 218(1), 47–55. 10.1016/j.expneurol.2009.03.044 - DOI - PMC - PubMed
    1. Alexander, S. P. , Christopoulos, A. , Davenport, A. P. , Kelly, E. , Mathie, A. , Peters, J. A. , Veale, E. L. , Armstrong, J. F. , Faccenda, E. , Harding, S. D. , Pawson, A. J. , Southan, C. , Davies, J. A. , Abbracchio, M. P. , Alexander, W. , Al‐Hosaini, K. , Bäck, M. , Barnes, N. M. , Bathgate, R. , … Ye, R. D. (2021). The concise guide to pharmacology 2021/22: G protein‐coupled receptors. British Journal of Pharmacology, 178(Suppl 1), S27–S156. - PubMed
    1. Alexander, S. P. H. , Roberts, R. E. , Broughton, B. R. S. , Sobey, C. G. , George, C. H. , Stanford, S. C. , Cirino, G. , Docherty, J. R. , Giembycz, M. A. , Hoyer, D. , Insel, P. A. , Izzo, A. A. , Ji, Y. , MacEwan, D. J. , Mangum, J. , Wonnacott, S. , & Ahluwalia, A. (2018). Goals and practicalities of immunoblotting and immunohistochemistry: A guide for submission to the British Journal of Pharmacology. British Journal of Pharmacology, 175(3), 407–411. 10.1111/bph.14112 - DOI - PMC - PubMed
    1. Ballesteros, I. , Rubio‐Ponce, A. , Genua, M. , Lusito, E. , Kwok, I. , Fernandez‐Calvo, G. , Khoyratty, T. E. , van Grinsven, E. , González‐Hernández, S. , Nicolás‐Ávila, J. Á. , Vicanolo, T. , Maccataio, A. , Benguría, A. , Li, J. L. , Adrover, J. M. , Aroca‐Crevillen, A. , Quintana, J. A. , Martín‐Salamanca, S. , Mayo, F. , … Hidalgo, A. (2020). Co‐option of neutrophil fates by tissue environments. Cell, 183(5), 1282–1297e1218. 10.1016/j.cell.2020.10.003 - DOI - PubMed

Publication types