. 2023 Jan 2:323:198936.
doi: 10.1016/j.virusres.2022.198936. Epub 2022 Sep 28.

Evolution of SARS-CoV-2 during the first year of the COVID-19 pandemic in Northwestern Argentina

Affiliations

Evolution of SARS-CoV-2 during the first year of the COVID-19 pandemic in Northwestern Argentina

Romina Zambrana Montaño et al. Virus Res. .

Abstract

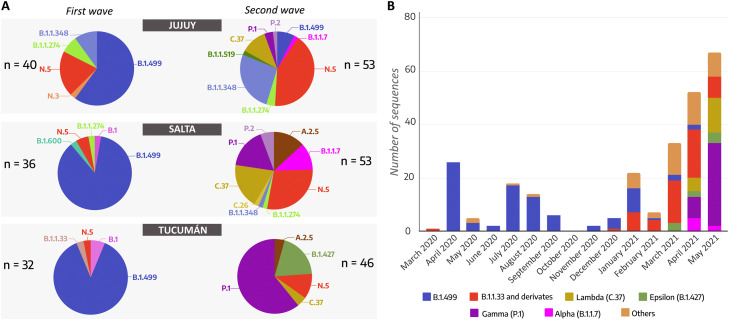
Studies about the evolution of SARS-CoV-2 lineages in different backgrounds such as naive populations are still scarce, especially from South America. This work aimed to study the introduction and diversification pattern of SARS-CoV-2 during the first year of the COVID-19 pandemic in the Northwestern Argentina (NWA) region and to analyze the evolutionary dynamics of the main lineages found. In this study, we analyzed a total of 260 SARS-CoV-2 whole-genome sequences from Argentina, belonging to the Provinces of Jujuy, Salta, and Tucumán, from March 31st, 2020, to May 22nd, 2021, which covered the full first wave and the early second wave of the COVID-19 pandemic in Argentina. In the first wave, eight lineages were identified: B.1.499 (76.9%), followed by N.5 (10.2%), B.1.1.274 (3.7%), B.1.1.348 (3.7%), B.1 (2.8%), B.1.600 (0.9%), B.1.1.33 (0.9%) and N.3 (0.9%). During the early second wave, the first-wave lineages were displaced by the introduction of variants of concern (VOC) (Alpha, Gamma), or variants of interest (VOI) (Lambda, Zeta, Epsilon) and other lineages with more limited distribution. Phylodynamic analyses of the B.1.499 and N.5, the two most prevalent lineages in the NWA, revealed that the rate of evolution of lineage N.5 (7.9 × 10⁻⁴ substitutions per site per year, s/s/y) was a ∼40% faster than that of lineage B.1.499 (5.6 × 10⁻⁴ s/s/y), although both are in the same order of magnitude than other non-VOC lineages. No mutations associated with a biological characteristic of importance were observed as signatures markers of the phylogenetic groups established in Northwestern Argentina, however, single sequences in non-VOC lineages did present mutations of biological importance or associated with VOCs as sporadic events, showing that many of these mutations could emerge from circulation in the general population. This study contributed to the knowledge about the evolution of SARS-CoV-2 in a pre-vaccination and without post-exposure immunization period.

Keywords: Argentina; COVID-19; First-wave lineages; Rate of evolution; SARS-CoV-2.


Conflict of interest statement

Declaration of Competing Interest The authors declare that the research was conducted in the absence of any commercial or financial relationships that could be construed as a potential conflict of interest.

Figures

Fig 1
Fig. 1
COVID-19 cases diagnosed in Northwest Argentina (NWA) between March 2020 and May 2021. (A) Schematic illustration of NWA and its geographic position in the South America map. (B) Daily distribution of SARS-CoV-2 cases for studied provinces: Jujuy, Salta and Tucumán. The intervals highlighted in yellow represent the sampling period corresponding to the sequences used in this study (n = 260). The insets show the daily cases for the first five months which had 30 or fewer daily positive cases.
Fig 2
Fig. 2
SARS-CoV-2 lineage distribution in Northwest Argentina during the first and second waves. (A) Pie charts showing and comparing the proportion of lineages that were detected in the Provinces of Jujuy, Salta, and Tucumán during the first wave and the early second wave in Argentina. (B) Temporal representation of SARS-CoV-2 sequences and PANGO lineages in Northwestern Argentina provinces between March 2020 and May 2021.
Fig 3
Fig. 3
Phylogenetic tree of SARS-CoV-2 whole-genome sequences of lineage B.1.499. Dataset included 204 sequences with a final alignment of 29785 sites. The tree was rooted between lineages A and B. Only groups with Northwestern Argentinean sequences are shown and indicated by orange arrows. The stars on the main tree indicate sporadic cases. The SH-aLRT/UFB values for the relevant groups are indicated. Branches and tips are coloured by province. The scale indicates the number of substitutions per site. The pink arrows indicate the context groups used to analyse the descriptive mutations of some clusters that are detailed in Table 2.
Fig 4
Fig. 4
Phylogenetic tree of SARS-CoV-2 whole-genome sequences of lineage N.5. Dataset included 270 sequences with a final alignment of 29,793 sites. The tree was rooted between lineages A and B. Only groups with Northwestern Argentinean sequences are shown and indicated by orange arrows. The green stars on the main tree indicate sporadic cases detected in the first wave and the yellow stars correspond to the second wave. The SH-aLRT/UFB values for the relevant groups are indicated. Branches and tips are coloured by province. The scale indicates the number of substitutions per site. The pink arrows indicate the context groups used to analyse the descriptive mutations of some clusters that are detailed in Table 2. The green panels (H - I) correspond to the first wave and the brown panels (A-J) to the early second wave.
Fig 5
Fig. 5
Phylogenetic tree of SARS-CoV-2 whole-genome sequences of Gamma (lineage P.1) and Zeta (lineage P.2). Dataset included 357 sequences with a final alignment of 29,818 sites. The tree was rooted between lineages A and B. Only groups with Northwestern Argentinean sequences are shown and indicated by orange arrows. The stars on the main tree indicate sporadic cases. The SH-aLRT/UFB values for the relevant groups are indicated. Branches and tips are coloured by province. The scale indicates the number of substitutions per site. The pink arrows indicate the context groups used to analyse the descriptive mutations of some clusters that are detailed in Table 2.
Fig 6
Fig. 6
Phylogenetic tree of SARS-CoV-2 whole-genome sequences of lineage B.1.1 and its descendants. Dataset included 204 sequences with a final alignment of 29,793 sites. The tree was rooted between lineage A and B. Only groups with Northwestern Argentinean sequences are shown and indicated by orange arrows. The yellow stars indicate sporadic cases. The SH-aLRT/UFB values for the relevant groups are indicated. Branches and tips are coloured by province. The scale indicates the number of substitutions per site. The pink arrows indicate the context groups used to analyse the descriptive mutations of some clusters that are detailed in Table 2.
Fig 7
Fig. 7
Phylogenetic tree of SARS-CoV-2 whole-genome sequences of Lambda (lineage C.37). Dataset included 195 sequences with a final alignment of 29,793 sites. The tree was rooted between lineages A and B. Only groups with Northwestern Argentinean sequences are shown and indicated by orange arrows. The yellow stars indicate sporadic cases. The SH-aLRT/UFB values for the relevant groups are indicated. Branches and tips are coloured by province. The scale indicates the number of substitutions per site. The pink arrows indicate the context groups used to analyse the descriptive mutations of clusters B and C, which are detailed in Table 2.
Fig 8
Fig. 8
Phylogenetic tree of SARS-CoV-2 whole-genome sequences of lineage B.1 and Epsilon (lineage B.1.427). Dataset included 151 sequences with a final alignment of 29,785 sites. The tree was rooted between lineages A and B. Only groups with Northwestern Argentinean sequences are shown and indicated by orange arrows. The yellow stars indicate sporadic cases. The SH-aLRT/UFB values for the relevant groups are indicated. Branches and tips are coloured by province. The scale indicates the number of substitutions per site. The pink arrow indicates the context group used to analyse the descriptive mutations of cluster A, which is detailed in Table 2.
Fig 9
Fig. 9
Phylogenetic tree of SARS-CoV-2 whole-genome sequences of lineage A.2.5. Dataset included 91 sequences with a final alignment of 29,803 sites. The tree was rooted between lineages A and B. Only groups with Northwestern Argentinean sequences are shown. The SH-aLRT/UFB values for the relevant groups are indicated. Branches and tips are coloured by province. The scale indicates the number of substitutions per site. The pink arrow indicates the context group used to analyse the descriptive mutations of cluster A, which is detailed in Table 2.
Fig 10
Fig. 10
Demographic reconstruction of lineages B.1.499 and N.5. Estimations of the effective number of infections (inferred from the effective population size multiplied by the generation time, Ne × τ) over time from both lineages are superimposed. Mean values are shown as tick lines and HPD95% values (upper and lower), as thin lines. Dashed lines represent the upper HP95% interval for the time to the most recent common ancestor estimated for each lineage (indicated with arrows). Datasets included 87 sequences for lineage B.1.499 and 53 for N.5, with alignments of 29,782 sites.
Fig 11
Fig. 11
Schematic representation of amino acid changes in the Spike region found in most relevant lineages found in this study: B.1.499, N.5, P.1 (VOC Gamma), C.37 (VOI Lambda), B.1.1.7 (VOC Alpha), indicating key regions: NTD: N-terminal domain; RBD: Receptor-binding domain; FP: Fusion peptide; HR1: Heptad repeat 1; HR2: Heptad repeat 2; TM: Transmembrane domain; CP: Cytoplasmic peptide. The mutations in black color correspond to the characteristic changes reported for the lineage and the mutations in red color to changes found for each lineage in this work. The number in parentheses indicates the number of sequences in which each mutation appeared.

References

    1. Aljindan R.Y., Al-Subaie A.M., Al-Ohali A.I., et al. Investigation of nonsynonymous mutations in the spike protein of SARS-CoV-2 and its interaction with the ACE2 receptor by molecular docking and MM/GBSA approach. Comput. Biol. Med. 2021;135 - PMC - PubMed
    1. Bertelli A., D'ursi P., Campisi G., et al. Role of Q675H mutation in improving SARS-CoV-2 spike interaction with the furin binding pocket. Viruses. 2021;13:1–17. - PMC - PubMed
    1. Dearlove B., Lewitus E., Bai H. et al. A SARS-CoV-2 vaccine candidate would likely match all currently circulating variants. 2020;117:23652–62. - PMC - PubMed
    1. Drummond A.J., Ho S.Y.W., Phillips M.J., et al. Relaxed phylogenetics and dating with confidence. PLoS Biol. 2006;4:699–710. - PMC - PubMed
    1. Faria N.R., Mellan T.A., Whittaker C., et al. Genomics and epidemiology of the P.1 SARS-CoV-2 lineage in Manaus, Brazil. Science. 2021;372:815–821. (80-) - PMC - PubMed

LinkOut - more resources