

Human Bone Typing Using Quantitative Cone-Beam Computed Tomography
- PMID: 36182605
- PMCID: PMC10023581
- DOI: 10.1016/j.identj.2022.08.011
Human Bone Typing Using Quantitative Cone-Beam Computed Tomography
Abstract
Introduction: Bone typing is crucial to enable the choice of a suitable implant, the surgical technique, and the evaluation of the clinical outcome. Currently, bone typing is assessed subjectively by the surgeon.
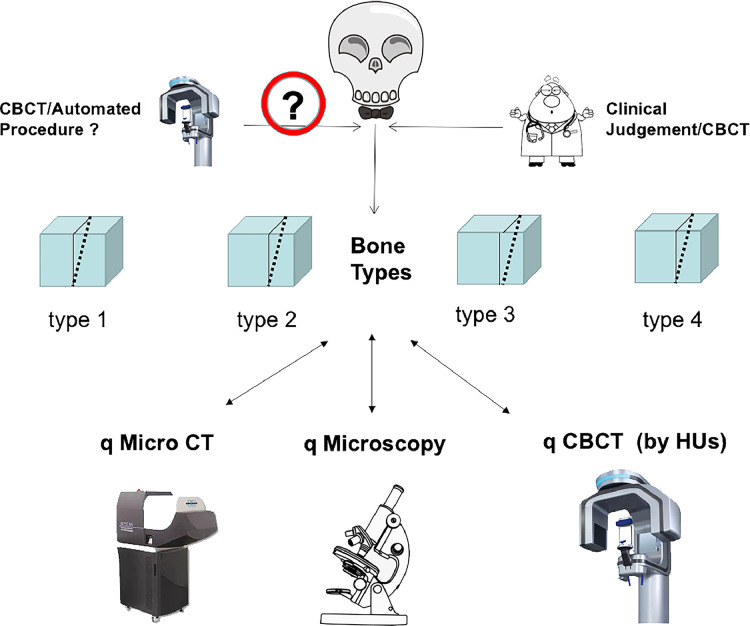
Objective: The aim of this study is to establish an automatic quantification method to determine local bone types by the use of cone-beam computed tomography (CBCT) for an observer-independent approach.
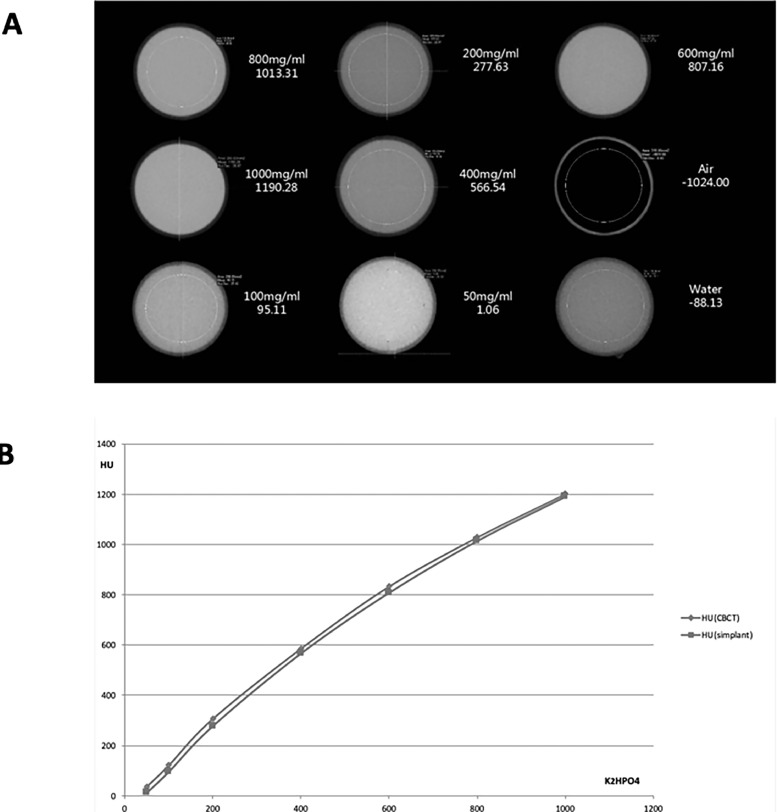
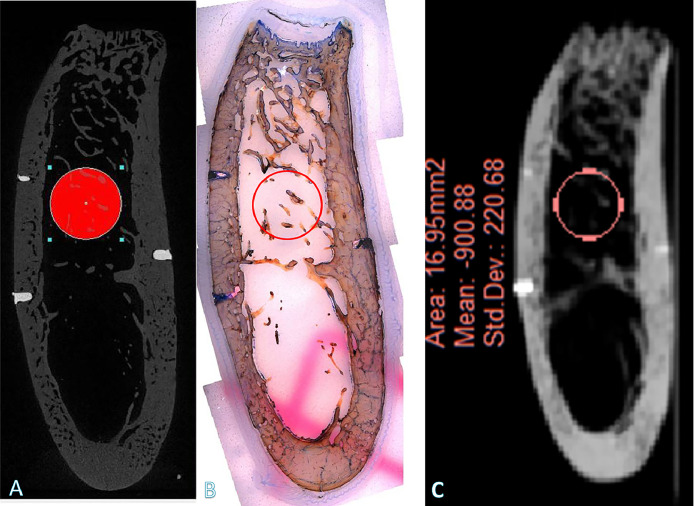
Methods: Six adult human cadaver skulls were used. The 4 generally used bone types in dental implantology and orthodontics were identified, and specific Hounsfield unit (HU) ranges (grey-scale values) were assigned to each bone type for identification by quantitative CBCT (qCBCT). The selected scanned planes were labelled by nonradiolucent markers for reidentification in the backup/cross-check evaluation methods. The selected planes were then physically removed as thick bone tissue sections for in vitro correlation measurements by qCBCT, quantitative micro-computed tomography (micro-CT), and quantitative histomorphometry.
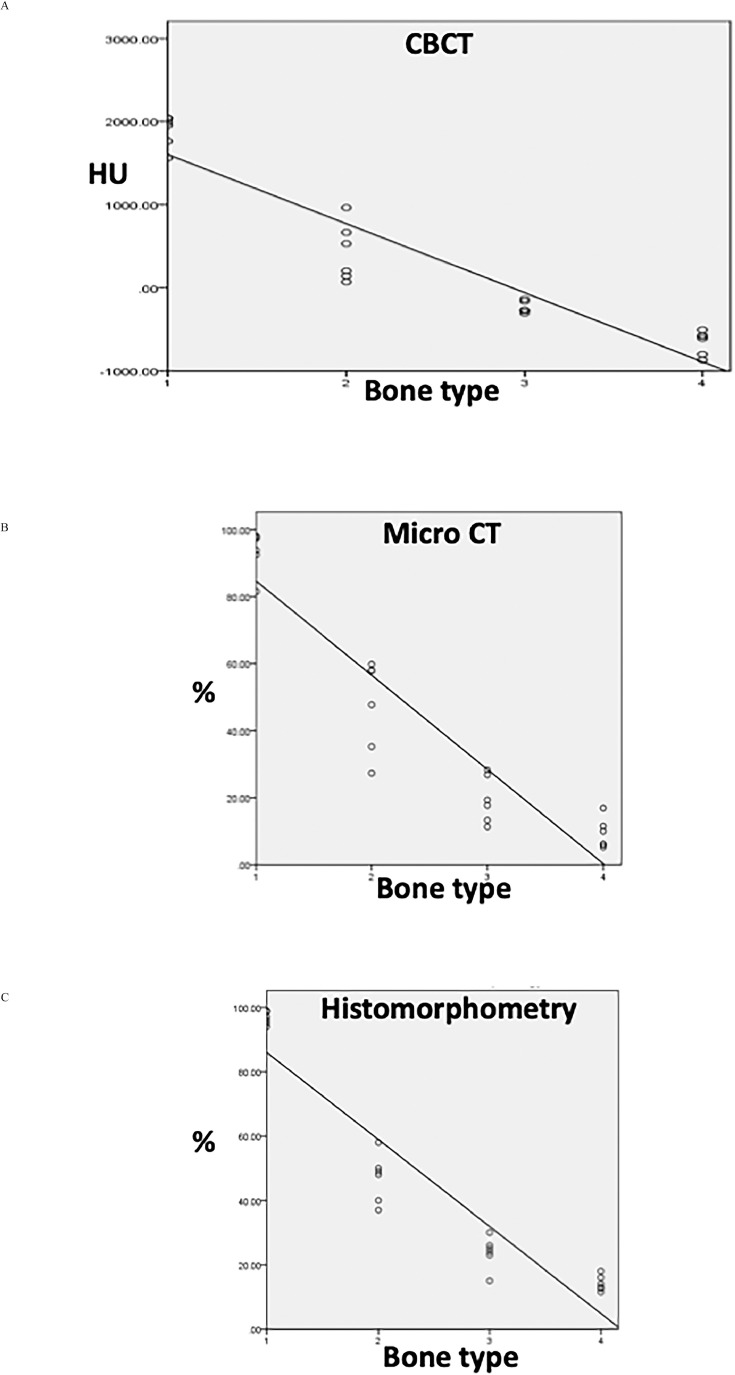
Results: Correlation analyses between the different bone tissue quantification methods to identify bone types based on numerical ranges of HU values revealed that the Pearson correlation coefficient of qCBCT with micro-CT and quantitative histomorphometry was R = 0.9 (P = .001) for all 4 bone types .
Conclusions: We found that qCBCT can reproducibly and objectively assess human bone types at implant sites.
Keywords: Bone types; CBCT; Dental implantology; Human; Quantification.
Copyright © 2022 The Authors. Published by Elsevier Inc. All rights reserved.
Conflict of interest statement
Conflict of interest None disclosed.
Figures
Similar articles
-
Bone quality evaluation at dental implant site using multislice CT, micro-CT, and cone beam CT.Clin Oral Implants Res. 2015;26(1):e1-7. doi: 10.1111/clr.12315. Epub 2013 Dec 11. Clin Oral Implants Res. 2015. PMID: 24325572
-
Bone density assessments of dental implant sites: 2. Quantitative cone-beam computerized tomography.Int J Oral Maxillofac Implants. 2005 May-Jun;20(3):416-24. Int J Oral Maxillofac Implants. 2005. PMID: 15973953
-
The reliability of cone-beam computed tomography to assess bone density at dental implant recipient sites: a histomorphometric analysis by micro-CT.Clin Oral Implants Res. 2013 Aug;24(8):871-9. doi: 10.1111/j.1600-0501.2011.02390.x. Epub 2012 Jan 17. Clin Oral Implants Res. 2013. PMID: 22250839
-
Accuracy and reliability of different cone beam computed tomography (CBCT) devices for structural analysis of alveolar bone in comparison with multislice CT and micro-CT.Eur J Oral Implantol. 2017;10(1):95-105. Eur J Oral Implantol. 2017. PMID: 28327698
-
CBCT-based bone quality assessment: are Hounsfield units applicable?Dentomaxillofac Radiol. 2015;44(1):20140238. doi: 10.1259/dmfr.20140238. Dentomaxillofac Radiol. 2015. PMID: 25315442 Free PMC article. Review.
Cited by
-
Transvenous embolization for an intraosseous clival arteriovenous fistula via a proper access route guiding a three-dimensional fusion image: illustrative case.J Neurosurg Case Lessons. 2023 Oct 30;6(18):CASE23492. doi: 10.3171/CASE23492. Print 2023 Oct 30. J Neurosurg Case Lessons. 2023. PMID: 37903421 Free PMC article.
-
Post-Extraction Bone Changes in Molars Within Personalized Implant-Prosthetic Therapy as Evaluated with Fractal Analysis of CBCT.J Pers Med. 2025 Apr 16;15(4):154. doi: 10.3390/jpm15040154. J Pers Med. 2025. PMID: 40278333 Free PMC article.
References
-
- Scherer MD. Presurgical implant-site assessment and restoratively driven digital planning. Dent Clin North Am. 2014;58:561–595. - PubMed
-
- Eckerdal O, Kvint S. Presurgical planning for osseointegrated implants in the maxilla. A tomographic evaluation of available alveolar bone and morphological relations in the maxilla. Int J Oral Maxillofac Surg. 1986;15:722–726. - PubMed
-
- Fredholm U, Bolin A, Andersson L. Preimplant radiographic assessment of available maxillary bone support. Comparison of tomographic and panoramic technique. Swed Dent J. 1993;17:103–109. - PubMed
