. 2022 Nov:85:104293.
doi: 10.1016/j.ebiom.2022.104293. Epub 2022 Sep 28.

Plasma proteomic signature predicts who will get persistent symptoms following SARS-CoV-2 infection

Affiliations

Plasma proteomic signature predicts who will get persistent symptoms following SARS-CoV-2 infection

Gabriella Captur et al. EBioMedicine. 2022 Nov.

Abstract

Background: The majority of those infected by ancestral Severe Acute Respiratory Syndrome Coronavirus 2 (SARS-CoV-2) during the UK first wave (starting March 2020) did not require hospitalisation. Most had a short-lived mild or asymptomatic infection, while others had symptoms that persisted for weeks or months. We hypothesized that the plasma proteome at the time of first infection would reflect differences in the inflammatory response that linked to symptom severity and duration.

Methods: We performed a nested longitudinal case-control study and targeted analysis of the plasma proteome of 156 healthcare workers (HCW) with and without lab confirmed SARS-CoV-2 infection. Targeted proteomic multiple-reaction monitoring analysis of 91 pre-selected proteins was undertaken in uninfected healthcare workers at baseline, and in infected healthcare workers serially, from 1 week prior to 6 weeks after their first confirmed SARS-CoV-2 infection. Symptom severity and antibody responses were also tracked. Questionnaires at 6 and 12 months collected data on persistent symptoms.

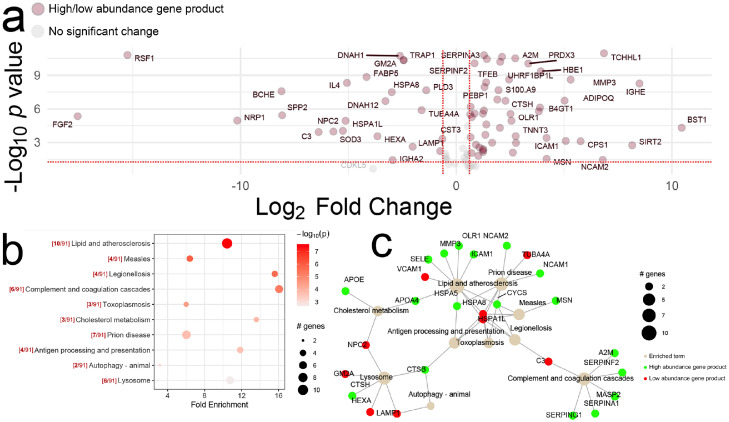
Findings: Within this cohort (median age 39 years, interquartile range 30-47 years), 54 healthcare workers (44% male) had PCR or antibody confirmed infection, with the remaining 102 (38% male) serving as uninfected controls. Following the first confirmed SARS-CoV-2 infection, perturbation of the plasma proteome persisted for up to 6 weeks, tracking symptom severity and antibody responses. Differentially abundant proteins were mostly coordinated around lipid, atherosclerosis and cholesterol metabolism pathways, complement and coagulation cascades, autophagy, and lysosomal function. The proteomic profile at the time of seroconversion associated with persistent symptoms out to 12 months. Data are available via ProteomeXchange with identifier PXD036590.

Interpretation: Our findings show that non-severe SARS-CoV-2 infection perturbs the plasma proteome for at least 6 weeks. The plasma proteomic signature at the time of seroconversion has the potential to identify which individuals are more likely to suffer from persistent symptoms related to SARS-CoV-2 infection.

Funding information: The COVIDsortium is supported by funding donated by individuals, charitable Trusts, and corporations including Goldman Sachs, Citadel and Citadel Securities, The Guy Foundation, GW Pharmaceuticals, Kusuma Trust, and Jagclif Charitable Trust, and enabled by Barts Charity with support from University College London Hospitals (UCLH) Charity. This work was additionally supported by the Translational Mass Spectrometry Research Group and the Biomedical Research Center (BRC) at Great Ormond Street Hospital.

Keywords: COVID-19; Post-acute sequelae of SARS-CoV-2 (PASC); Proteomics.


Conflict of interest statement

Declaration of interests RJB and DMA are members of the Global T cell Expert Consortium and have consulted for Oxford Immunotec outside the submitted work.

Figures

Figure 1
Figure 1
Study consort diagram. NIC, non-infected control; PCR, polymerase chain reaction; Sero+, seropositive.
Figure 2
Figure 2
Plasma proteome perturbation tracks symptom severity and lasts several weeks following SARS-CoV-2 infection. (a) MDP in plasma proteome for each individual expressed as the differences by number of standard deviations (Z scores) from the mean of uninfected HCW group, among samples from all uninfected HCW at baseline (n=102) and samples from PCR positive individuals at the time of their first positive PCR test result (n=29), the latter stratified according to symptom severity index. A symptom severity index per study member was calculated as the sum of reported symptoms following the first positive PCR test (no symptoms = 0, atypical symptoms = 1, case-defining symptoms = 2), divided by the total symptom duration in days. Violin plots depict median (black horizontal lines), IQR (red horizontal lines) and frequency distributions (FDR by pairwise Mann-Whitney tests with post hoc correction for each group compared to uninfected HCW, * p = 0.016; ** p = 0.005; non-significant p value for differences between low and high symptom index PCR positive groups not shown). (b) Heatmap of 12 differentially abundant proteins between uninfected HCW (n=102) and PCR positive HCW at the time of first PCR positive test (n=29), grouped and then clustered according to symptom index. Colour bar represents range of normalized plasma concentration for each protein. Cluster ‘3’ representing PCR positive cases with case-definition symptoms express the highest levels of these proteomics biomarkers compared to other PCR positive groups and uninfected HCW. Clusters ‘1’ (PCR positive with no symptoms) and ‘2’ (PCR positive with atypical symptoms) unsurprisingly cluster around ‘0’ (uninfected controls with no symptoms). (c) MDP in plasma proteome comparing baseline uninfected HCW against serial samples from PCR positive individuals starting 1 week prior to first PCR positive test. (d) Principal component analysis plots comparing the 91-multimarker plasma proteome in all uninfected HCW (n=102) vs infected PCR positive participants (n=29) starting 1 week prior (left) to 6 weeks post (right) first PCR positive test. Individual points are coloured by group. Concentration ellipses of uninfected and infected HCW progressively diverge starting at week 0 (first PCR positive test), leading to complete separation of groups from week 3 onwards. FDR, false discovery rate; IQR, interquartile range; MDP, molecular degree of perturbation. Other abbreviations as inFigure 1.
Figure 3
Figure 3
Temporal correlogram of plasma proteomics trajectories with symptom burden, PCR-positivity and antibody titers during SARS-CoV-2 infection. Correlogram of individual normally-distributed plasma protein trajectories (i.e. protein levels during weeks -1 to 6) to Euroimmun anti-S1 spike protein (anti-S1) and Roche anti-nucleocapsid (anti-NP) titers, symptom-burden and PCR positive counts at these same timepoints, in infected participants (n=29) from 1 week prior to 6 weeks post, first PCR positive test. Only significant correlations (p>0.05) are shown. Circle colours reflect strength of the Pearson's correlation coefficient; interesting positive and negative correlations are highlighted in purple/orange and reported in the main text. Other abbreviations as inFigure 1.
Figure 4
Figure 4
Differentially detected plasma proteins and ranked pathway analysis for PCR positive state compared to uninfected controls. (a) Using this 91-protein multi-marker assay that was enriched from the outset for neuroinflammatory analytes, we observed 83 differentially detected proteins, log2 fold change threshold of 1.5 and FDR threshold of 0.05, between the plasma of infected participants (n=29) from 1 week prior to 6 weeks post first PCR positive test when compared to uninfected controls at baseline (n=52), along with ranked pathway analysis in b [also showing in red, the number of enriched genes per pathway relative to the total number of assayed genes]. Size of dots represents number of enriched genes within our neuroinflammatory enriched assayed set of 91 proteins, and intensity of colours represents p-value associated with enrichment analysis. (c) Network analyses for ranked pathway analysis (showing top 10 terms only) between these cases and controls, where abundantly present proteins are coloured in green and low abundance proteins are coloured in red. Node size of the pathway term represents number of input proteins implicated in the pathway. Other Abbreviations as inFigures 1 and 2.
Figure 5
Figure 5
Plasma proteome profile at time of seroconversion associates with persistent symptoms. Random forest multi-marker prediction of persistent symptoms at 12 months based on plasma proteomics profiles of healthcare workers at the time of first seroconversion for SARS-CoV-2. (a) Top 20 most predictive proteomics biomarkers are shown, ranked according to Gini coefficients. (b) In this cohort of n=156 healthcare workers, the multi-marker panel at the time of first seroconversion, predicts persistent symptoms at 12 months with an area under the curve (AUC) of 1.0. Applying linear discriminant analysis (LDA) to this same multi-marker panel (c,d) distinguishes between those with and without persistent symptoms at 12 months, with a percentage of correctly classified (PCC) = 94% (apparent error rate [AER] 0.06; two symptomatic cases misclassified “1” and “21”).
Figure 6
Figure 6
Graphical abstract.

References

    1. Deer RR, Rock MA, Vasilevsky N, et al. Characterizing long COVID: deep phenotype of a complex condition. EBioMedicine. 2021;74 - PMC - PubMed
    1. World Health Organization. A clinical case definition of post COVID-19 condition by a Delphi consensus, 6 October 2021. 2021.
    1. Pérez-González A, Araújo-Ameijeiras A, Fernández-Villar A, Crespo M, Poveda E. Long COVID in hospitalized and non-hospitalized patients in a large cohort in Northwest Spain, a prospective cohort study. Sci Rep. 2022;12:3369. - PMC - PubMed
    1. Bliddal S, Banasik K, Pedersen OB, et al. Acute and persistent symptoms in non-hospitalized PCR-confirmed COVID-19 patients. Sci Rep. 2021;11:13153. - PMC - PubMed
    1. Briggs A, Vassall A. Count the cost of disability caused by COVID-19. Nature. 2021;593:502–505. - PubMed