. 2022 Oct 18;3(10):100753.
doi: 10.1016/j.xcrm.2022.100753. Epub 2022 Sep 30.

Recurrent urinary tract infection and estrogen shape the taxonomic ecology and function of the postmenopausal urogenital microbiome

Affiliations

Recurrent urinary tract infection and estrogen shape the taxonomic ecology and function of the postmenopausal urogenital microbiome

Michael L Neugent et al. Cell Rep Med. .

Abstract

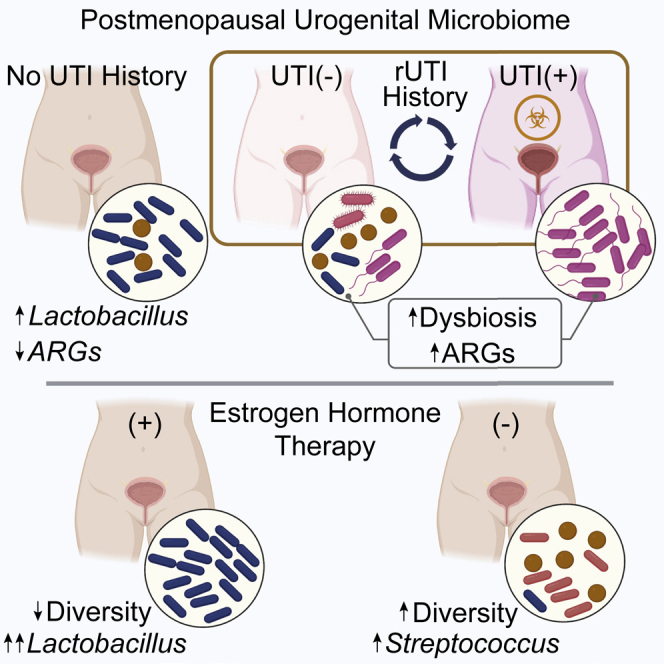
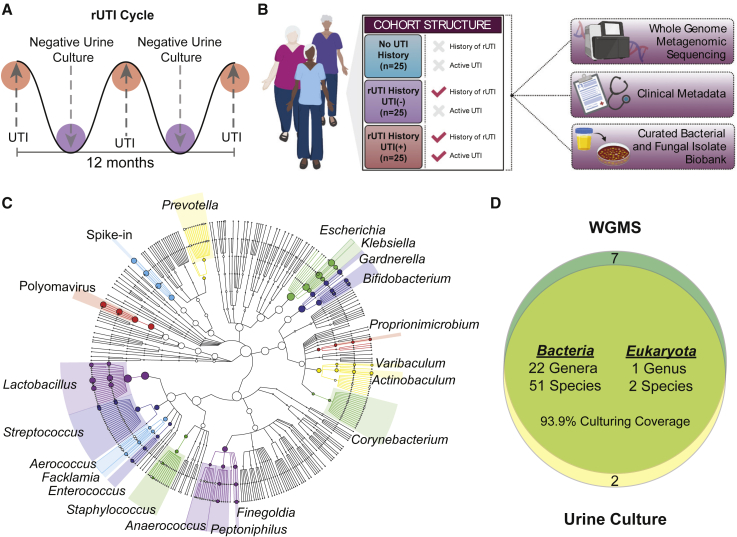
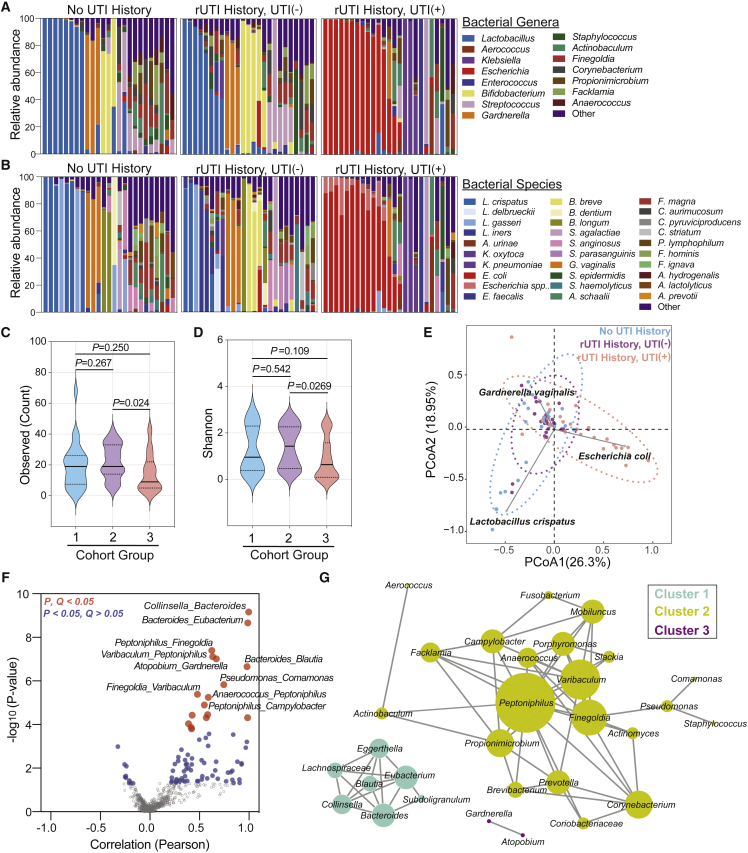
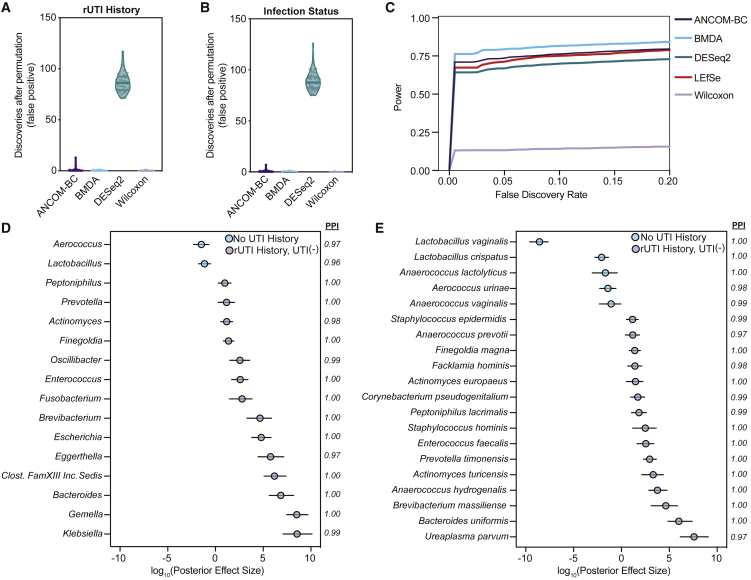
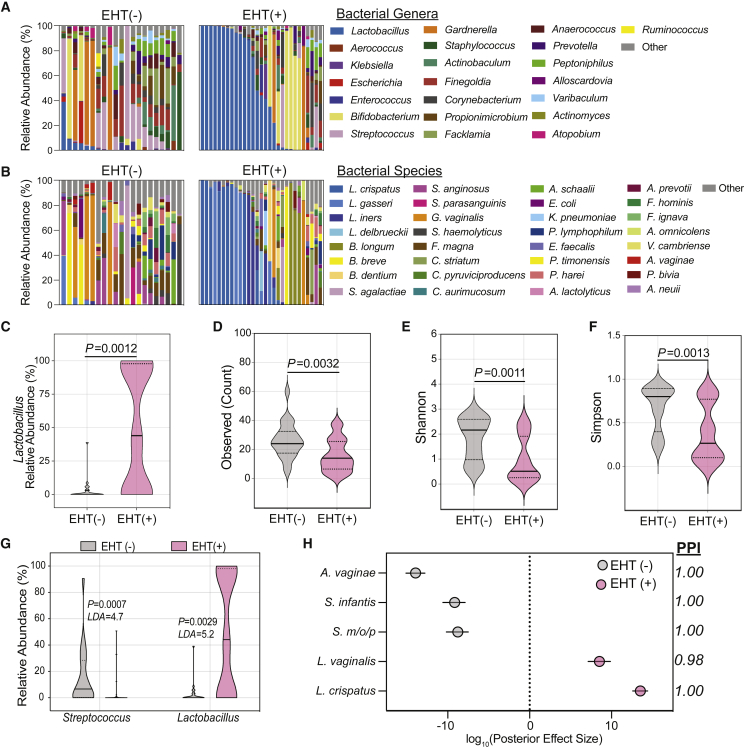
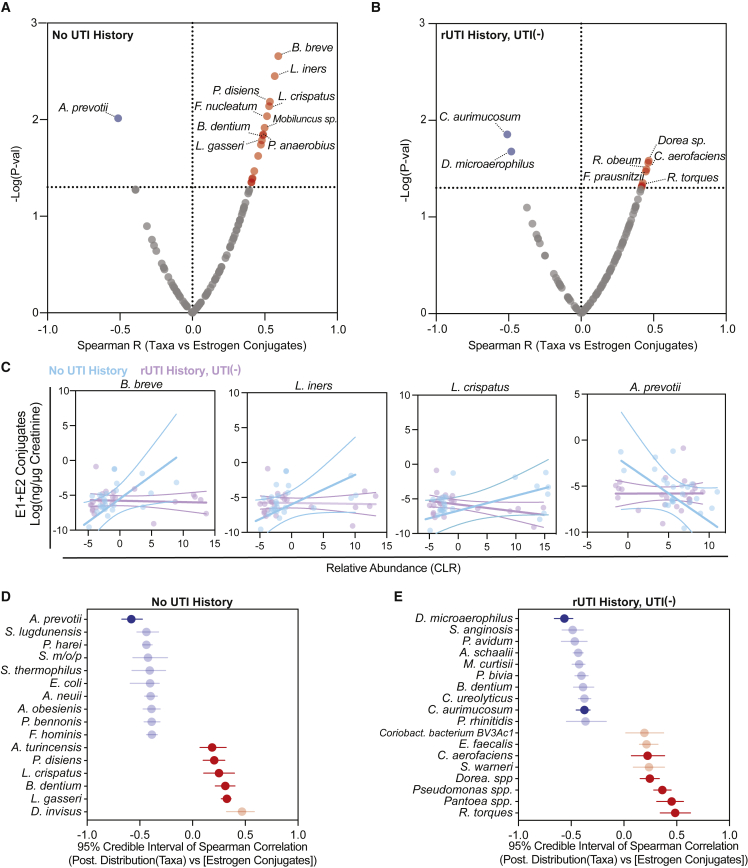
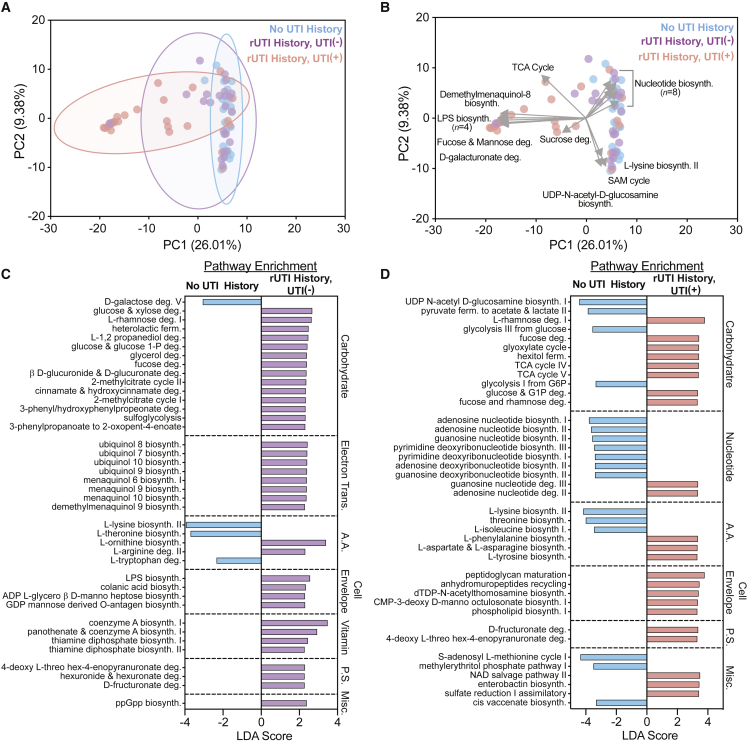
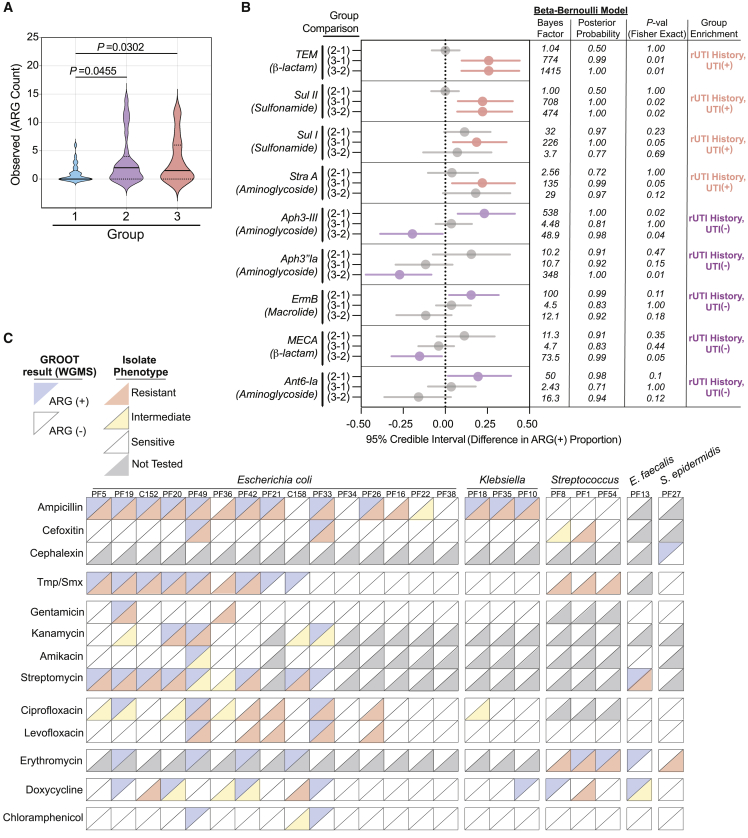
Postmenopausal women are severely affected by recurrent urinary tract infection (rUTI). The urogenital microbiome is a key component of the urinary environment. However, changes in the urogenital microbiome underlying rUTI susceptibility are unknown. Here, we perform shotgun metagenomics and advanced culture on urine from a controlled cohort of postmenopausal women to identify urogenital microbiome compositional and function changes linked to rUTI susceptibility. We identify candidate taxonomic biomarkers of rUTI susceptibility in postmenopausal women and an enrichment of lactobacilli in postmenopausal women taking estrogen hormone therapy. We find robust correlations between Bifidobacterium and Lactobacillus and urinary estrogens in women without urinary tract infection (UTI) history. Functional analyses reveal distinct metabolic and antimicrobial resistance gene (ARG) signatures associated with rUTI. Importantly, we find that ARGs are enriched in the urogenital microbiomes of women with rUTI history independent of current UTI status. Our data suggest that rUTI and estrogen shape the urogenital microbiome in postmenopausal women.

Keywords: Escherichia coli; Lactobacillus crispatus; antibiotic resistance; bladder; dysbiosis; estrogen; metagenomics; postmenopausal women; urinary tract infection; urogenital microbiome.


Conflict of interest statement

Declaration of interests The authors declare no competing interests.

Figures

None
Graphical abstract
Figure 1
Figure 1
Study design and summary of genera detected by WGMS and advanced urine culture (A) Illustration of rUTI cycle depicting periods of active, symptomatic UTI with positive urine culture followed by periods of remission with negative urine culture. (B) Diagram of cohort structure and datasets generated for the study created with BioRender.com. (C) Taxonomic cladogram of top 20 genera detected in all metagenomes (n = 75) by Metaphlan2. Node size indicates relative abundance and branch length is arbitrary. (D) Venn diagram depicting the coverage of advanced urine culture calculated at the genus level considering all bacterial genera with >5% WGMS relative abundance in at least one patient.
Figure 2
Figure 2
The bacterial taxonomic profile of rUTI in PM women (A and B) (A) Genus- and (B) species-level taxonomic profiles of the top 15 bacterial genera among groups (No UTI History [n = 25], rUTI History, UTI(−) [n = 25], rUTI History, UTI(+) [n = 25]). Remaining genera or species are combined into “Other.” (C and D) Alpha-diversity of (C) observed species counts and (D) Shannon index between groups (1 = No UTI History, 2 = rUTI History, UTI(−), 3 = rUTI History, UTI(+)). Solid lines represent medians, while dotted lines represent the interquartile range. p value generated by Kruskal-Wallis test with Dunn’s multiple correction post hoc. (E) Beta diversity by DPCoA. Samples color coded by group. Vectors (gray) represent top loadings (i.e., species). (F) Volcano plot depicting co-occurrence of genera by Pearson correlation. p value generated by permutation. Red dots represent associations with an FDR-corrected p value < 0.05. Blue dots represent associations with a nominal p value < 0.05, but an FDR-corrected p value > 0.05. (G) Network analysis of genus-level co-occurrences with nominal p value < 0.05. Nodes represent genera. Edges are defined by Pearson correlation and node size is proportional to the degree of the node.
Figure 3
Figure 3
Bayesian modeling detects the taxonomic imprint of rUTI history on the urogenital microbiome of PM women (A and B) Analysis of discoveries after permutation (type 1 error) in the taxonomic dataset permuted for (A) rUTI History for the No UTI History versus rUTI History comparison and (B) current infection status for the UTI(+) versus UTI(−) comparison (n = 50 permutations each) for BMDA compared with other commonly used differential enrichment analysis tools. (C) Comparison of average statistical power as a function of false discovery rate for differential enrichment analysis tools on a synthetic dataset with 1,000 taxa and a sample size of 108 (n = 54 per group). (D and E) BMDA model comparing genus- (D) and species-level (E) taxonomic enrichment between the No UTI History (n = 25) and rUTI History, UTI(−) (n = 25) groups. Dots, indicating the log10(posterior effect size), are color-coded by group. Lines indicate the 95% credible interval. PPI, posterior probability index.
Figure 4
Figure 4
Estrogen hormone therapy shapes the urogenital microbiome of PM women (A and B) (A) Genus- and (B) species-level taxonomic profiles of the relative abundance of the top 22 bacterial genera among EHT(−) (n = 21) and EHT(+) (n = 29) women in the No UTI History and rUTI History, UTI(−) groups. Taxa not within the top 22 are combined into “Other.” (C) Comparison of Lactobacillus relative abundance between EHT(−) (gray) and EHT(+) (pink) women in the No UTI History and rUTI History, UTI(−) groups. Solid lines represent medians, while dotted lines represent the interquartile range. p values generated by Wilcoxon rank-sum. (D–F) (D) Observed species count, (E) Shannon index, and (F) Simpson index for EHT(−) (gray) and EHT(+) (pink) women in the No UTI History and rUTI History, UTI(−) groups. Solid lines represent medians, while dotted lines represent the interquartile range. p values generated by Wilcoxon rank-sum. (G) Two significantly differentially enriched genera (LDA > 4.5) detected by LEfSe between EHT(−) (gray) and EHT(+) (pink). LDA: log10(linear discriminant analysis score). p value was generated by LEfSe. (H) Differentially enriched taxa between EHT(−) (gray) and EHT(+) (pink) women in the No UTI History and rUTI History, UTI(−) cohorts detected by BMDA. Dots indicate log10(posterior effect size). PPI, posterior probability index. S. m/o/p, Streptococcus mitis/oralis/pneumoniae. EHT(+) is the aggregate of both systemic and vaginal EHT modalities. Lines indicate the 95% credible interval.
Figure 5
Figure 5
Distinct taxa-urinary estrogen metabolite associations between PM women with and without rUTI history (A and B) Spearman correlation of bacterial species with summed Cr-normalized urinary estrogens in (A) No UTI History and (B) rUTI History, UTI(−) groups. p value generated by permutation. Red and blue dots represent significant (p < 0.05) positive and negative associations, respectively. (C–E) Taxa-estrogen correlation scatter plots among No UTI History (n = 25) (blue) and rUTI History, UTI(−) women (n = 23) (purple). Linear regression trend line (solid line) is shown with 95% confidence intervals. Bayesian correlation point estimates and 95% credible interval of posterior correlation (Spearman) for the top 10 taxa and Cr-normalized summed urinary estrogen conjugates in the (D) No UTI History and (E) rUTI History, UTI(−) groups. Blue indicates negative, while red indicates positive correlation. Significant correlations also found in the non-Bayesian analysis are bolded. Dots represent the median of the Spearman correlation posterior sampling, and lines indicate the 95% credible interval.
Figure 6
Figure 6
rUTI history and active infection shape the metabolic potential of the urogenital microbiome (A and B) PCA of metagenome-encoded metabolic pathways. Depiction of ordination and clustering in the first two principal-components (PCs) in (A) and vectors (gray) defining top loadings in (B). (C and D) Top 40 differentially enriched pathways between No UTI History (blue) and rUTI History, UTI(−) (purple) groups (C) and the No UTI History and rUTI History, UTI(+) (red) groups (D) detected by LEfSe. Pathways met an FDR-corrected p value cutoff of <0.05. LDA, log10(linear discriminant analysis).
Figure 7
Figure 7
rUTI history and active infection shape the resistome of the PM urogenital microbiome (A) Comparison of ARGs detected within the urogenital microbiomes of the No UTI History, rUTI History, UTI(−), and rUTI History, UTI(+) groups. Solid lines represent median, while dotted lines represent interquartile range. p value generated by Kruskal-Wallis test with uncorrected Dunn’s multiple correction post hoc. (B) Bayesian differential enrichment analysis of ARGs within cohort urogenital microbiomes. Group comparisons were determined by pairwise differences in ARG(+) proportions. 95% credible intervals, Bayes factor, posterior probability, Fisher exact p values are presented. (C) Agreement between WGMS ARG detection and antibiotic resistance phenotypes of isolates of the most abundant species present in each rUTI History, UTI(+) patient (E. coli (n = 15), Klebsiella (n = 3), Streptococcus (n = 3), E. faecalis (n = 1), and S. epidermidis (n = 1)). Upper diagonal colors represent WGMS profiling results (blue = ARG (+), white = ARG(−)). Lower diagonal color represents phenotype (red = resistant, yellow = intermediate, white = sensitive, gray = not tested). (1) No UTI History: no history of UTI, no active UTI. (2) rUTI History, UTI(−): history of rUTI, no active UTI. (3) rUTI History, UTI(+): history of rUTI, active UTI.

Comment in

References

    1. Gaitonde S., Malik R.D., Zimmern P.E. Financial burden of recurrent urinary tract infections in women: a time-driven activity-based cost analysis. Urology. 2019;128:47–54. doi: 10.1016/j.urology.2019.01.031. - DOI - PubMed
    1. Jhang J.F., Kuo H.C. Recent advances in recurrent urinary tract infection from pathogenesis and biomarkers to prevention. Ci Ji Yi Xue Za Zhi. 2017;29:131–137. doi: 10.4103/tcmj.tcmj_53_17. - DOI - PMC - PubMed
    1. Flores-Mireles A.L., Walker J.N., Caparon M., Hultgren S.J. Urinary tract infections: epidemiology, mechanisms of infection and treatment options. Nat. Rev. Microbiol. 2015;13:269–284. doi: 10.1038/nrmicro3432. - DOI - PMC - PubMed
    1. Malik R.D., Wu Y.R., Zimmern P.E. Definition of recurrent urinary tract infections in women: which one to adopt? Female Pelvic Med. Reconstr. Surg. 2018;24:424–429. doi: 10.1097/SPV.0000000000000509. - DOI - PubMed
    1. Anger J., Lee U., Ackerman A.L., Chou R., Chughtai B., Clemens J.Q., Hickling D., Kapoor A., Kenton K.S., Kaufman M.R., et al. Recurrent uncomplicated urinary tract infections in women: AUA/CUA/SUFU guideline. J. Urol. 2019;202:282–289. doi: 10.1097/JU.0000000000000296. - DOI - PubMed

Publication types