. 2022 Oct 1;19(1):239.
doi: 10.1186/s12974-022-02600-0.

Impaired response of blood neutrophils to cell-death stimulus differentiates AQP4-IgG-seropositive NMOSD from MOGAD

Affiliations

Impaired response of blood neutrophils to cell-death stimulus differentiates AQP4-IgG-seropositive NMOSD from MOGAD

Maria Schroeder-Castagno et al. J Neuroinflammation. .

Abstract

Background: In neuromyelitis optica spectrum disorders (NMOSD) and myelin oligodendrocyte glycoprotein antibody-associated disease (MOGAD), neutrophils are found in CNS lesions. We previously demonstrated that NMOSD neutrophils show functional deficiencies. Thus, we hypothesized that neutrophil accumulation in the CNS may be facilitated by impairments affecting mechanisms of neutrophil death.

Objective: To evaluate cell death in blood neutrophils from aquaporin-4 (AQP4)-IgG-seropositive NMOSD and MOGAD patients as well as matched healthy controls (HC) using in vitro assays.

Methods: Twenty-eight AQP4 + NMOSD and 19 MOGAD patients in stable disease phase as well as 45 age- and sex-matched HC were prospectively recruited. To induce cell death, isolated neutrophils were cultured with/without phorbol 12-myristate 13-acetate (PMA). Spontaneous and PMA-induced NETosis and apoptosis were analyzed using 7-AAD and annexin-V by flow cytometry. Caspase-3 was assessed by western blot. Myeloperoxidase-DNA complexes (MPO-DNA), MPO and elastase were evaluated by ELISA, and cell-free DNA (cfDNA) by a fluorescence-based assay. Reactive oxygen species (ROS) were evaluated by a dihydrorhodamine 123-based cytometric assay. Serum GM-CSF, IL-6, IL-8, IL-15, TNF-ɑ and IL-10 were evaluated by multiplex assays, and neurofilament light chain (NfL) by single-molecule array assay.

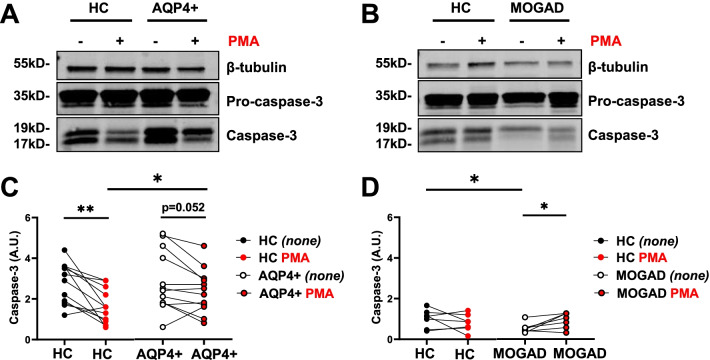
Results: In response to PMA, neutrophils from AQP4 + NMOSD but not from MOGAD patients showed an increased survival, and subsequent reduced cell death (29.6% annexin V+ 7-AAD+) when compared to HC (44.7%, p = 0.0006). However, AQP4 + NMOSD also showed a mild increase in annexin V+ 7-AAD- early apoptotic neutrophils (24.5%) compared to HC (20.8%, p = 0.048). PMA-induced reduction of caspase-3 activation was more pronounced in HC (p = 0.020) than in AQP4 + NMOSD neutrophils (p = 0.052). No differences were observed in neutrophil-derived MPO-DNA or serum levels of MPO, elastase, IL-6, IL-8 and TNF-ɑ. IL-15 levels were increased in both groups of patients. In AQP4 + NMOSD, an increase in cfDNA, GM-CSF and IL-10 was found in serum. A positive correlation among cfDNA and NfL was found in AQP4 + NMOSD.

Conclusions: AQP4 + NMOSD neutrophils showed an increased survival capacity in response to PMA when compared to matched HC neutrophils. Although the data indicate that the apoptotic but not the NETotic response is altered in these neutrophils, additional evaluations are required to validate this observation.

Keywords: Aquaporin-4 NMOSD; MOGAD; Myelin oligodendrocyte glycoprotein-antibody-associated disease; Neuromyelitis optica spectrum disorders; Neutrophils.


Conflict of interest statement

The authors declare that they have no competing interests.

Figures

Fig. 1
Fig. 1
Frequencies of live, early apoptosis and late apoptosis/NETosis neutrophils from patients and HC after PMA exposure. A Representative flow cytometry plots and gating strategy to determine the frequencies of living, early apoptosis, late apoptosis/NETotic neutrophils in samples from AQP4 + NMOSD and MOGAD patients and their matched HC. Arrows indicate cell-death trajectory of NETosis and apoptosis pathway. Quantification of the frequencies of spontaneous (black dots, none) and PMA-induced cell death (red dots) in B AQP4 + NMOSD or C MOGAD patients compared to their corresponding HC. D AQP4 + NMOSD treatment-naïve patients and HC. Data are represented as median and IQR in scatter plot with a bar graph. Each dot represents an individual subject. none (unstimulated-vehicle; none). HC: n = 29; AQP4 + NMOSD: n = 20; MOGAD: n = 9
Fig. 2
Fig. 2
Images of neutrophils’ response to PMA in HC as well as MOGAD and AQP4 + NMOSD patients. A Living, apoptotic and NETotic neutrophils from patients and HC. DNA (Hoechst 33342) in blue and neutrophil elastase (NE) in green, as well as merged images, are shown for a HC, b MOGAD and c AQP4 + NMOSD, without PMA (top panels in each group; none) and with PMA (lower panels in each group). B Neutrophils were assigned into three categories based on their nuclei morphology: live, apoptosis or NETosis. C Quantification of NETosis in unstimulated none (black dots) and PMA-stimulated neutrophlis (red dots) from MOGAD (left panel) and AQP4 + NMOSD (right panel) patients compared to their corresponding HC. Data are represented as mean ± SEM in scatter plot with a bar graph. Inverted fluorescent microscope at 40 × magnification; scale bar 20 µm. none (unstimulated-vehicle). HC: n = 9; AQP4 + NMOSD: n = 5; MOGAD: n = 4
Fig. 3
Fig. 3
Caspase-3 expression in neutrophils from AQP4 + NMOSD and MOGAD patients and HC. Neutrophils from patients and age- and sex- matched HC were purified and processed for western blot simultaneously. Cell lysates were obtained after incubation with and without PMA. Representative western blot images of A AQP4 + NMOSD and B MOGAD neutrophil lysates compared to their corresponding HC. C, D Levels of caspase-3 (19 kDa and 17 kDa) normalized to β-tubulin shown as caspase-3 (A.U.) in unstimulated (black dots; none) and PMA-stimulated neutrophils (red dots). Each dot represents the mean value of 2 or 3 independent WB for each patient and corresponding HC. Data are represented with lines connecting among unstimulated and PMA-stimulated samples. none (unstimulated-vehicle). HC: n = 19; AQP4 + NMOSD: n = 12; MOGAD: n = 7
Fig. 4
Fig. 4
Spontaneous and PMA-induced generation of MPO-DNA by AQP4 + NMOSD and MOGAD neutrophils. MPO-DNA complexes were analyzed by ELISA in neutrophil culture supernatants from AQP4 + NMOSD and MOGAD patients and HC. Unstimulated (black dots; none) and PMA-stimulated samples (red dots) are shown. Each dot represents an individual subject. Lines connect the unstimulated and PMA-stimulated data points of the same patient. None (unstimulated-vehicle). HC: n = 5; AQP4 + NMOSD: n = 11; MOGAD: n = 8
Fig. 5
Fig. 5
MPO-DNA, cfDNA, MPO, and elastase in serum samples from AQP4 + NMOSD and MOGAD patients and HC. Serum samples from AQP4 + NMOSD (left panels) and MOGAD patients (right panels) and their corresponding age- and sex- matched HC were analyzed by ELISA for MPO-DNA (A), cfDNA (B), MPO (C) and elastase (D). Data are represented as median and IQR in scatter plot with a bar graph. Each dot represents an individual subject. AQP4 + NMOSD: n = 26(A), n = 20(B), n = 19(C), n = 19(D); MOGAD: n = 13(A), n = 13(B), n = 10(C), n = 9(D) and corresponding matched HC. The patient cohorts included in the data were not identical for each investigated analyte
Fig. 6
Fig. 6
Correlations between serological markers of neutrophil death with NfL and the clinical parameters EDSS and ARR. A Pearson correlation among cfDNA and NfL. B Spearman correlation between cfDNA and EDSS. C Pearson correlation among cfDNA and ARR. D Pearson correlation among MPO-DNA and ARR. Each dot represents an individual subject. AQP4 + NMOSD: n = 14(A), n = 19(B), n = 20(C), n = 26(D). The patient cohort included in the correlation cfDNA / ARR was not identical to the cohort analyzed in the correlation MPO-DNA/ARR

References

    1. Borisow N, Mori M, Kuwabara S, Scheel M, Paul F. Diagnosis and treatment of NMO spectrum disorder and MOG-encephalomyelitis. Front Neurol. 2018;9:888. doi: 10.3389/fneur.2018.00888. - DOI - PMC - PubMed
    1. Jarius S, Paul F, Weinshenker BG, Levy M, Kim HJ, Wildemann B. Neuromyelitis optica. Nat Rev Dis Primers. 2020;6(1):85. doi: 10.1038/s41572-020-0214-9. - DOI - PubMed
    1. Jarius S, Wildemann B. Aquaporin-4 antibodies (NMO-IgG) as a serological marker of neuromyelitis optica: a critical review of the literature. Brain Pathol. 2013;23(6):661–683. doi: 10.1111/bpa.12084. - DOI - PMC - PubMed
    1. Wingerchuk DM, Banwell B, Bennett JL, et al. International consensus diagnostic criteria for neuromyelitis optica spectrum disorders. Neurology. 2015;85(2):177–189. doi: 10.1212/WNL.0000000000001729. - DOI - PMC - PubMed
    1. Jarius S, Paul F, Aktas O, et al. MOG encephalomyelitis: international recommendations on diagnosis and antibody testing. J Neuroinflammation. 2018;15(1):134. doi: 10.1186/s12974-018-1144-2. - DOI - PMC - PubMed

MeSH terms