. 2022 Oct 1;20(1):432.
doi: 10.1186/s12951-022-01636-x.

Huc-MSC-derived exosomes modified with the targeting peptide of aHSCs for liver fibrosis therapy

Affiliations

Huc-MSC-derived exosomes modified with the targeting peptide of aHSCs for liver fibrosis therapy

Yan Lin et al. J Nanobiotechnology. .

Abstract

Background: Effective therapeutics to stop or reverse liver fibrosis have not emerged, because these potential agents cannot specifically target activated hepatic stellate cells (aHSCs) or are frequently toxic to parenchymal cells. Human umbilical cord mesenchymal stem cell (Huc-MSC)-derived exosomes show promise in nanomedicine for the treatment of liver fibrosis. However, systemic injection showed that unmodified exosomes were mainly taken up by the mononuclear phagocyte system. The discovery of ligands that selectively bind to a specific target plays a crucial role in clinically relevant diagnostics and therapeutics. Herein, we aimed to identify the targeting peptide of aHSCs by screening a phage-displayed peptide library, and modify Huc-MSC-derived exosomes with the targeting peptide.

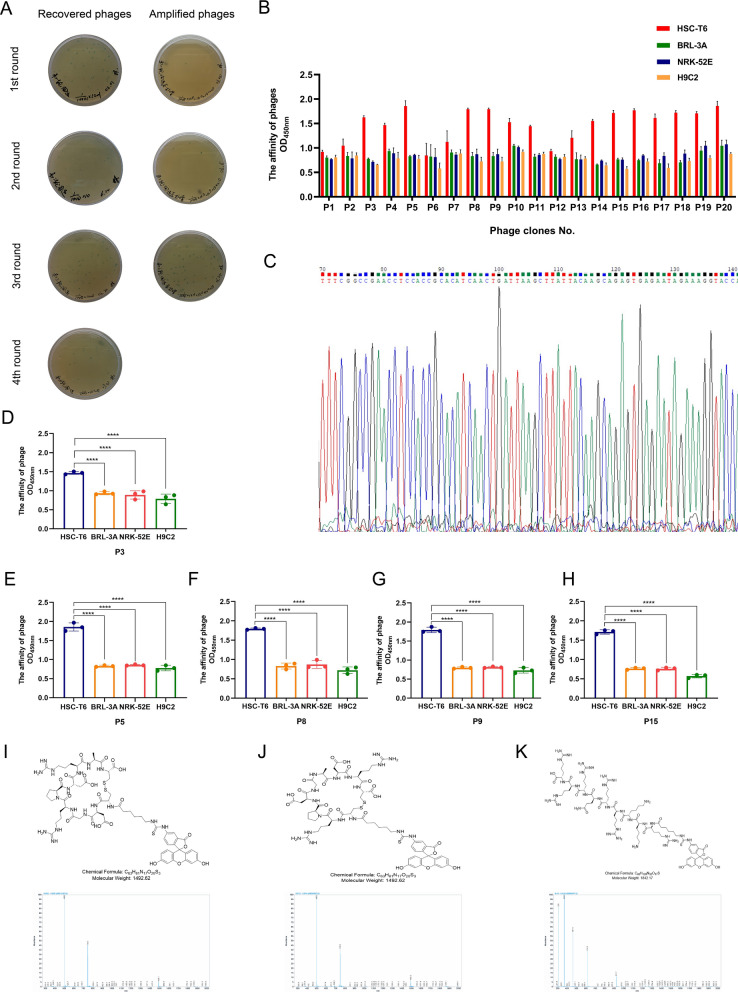
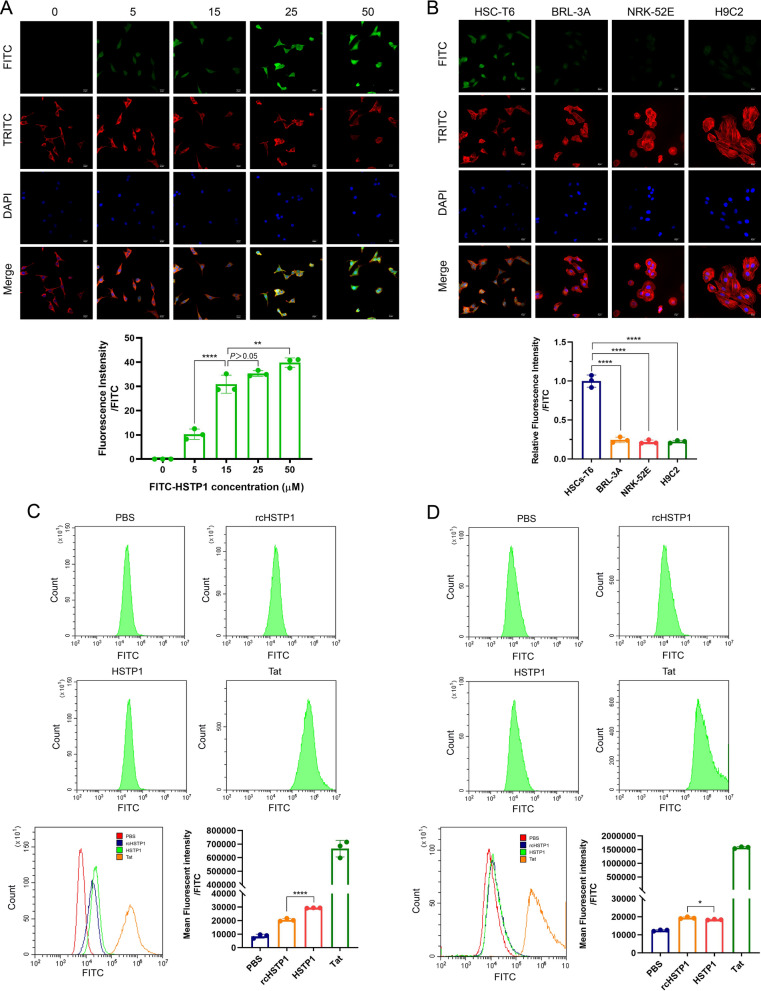
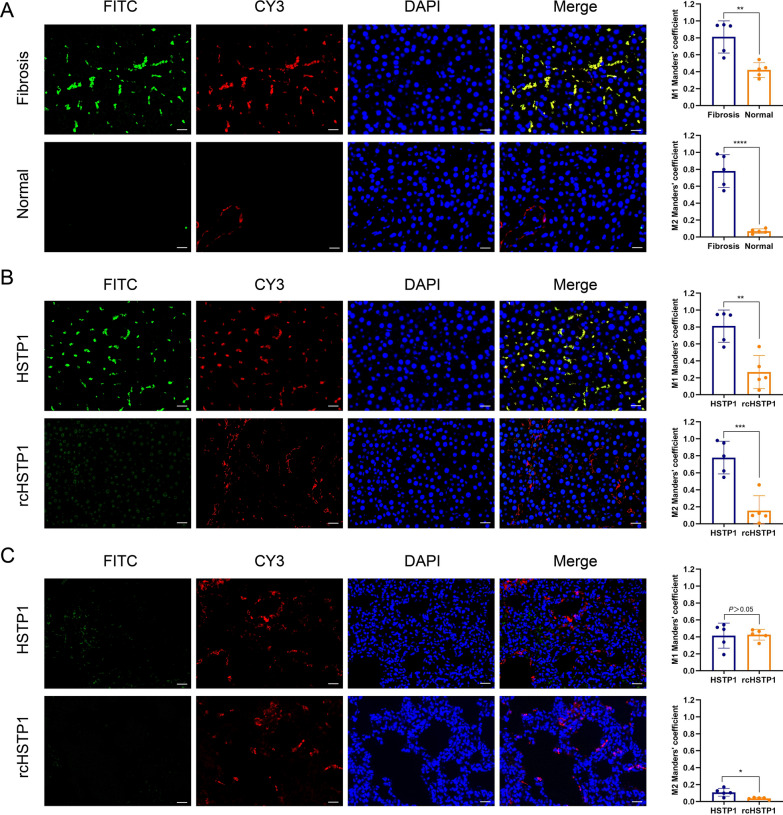
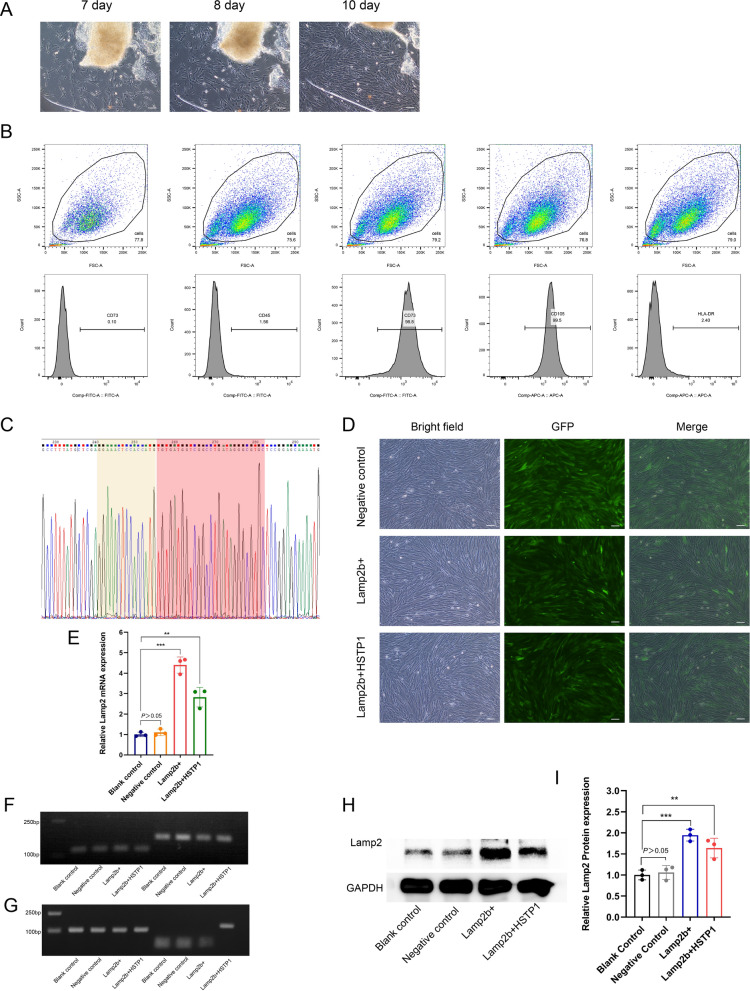
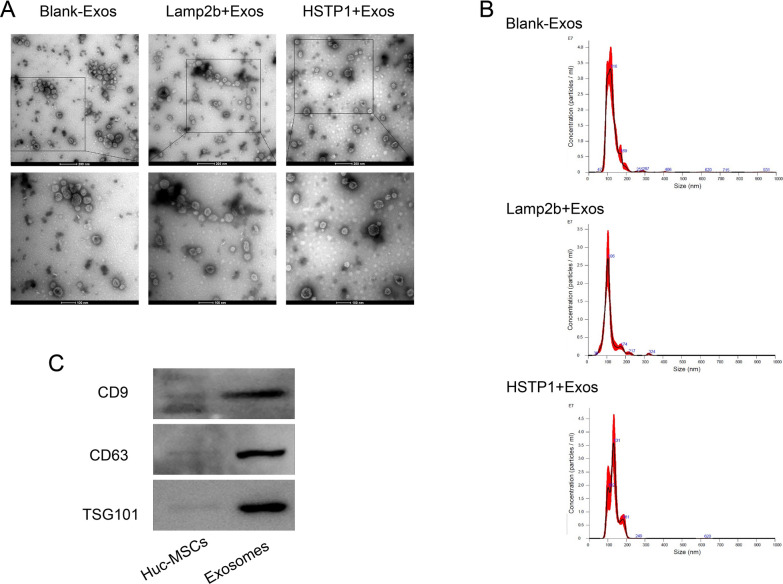
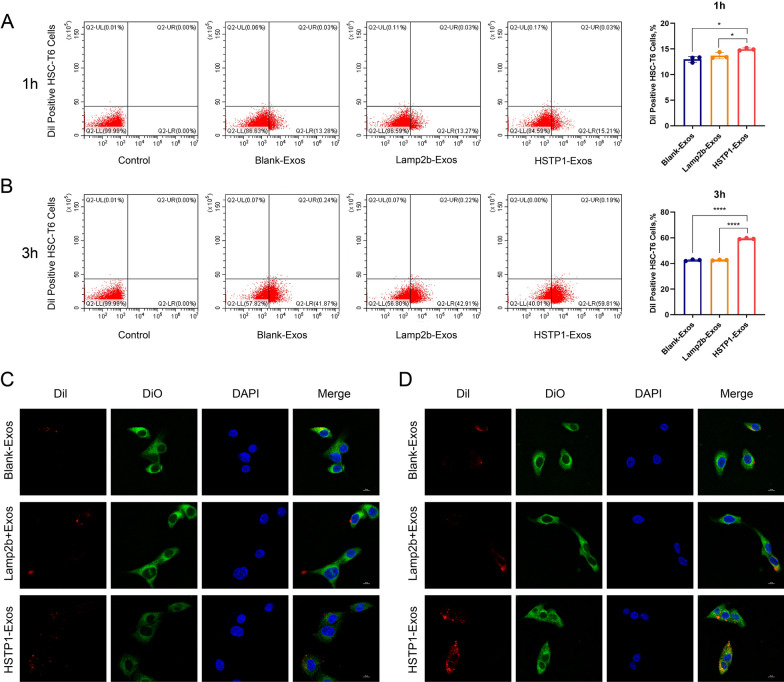
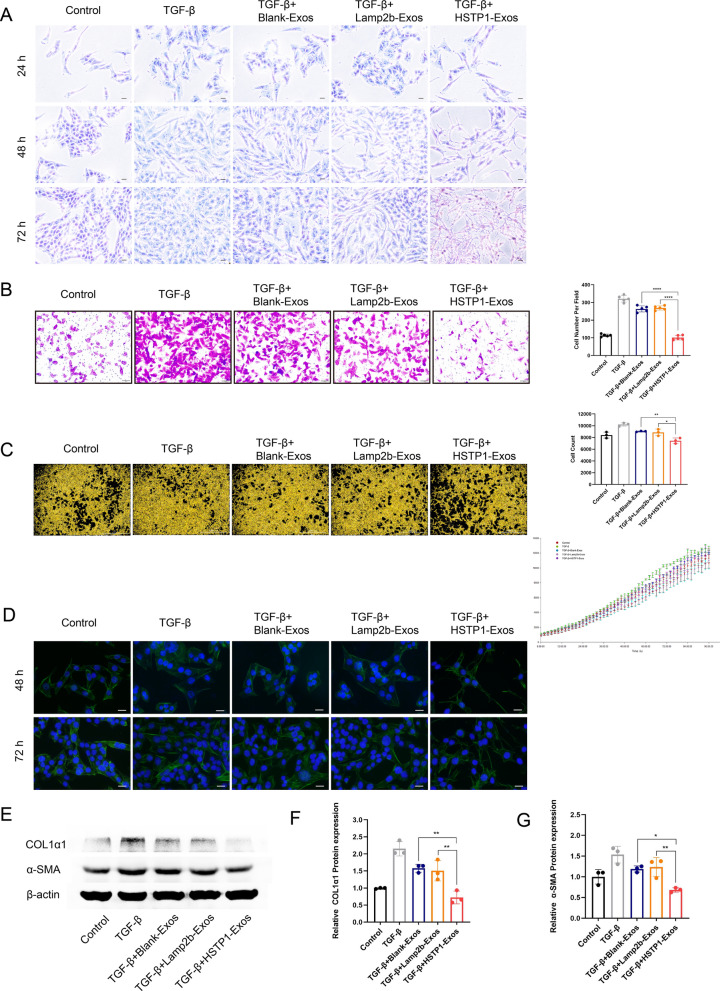
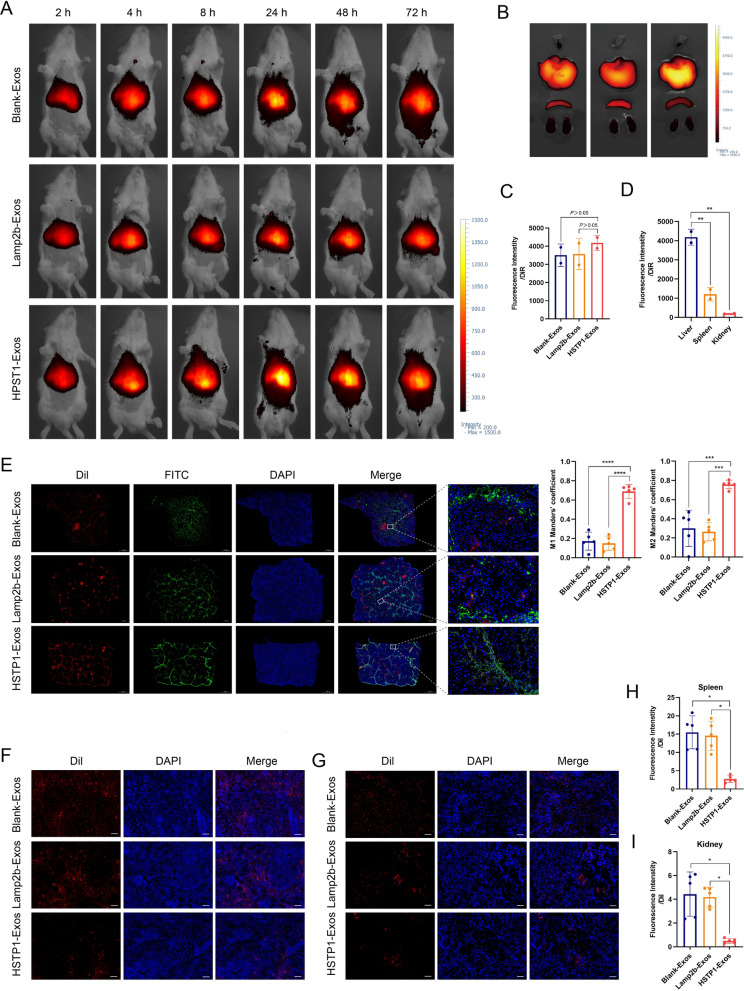
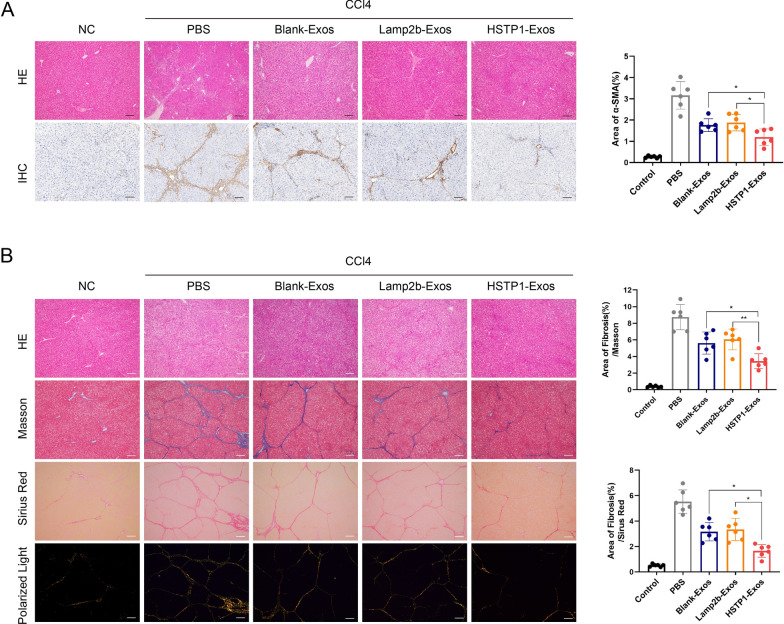
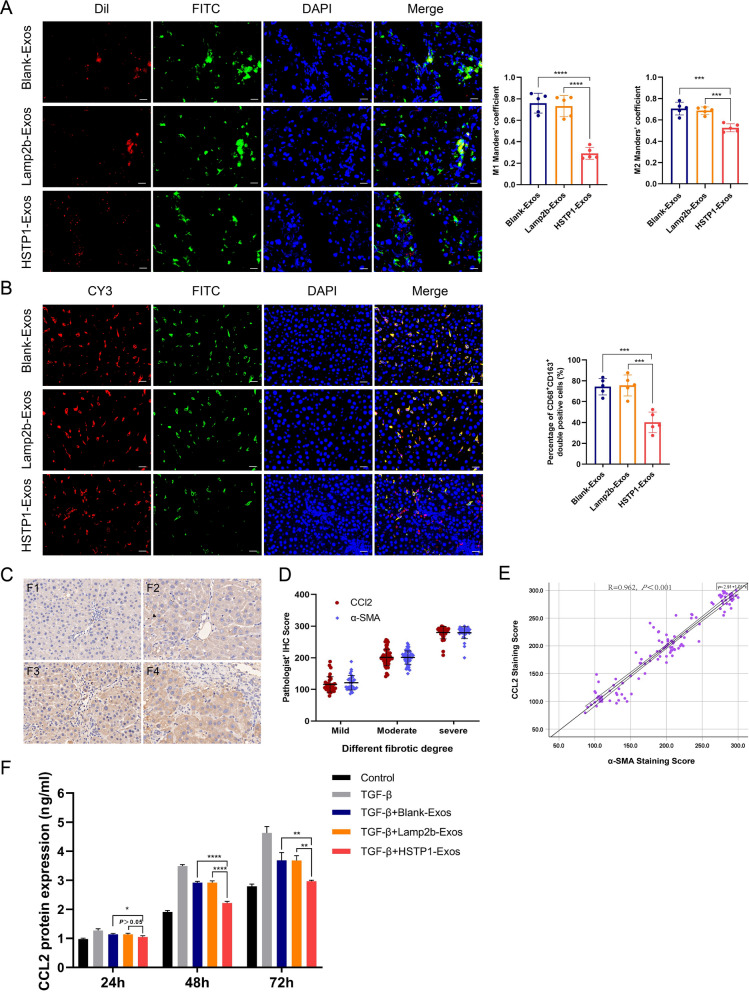
Results: In this study, we screened a phage-displayed peptide library by biopanning for peptides preferentially bound to HSC-T6 cells. The identified peptide, HSTP1, also exhibited better targeting ability to aHSCs in pathological sections of fibrotic liver tissues. Then, HSTP1 was fused with exosomal enriched membrane protein (Lamp2b) and was displayed on the surface of exosomes through genetic engineering technology. The engineered exosomes (HSTP1-Exos) could be more efficiently internalized by HSC-T6 cells and outperformed both unmodified exosomes (Blank-Exos) and Lamp2b protein overexpressed exosomes (Lamp2b + Exos) in enhancing the ability of exosomes to promote HSC-T6 reversion to a quiescent phenotype. In vivo results showed HSTP1-Exos could specifically target to the aHSC region after intravenous administration, as demonstrated by coimmunofluorescence with the typical aHSCs marker α-SMA, and enhance the therapeutic effect on liver fibrosis.

Conclusion: These results suggest that HSTP1 is a reliable targeting peptide that can specifically bind to aHSCs and that HSTP1-modified exosomes realize the precise treatment for aHSCs in complex liver tissue. We provide a novel strategy for clinical liver fibrosis therapy.

Keywords: Exosomes; Huc-MSCs; Liver fibrosis; Targeting peptide; aHSCs.


Conflict of interest statement

The authors declare no conflict of interest.

Figures

Fig. 1
Fig. 1
Screening of phages and identification of positive phage clones. A The titers of the recovered and amplified phages from each round. The blue plaques formed on agar plates containing tetracycline were used to calculated the phages. B Elisa results for 20 phage clones binding to HSC-T6, BRL-3A, NRK-52E, and H9C2 cells. C Following 4 rounds of phage display biopanning, amino acid sequence with highest frequencies was identified by DNA sequencing. The nucleic acid sequences were analyzed by Chromas. DH Comparison of phage cell-binding Elisa results for the affinity of individual phage clones with same sequence (CDGRPDRAC) to HSC-T6, BRL-3A, NRK-52E, and H9C2 cells. IK Molecular structure and mass spectrogram of the HSTP1, rcHSTP1, and TAT. *P < 0.05, **P < 0.01, ***P < 0.001, ****P < 0.0001
Fig. 2
Fig. 2
Assessing the targeting affinity of the HSTP1 to aHSCs by immunocytofluorescence and flow cytometry. A Confocal microscopic images analysis of the binding affinity of the HSTP1 in different concentrations. B Confocal microscopic images analysis of the binding specificity of the HSTP1 to HSC-T6 cells. C, D Compared with negative control group (rcHSTP1), identified HSTP1 demonstrated a high affinity to HSC-T6 cells and had a superiority of amino acid sequence by flow cytometry. The bar graph depicts the mean fluorescence intensity of FITC. *P < 0.05, **P < 0.01, ***P < 0.001, ****P < 0.0001. Scale bar: 20 µm
Fig. 3
Fig. 3
Assessing the specificity of the HSTP1 to aHSCs by immunofluorescence histochemistry. A aHSCs and HSTP1 co-immunofluorescence in fibrotic and normal liver tissues. The aHSCs were stained with anti-α-SMA antibody (red), FITC-labeled HSTP1 (green), nuclei were visualized by counterstaining with DAPI (blue), and images were merged. B Co-immunofluorescence for HSTP1, rcHSTP1 (green) and α-SMA (red) in fibrotic liver tissues. C Co-immunofluorescence for HSTP1, rcHSTP1 (green) and α-SMA (red) in lung tissues. The bar graphs depict the Manders’ coefficients M1 and M2 in colocalization. Scale bar: 50 µm. *P < 0.05, **P < 0.01, ***P < 0.001, ****P < 0.0001
Fig. 4
Fig. 4
Isolation, identification, and modification of huc-MSCs. A Inverted phase contrast microscopy images of cells morphological observation of huc-MSCs. Scale bar: 100 µm. B Identification of huc-MSCs with CD45, CD73, CD105, and HLA-DR. C Sequencing results of fused gene of Lamp2b and HSTP1 constructed in plasmid vectors. Sequence of yellow shading was GNSTM, sequence of red shading was HSTP1. D Fluorescence microscope images of infection efficiency of empty vector lentivirus (negative control), Lamp2b gene overexpression lentivirus (Lamp2b +), and fused gene overexpression lentivirus (Lamp2b + HSTP1) in huc-MSCs. E RT-PCR results of Lamp2 mRNA expression in Blank control, Negative control, Lamp2b + , and Lamp2b + HSTP1 with the universal primer (forward 5’-AACCCCAATACAACTCACTCC-3’, reverse 5’-GCCATTAACCAAATACATGCTG-3’). F Agarose gel electrophoresis of RT-PCR products with the universal primer. G Agarose gel electrophoresis of RT-PCR products with the specific primer (forward 5’-AGGAAACTCCACCATGTGTGATG-3’, reverse 5’-GCTTCCATTATATGTCACAGTGCC-3’). H Western blot and relative protein expression qualification for the Lamp2 in huc-MSCs. *P < 0.05, **P < 0.01, ***P < 0.001, ****P < 0.0001
Fig. 5
Fig. 5
Identification of exosomes. A Size distribution of Blank-Exos, Lamp2b-Exos, and HSTP1-Exos on the basis of NTA. B TEM images of blank-exosomes (Blank-Exos), lamp2b-exosomes (Lamp2b-Exos), and HSTP1-exosomes (HSTP1-Exos). C Western blot analysis of huc-MSCs and exosomes by CD6, CD63, and TSG101
Fig. 6
Fig. 6
Binding of HSTP1-Exos to HSC-T6 cells in vitro. A, B Flow cytometric analysis of Blank-Exos, Lamp2b-Exos, and HSTP1-Exos labeled with Dil binding to HSC-T6 cells. The percentages represent the proportion of HSC-T6 cell that had internalized Dil-labeled exosomes (Dil-positive HSC-T6 cells) at 1 h and 3 h. C, D Confocal microscopy images of colocalization of Dil-labeled Blank-Exos, Lamp2b-Exos, and HSTP1-Exos (red) and DiO labeled cell membrane (green) at 1 h and 3 h. Cell nuclei were stained with DAPI (blue). Scale bars: 10 µm. *P < 0.05, **P < 0.01, ***P < 0.001, ****P < 0.0001
Fig. 7
Fig. 7
Anti-fibrosis effect of HSTP1-Exos in vitro. A Visualization of lipid droplets by Oil Red staining in control, TGF-β, Blank-Exos, Lamp2b-Exos, and HSTP1-Exos-treated HSC-T6 cells at 24 h, 48 h, and 72 h. Scale bars: 20 µm. B The effect of exosomes on the HSC-T6 cells migration ability. The bar graph showed the results of analysis of the selected fields. C The effect of exosomes on the HSC-T6 cells proliferation. The bar graph depicted the cell count in each group at 72 h. The line chart showed the growth curve in each group. Scale bars: 1000 µm. D α-SMA immunocytofluorescence (green) in control, TGF-β, Blank-Exos, Lamp2b-Exos, and HSTP1-Exos-treated HSC-T6 cells at 48 h and 72 h. DAPI-stained nuclei (blue). Scale bars: 20 µm. EG Western blot and relative protein expression qualification for the fibrotic proteins in HSC-T6 cells. *P < 0.05, **P < 0.01, ***P < 0.001, ****P < 0.0001
Fig. 8
Fig. 8
In vivo aHSCs targeting ability of the HSTP1-Exos. A In vivo tracking of DiR-labeled Blank-Exos, Lamp2b-Exos, and HSTP1-Exos at 2, 4, 8, 24, 48, and 72 h. B Ex fluorescence imaging of major organs from rat models of liver fibrosis 72 h after intravenous injection with DiR-labeled Blank-Exos, Lamp2b-Exos, and HSTP1-Exos. C Mean fluorescence intensity from the fibrotic liver quantified using a vivo smart imaging system. D Quantitative fluorescence intensity of liver, spleen, and kidney from the HSTP1-Exos group. E Confocal laser-scanning microscopy images of the cellular localization of the Dil-labeled Blank-Exos, Lamp2b-Exos, and HSTP1-Exos (red) in fibrotic liver tissues. The aHSCs were stained with anti-α-SMA antibody (green). Scale bar: 1000 µm. The bar graph depicts the Manders’ coefficients M1 and M2 in colocalization. F, G Representative images of recruitment of Dil-labeled Blank-Exos, Lamp2b-Exos, and HSTP1-Exos (red) in spleens and kidneys. H, I Quantitative fluorescence intensity of Dil-labeled Blank-Exos, Lamp2b-Exos, and HSTP1-Exos in the spleen and kidney. Scale bar: 100 µm. Cell nuclei were stained with DAPI. *P < 0.05, **P < 0.01, ***P < 0.001, ****P < 0.0001
Fig. 9
Fig. 9
Anti-fibrosis effect of HSTP1-Exos in vivo. A HE staining and immunohistochemistry of α-SMA of liver tissues in NC, PBS, Blank-Exos, Lamp2b-Exos, and HSTP1-Exos groups. The bar graph depicts the quantification of α-SMA staining. B Histology was analyzed by HE staining, Masson’s trichrome staining, Sirius Red staining, and polarized light images of Sirius Red staining with the quantification of Masson’s trichrome staining, and Sirius Red staining. Scale bar: 100 µm. Cell nuclei were stained with haematoxylin. *P < 0.05, **P < 0.01, ***P < 0.001, ****P < 0.0001
Fig. 10
Fig. 10
Regulation of HSTP1-Exos via inhibiting CCL2 secretion from aHSCs. A Cellular uptake of the Dil-labeled Blank-Exos, Lamp2b-Exos, and HSTP1-Exos (red) into FITC-labeled CD68+ macrophage (green) in fibrotic liver tissues. The bar graph depicts the Manders’ coefficients M1 and M2 in colocalization. B Immunofluorescence double staining of liver tissue with CY3-labeled CD68 and FITC-labeled CD163. The bar graph depicts the percentage of CD68+CD163+ double positive macrophages to CD68 + positive macrophages in each group. C Representative images of immunohistochemistry staining of liver tissues antibody of CCL2. The degree of liver fibrosis was assessed by the Metavir score system (F0, F1, F2, F3, and F4). D The correlation between α-SMA and CCL2 under different fibrotic degree. F0 and F1 were defined as mild fibrosis, F2 and F3 as moderative fibrosis, and F4 as severe fibrosis. Protein expression was quantified based on the evaluation of staining using semiquantitative Histoscore. E The scatter plot of a correlation between aHSCs (α-SMA) IHC staining score and CCL2 score. F Elisa analysis of CCL2 protein expression levels in exosomes treated HSC-T6 cells. Scale bar: 20 µm. *P < 0.05, **P < 0.01, ***P < 0.001, ****P < 0.0001

Similar articles

Cited by

References

    1. Moon AM, Singal AG, Tapper EB. Contemporary epidemiology of chronic liver disease and cirrhosis. Clin Gastroenterol Hepatol. 2020;18(12):2650–2666. - PMC - PubMed
    1. Du XS, Li HD, Yang XJ, Li JJ, Xu JJ, Chen Y, Xu QQ, Yang L, He CS, Huang C, et al. Wogonin attenuates liver fibrosis via regulating hepatic stellate cell activation and apoptosis. Int Immunopharmacol. 2019;75:105671. - PubMed
    1. Devaraj E, Perumal E, Subramaniyan R, Mustapha N. Liver fibrosis: extracellular vesicles mediated intercellular communication in perisinusoidal space. Hepatology. 2021 doi: 10.1002/hep.32239. - DOI - PubMed
    1. Mejias M, Gallego J, Naranjo-Suarez S, Ramirez M, Pell N, Manzano A, Suñer C, Bartrons R, Mendez R, Fernandez M. Cpeb4 increases expression of PFKFB3 to induce glycolysis and activate mouse and human hepatic stellate cells, promoting liver fibrosis. Gastroenterology. 2020;159(1):273–288. - PubMed
    1. Ji D, Wang Q, Zhao Q, Tong H, Yu M, Wang M, Lu T, Jiang C. Co-delivery of miR-29b and germacrone based on cyclic RGD-modified nanoparticles for liver fibrosis therapy. J Nanobiotechnology. 2020;18(1):86. - PMC - PubMed

LinkOut - more resources