. 2022 Oct 1;18(1):114.
doi: 10.1186/s13007-022-00946-3.

Combination of long-term 13CO2 labeling and isotopolog profiling allows turnover analysis of photosynthetic pigments in Arabidopsis leaves

Affiliations

Combination of long-term 13CO2 labeling and isotopolog profiling allows turnover analysis of photosynthetic pigments in Arabidopsis leaves

Anh Thi-Mai Banh et al. Plant Methods. .

Abstract

Background: Living cells maintain and adjust structural and functional integrity by continual synthesis and degradation of metabolites and macromolecules. The maintenance and adjustment of thylakoid membrane involve turnover of photosynthetic pigments along with subunits of protein complexes. Quantifying their turnover is essential to understand the mechanisms of homeostasis and long-term acclimation of photosynthetic apparatus. Here we report methods combining whole-plant long-term 13CO2 labeling and liquid chromatography - mass spectrometry (LC-MS) analysis to determine the size of non-labeled population (NLP) of carotenoids and chlorophylls (Chl) in leaf pigment extracts of partially 13C-labeled plants.

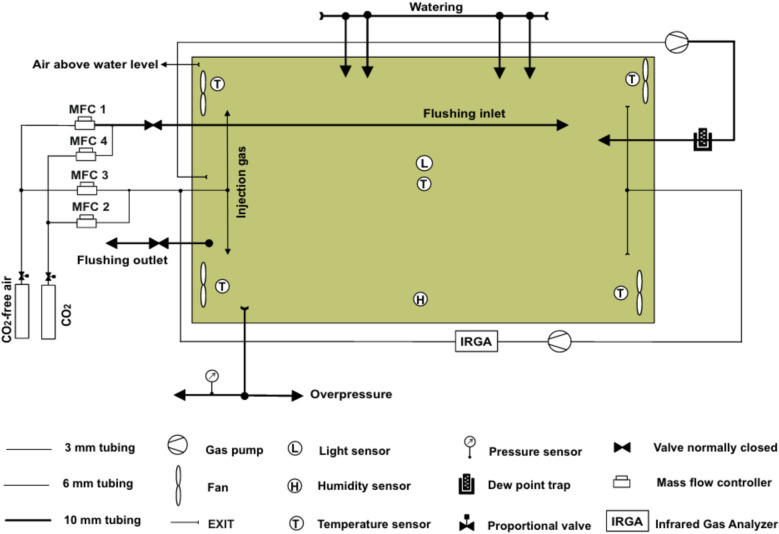
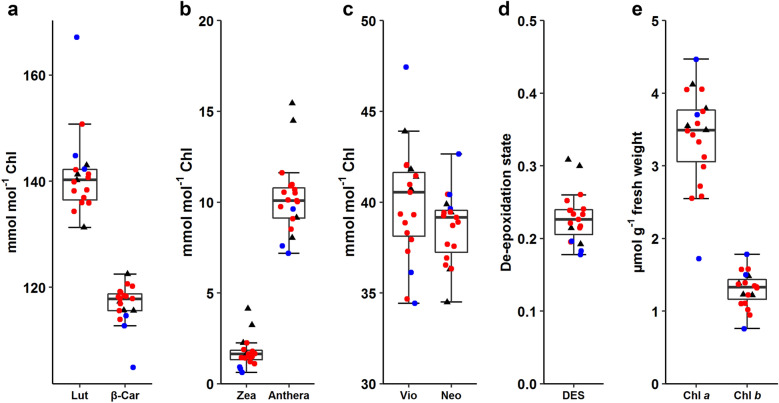
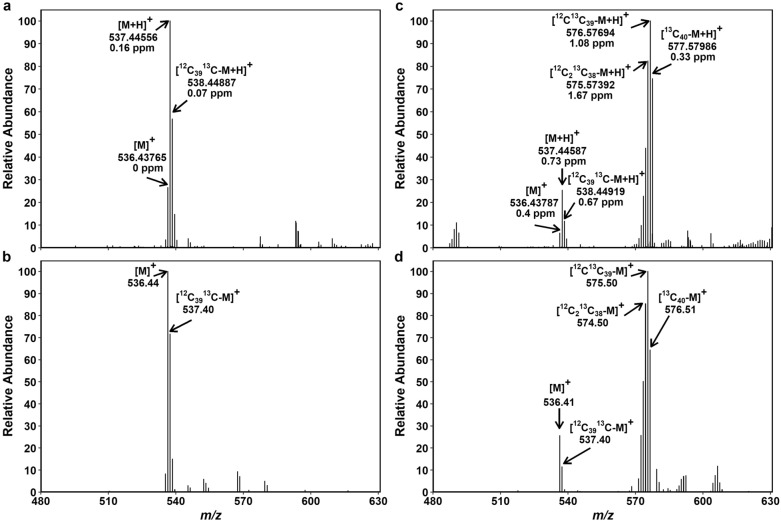
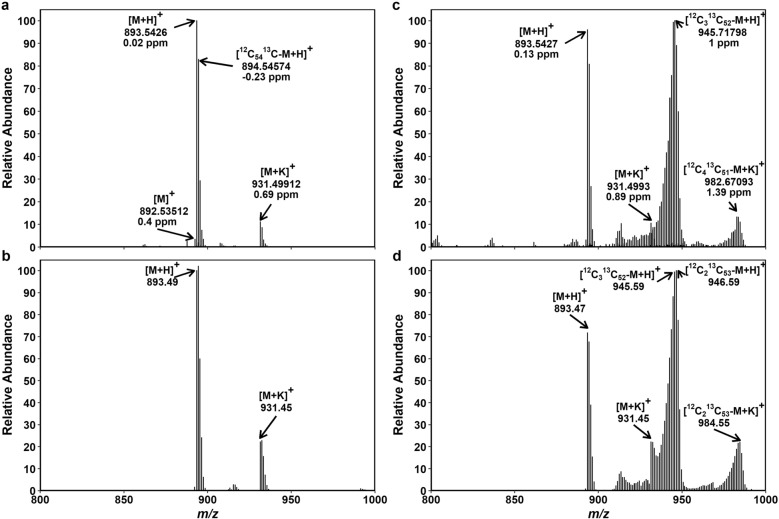
Results: The labeling chamber enabled parallel 13CO2 labeling of up to 15 plants of Arabidopsis thaliana with real-time environmental monitoring ([CO2], light intensity, temperature, relative air humidity and pressure) and recording. No significant difference in growth or photosynthetic pigment composition was found in leaves after 7-d exposure to normal CO2 (~ 400 ppm) or 13CO2 in the labeling chamber, or in ambient air outside the labeling chamber (control). Following chromatographic separation of the pigments and mass peak assignment by high-resolution Fourier-transform ion cyclotron resonance MS, mass spectra of photosynthetic pigments were analyzed by triple quadrupole MS to calculate NLP. The size of NLP remaining after the 7-d 13CO2 labeling was ~ 10.3% and ~ 11.5% for all-trans- and 9-cis-β-carotene, ~ 21.9% for lutein, ~ 18.8% for Chl a and 33.6% for Chl b, highlighting non-uniform turnover of these pigments in thylakoids. Comparable results were obtained in all replicate plants of the 13CO2 labeling experiment except for three that were showing anthocyanin accumulation and growth impairment due to insufficient water supply (leading to stomatal closure and less 13C incorporation).

Conclusions: Our methods allow 13CO2 labeling and estimation of NLP for photosynthetic pigments with high reproducibility despite potential variations in [13CO2] between the experiments. The results indicate distinct turnover rates of carotenoids and Chls in thylakoid membrane, which can be investigated in the future by time course experiments. Since 13C enrichment can be measured in a range of compounds, long-term 13CO2 labeling chamber, in combination with appropriate MS methods, facilitates turnover analysis of various metabolites and macromolecules in plants on a time scale of hours to days.

Keywords: 13CO2; Carotene; Carotenoids; Chlorophyll; Lutein; Pigment metabolism; Stable isotope labeling; Turnover.


Conflict of interest statement

The authors declare that they have no competing interests.

Figures

Fig. 1
Fig. 1
Schematic overview of the 13CO2 labeling chamber. The devices to control CO2 concentration (mass flow controller, MFC) and air humidity (dew point trap) are depicted along with the sensors for CO2 (infrared gas analyzer, IRGA), temperature, humidity, light intensity and pressure. The colored background shows the chamber area (top view). The arrows indicate the directions of air (or water) flow. The size of the arrows and the thickness of the lines correspond to the inner diameter of tubing (polytetrafluoroethylene or metal)
Fig. 2
Fig. 2
Plant positions in the labeling chamber. a The positions of 15 plants (P1–P15) and the light intensity (in µmol photon m−2 s−1) distribution measured in and around each plant position without the glass cover of the labeling chamber. The light intensity thus measured was ranging between 204 (P15) and 279 (P7) µmol photon m−2 s−1 among the 15 positions, with the mean intensity of 238 µmol photon m−2 s−1. b A picture of the closed labeling chamber with 15 Arabidopsis plants placed under LED lamps in a controlled climate chamber. The bottom of the plant cups (see Additional file 1: Fig. S1 for description of the plant cup) was touching the water in a shallow basin attached to the lower surface of the chamber body. The basin can be filled and drained through watering tubes (seen in the front) without opening the chamber
Fig. 3
Fig. 3
Concentrations of photosynthetic pigments in Arabidopsis plants harvested in the early morning of day 8. a Lutein (Lut) and all-trans-β-carotene (β-Car). b Zeaxanthin (Zea) and antheraxanthin (Anthera). c Violaxanthin (Vio) and neoxanthin (Neo). Carotenoid levels relative to the total chlorophyll content (mmol mol−1 Chl) are shown. d De-epoxidation state (DES) of the xanthophyll cycle calculated as (Anthera + Zea)/(Vio + Anthera + Zea). e Chlorophyll a (Chl a) and chlorophyll b (Chl b) contents per unit leaf mass (μmol g−1 fresh weight). Black triangles represent control plants (n = 4) that stayed in the ambient air outside the labeling chamber. For 13C-labeled samples, red and blue symbols are for plants with higher (n = 12) or lower (n = 3) 13C incorporation in the pigments, respectively. The latter showed visible stress symptoms (see Additional file 1: Fig. S3b for images of the plants). The box plots are based on all data. The thick horizontal line inside the box shows the median. The middle 50% of the data fall between the upper and lower end of the box. Data beyond the whisker boundaries are outliers
Fig. 4
Fig. 4
Chromatograms of a 13C-labeled Arabidopsis leaf pigment sample obtained by LC-TQ-MS. a Pigment separation monitored at 440 nm. The pigment peaks are numbered as follows: 1, Vio; 2, 9-cis-Neo; 3, Anthera; 4, Chl b; 5, Lut; 6, Zea (if present); 7, Chl a; 8, all-trans-β-Car; 9, 9-cis-β-Car. This sample had a very small amount of Anthera and hardly any Zea. In the same sample, selected ions were monitored at specific mass-to-charge (m/z) values: b Vio and 9-cis-Neo; c Anthera; d Chl b; e Lut (and Zea if present); f Chl a; g all-trans- and 9-cis-β-Car. Xanthophylls, especially Lut, tend to lose water upon protonation in positive ion mode
Fig. 5
Fig. 5
Mass spectra of all-trans-β-Car extracted from non-labeled and 13C-labeled Arabidopsis plants. FTICR-MS showing two types of quasi-molecular ions of β-Car, [M]+ and [M + H]+, in a non-labeled (a) and a 13C-labeled (c) sample. Deviations from the expected mass (Δ) are given in parts per million (ppm). TQ-MS in the same non-labeled (b) and 13C-labeled (d) samples as in a and c. Overlapping mass peaks of [M]+ and [M + H]+ ions are regarded as [M + H]+ or [M]+ in the analysis of FTICR-MS and TQ-MS, respectively. Peak assignment of these data is summarized in Additional file 2: Tables S3–S6. Theoretical distribution of carotenoid isotopologs based on natural 13C abundance (~ 1.1%) is presented in Additional file 1: Fig. S8
Fig. 6
Fig. 6
Mass spectra of Lut extracted from non-labeled and 13C-labeled Arabidopsis plants. FTICR-MS showing four different types of quasi-molecular ions of Lut, [M + H–2H2O]+, [M + H–H2O]+, [M]+ and [M + H]+, in a non-labeled (a) and a 13C-labeled (c) sample. Small peaks of 13C-labeled [M + H–2H2O]+ ion were detected in the same m/z region as non-labelled [M]+ and [M + H]+ ions in c. Deviations from the expected mass (Δ) are given in ppm. TQ-MS showing four types of quasi-molecular ions, [M + H–2H2O]+, [M + H–H2O]+, [M]+ and [M + H]+, in the same non-labeled (b) and 13C-labeled (d) samples as in a and c. Since TQ-MS cannot separate overlapping peaks of non-labeled [M]+ and [M + H]+ at m/z 569–571 and 13C-labeled [M]+ and [M + H]+ at m/z 607–608, they are regarded as [M + H]+. Peak assignment of these data is summarized in Additional file 2: Tables S7–S10
Fig. 7
Fig. 7
Mass spectra of Chl a extracted from non-labeled and 13C-labeled Arabidopsis plants. FTICR-MS showing three types of quasi-molecular ions of Chl a, [M]+, [M + H]+ and [M + K]+, in a non-labeled (a) and a 13C-labeled (c) sample. Deviations from the expected mass (Δ) are given in ppm. TQ-MS showing two types of quasi-molecular ions, [M + H]+ and [M + K]+, in the same non-labeled (b) and 13C-labeled (d) samples as in a and c. The [M]+ peak was hardly detected and thus not considered in the analysis of TQ-MS data. Mass peaks of 13C-labeled [M + H]+ and non-labeled [M + K]+ were overlapping at m/z 931–933 in d. The contribution of non-labeled [M + K]+ in this m/z region was estimated from the intensity of non-labeled [M + H]+ peaks and the ratio between [M + H]+ and [M + K]+ peaks found in b (1:0.26). For Chl, natural abundance of Mg isotopes (24Mg 79%, 25Mg 10% and 26Mg 11%) was taken into account to calculate their contributions to each mass peak. The estimated peak intensity of 24Mg-Chl as [M + H]+ was then considered representative of Chl a in the analysis of TQ-MS data. Peak assignment of these data is summarized in Additional file 2: Tables S11–S14
Fig. 8
Fig. 8
Mass spectra of Chl b extracted from non-labeled and 13C-labeled Arabidopsis leaves. FTICR-MS showing two types of quasi-molecular ions of Chl b, [M]+ and [M + H]+, in a non-labeled (a) and a 13C-labeled (c) sample. Deviations from the expected mass (Δ) are given in ppm. TQ-MS showing two types of quasi-molecular ions, [M + H]+ and [M + K]+, in the same non-labeled (b) and 13C-labeled (d) samples as in a and c. The [M]+ peak was hardly detected and thus not considered in the analysis of TQ-MS data. Mass peaks of 13C-labeled [M + H]+ and non-labeled [M + K]+ were overlapping at m/z 945–948 in d. The contribution of non-labeled [M + K]+ in this m/z region was estimated from the intensity of non-labeled [M + H]+ peaks and the ratio between [M + H]+ and [M + K]+ peaks found in b (1:0.74). For Chl, natural abundance of Mg isotopes (24Mg 79%, 25Mg 10% and 26Mg 11%) was taken into account to calculate their contributions to each mass peak. The estimated mass peak intensity of 24Mg-Chl as [M + H]+ was then considered representative of Chl b in the analysis of TQ-MS data. Peak assignment of these data is summarized in Additional file 2: Tables S15–S18
Fig. 9
Fig. 9
Labeled and non-labeled pigments in 13C-labeled Arabidopsis leaves harvested after 7-d 13CO2 labeling. a Degree of 13C labeling (ΣDoL) and b non-labeled pigment population (NLP) of all-trans- and 9-cis-β-Car, Lut, Chl a and Chl b. Red and blue symbols represent plants that had higher (n = 12) or lower (n = 3) 13C incorporation in pigments, respectively. Black triangles in a are control plants (n = 4) that stayed in the ambient air outside the labeling chamber. Data of the control plants are not shown in b since they all had 100% NLP. The box plots are based on the data of the 13C-labeled samples (i.e., red and blue symbols); the control plants (black triangles) shown in a are not included in the box plots. The thick horizontal line inside the box shows the median. The middle 50% of the data fall between the upper and lower end of the box. Data beyond the whisker boundaries are outliers
Fig. 10
Fig. 10
Correlation between non-labeled population (NLP) of pigments extracted from Arabidopsis leaves after 7-d 13CO2 labeling. a Chl a and Chl b. b All-trans-β-Car and Lut. c Chl a and all-trans-β-Car. d Chl b and Lut. Red and blue symbols represent plants that had higher (n = 12) or lower (n = 3) 13C incorporation in pigments, respectively

Similar articles

References

    1. Penning de Vries FWT The cost of maintenance processes in plant cells. Ann Bot. 1975;39:77–92. doi: 10.1093/oxfordjournals.aob.a084919. - DOI
    1. Nelson CJ, Alexova R, Jacoby RP, Millar AH. Proteins with high turnover rate in barley leaves estimated by proteome analysis combined with in planta isotope labeling. Plant Physiol. 2014;166:91–108. doi: 10.1104/pp.114.243014. - DOI - PMC - PubMed
    1. Li L, Nelson CJ, Trösch J, Castleden I, Huang S, Millar AH. Protein degradation rate in Arabidopsis thaliana leaf growth and development. Plant Cell. 2017;29:207–228. doi: 10.1105/tpc.16.00768. - DOI - PMC - PubMed
    1. Chatterjee A, Abeydeera ND, Bale S, Pai P-J, Dorrestein PC, Russel DH, Ealick SE, Begley TP. Saccharomyces cerevisiae THI4p is a suicide thiamine thiazole synthase. Nature. 2011;478:542–546. doi: 10.1038/nature10503. - DOI - PMC - PubMed
    1. Fitzpatrick TB, Chapman LM. The importance of thiamine (vitamin B1) in plant health: From crop yield to biofortification. J Biol Chem. 2020;295(34):12002–12013. doi: 10.1074/jbc.REV120.010918. - DOI - PMC - PubMed

LinkOut - more resources