

Developing Photoaffinity Probes for Dopamine Receptor D2 to Determine Targets of Parkinson's Disease Drugs
- PMID: 36183275
- PMCID: PMC9585581
- DOI: 10.1021/acschemneuro.2c00544
Developing Photoaffinity Probes for Dopamine Receptor D2 to Determine Targets of Parkinson's Disease Drugs
Abstract
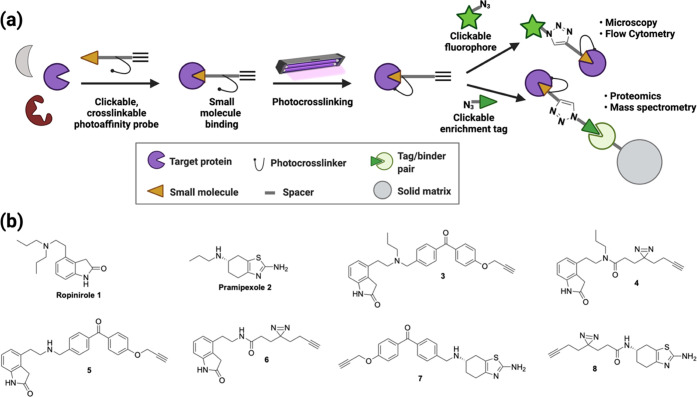
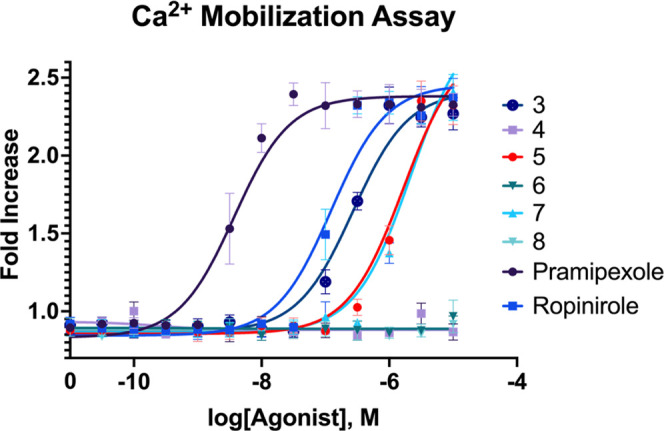
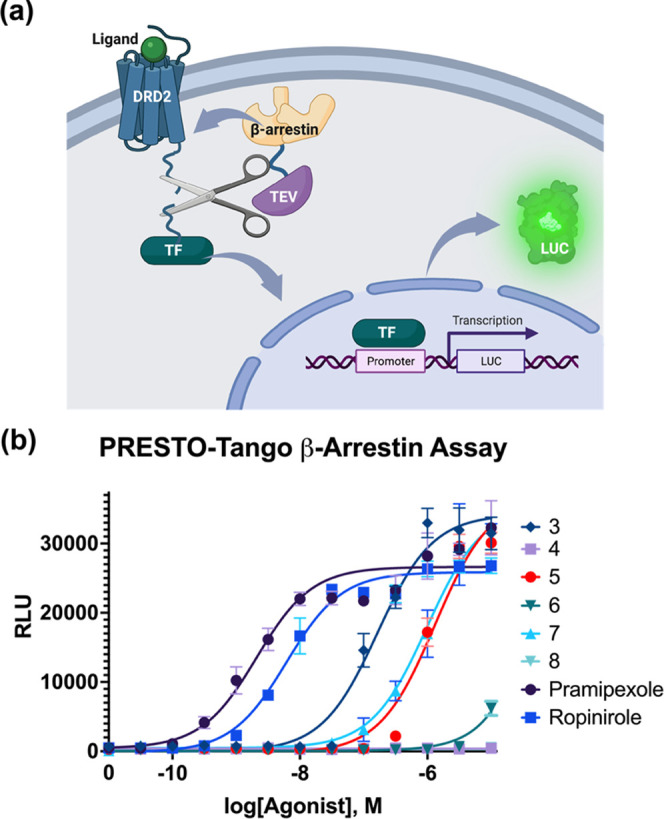
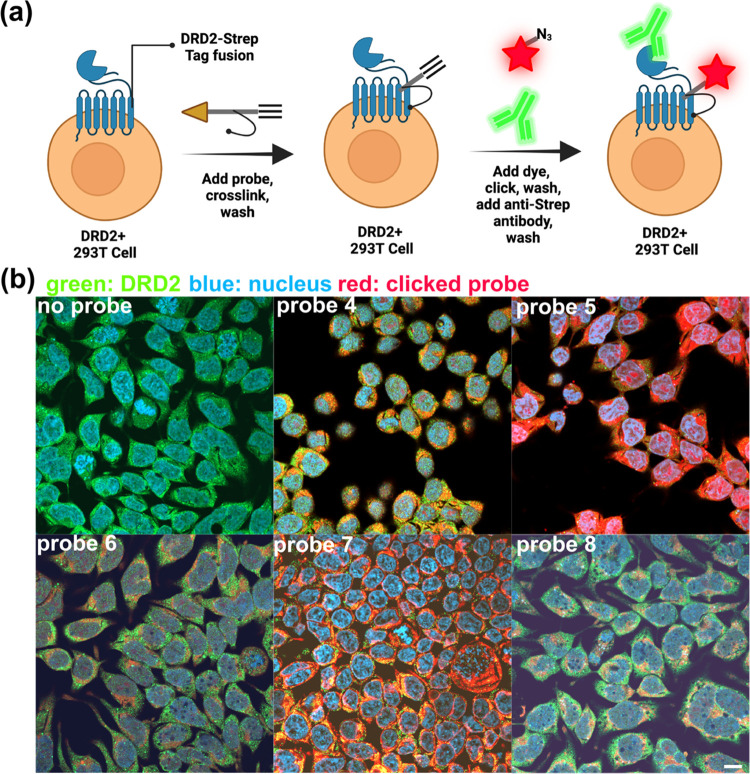
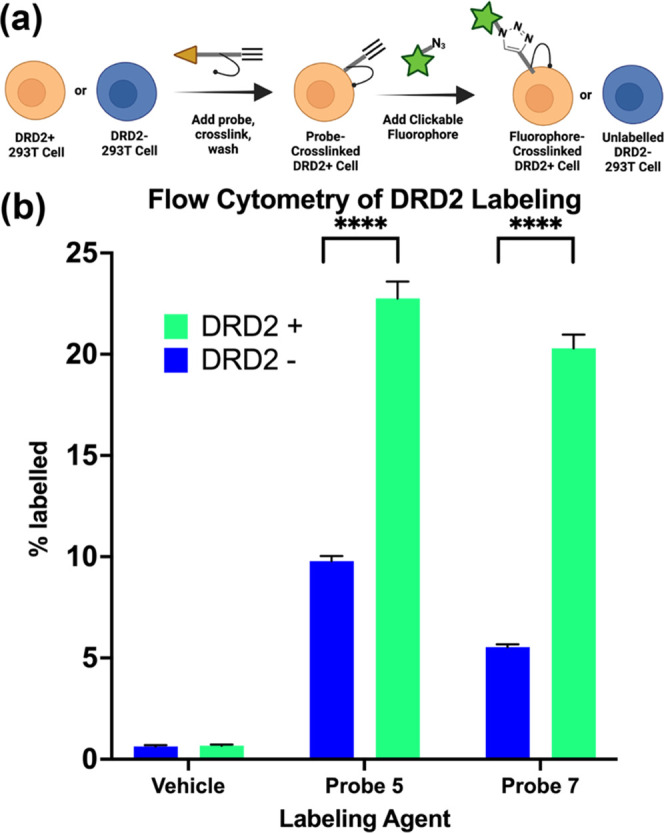
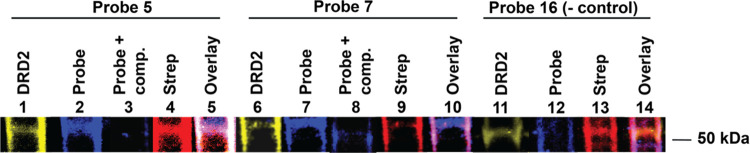
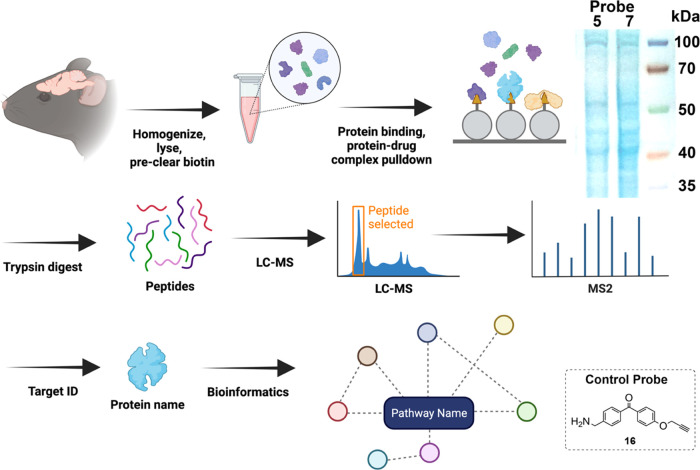
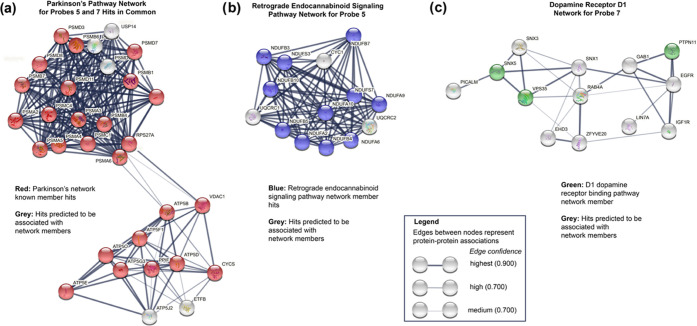
Dopaminergic pathways control highly consequential aspects of physiology and behavior. One of the most therapeutically important and best-studied receptors in these pathways is dopamine receptor D2 (DRD2). Unfortunately, DRD2 is challenging to study with traditional molecular biological techniques, and most drugs designed to target DRD2 are ligands for many other receptors. Here, we developed probes able to both covalently bind to DRD2 using photoaffinity labeling and provide a chemical handle for detection or affinity purification. These probes behaved like good DRD2 agonists in traditional biochemical assays and were able to perform in chemical-biological assays of cell and receptor labeling. Rat whole brain labeling and affinity enrichment using the probes permitted proteomic analysis of the probes' interacting proteins. Bioinformatic study of the hits revealed that the probes bound noncanonically targeted proteins in Parkinson's disease network as well as the retrograde endocannabinoid signaling, neuronal nitric oxide synthase, muscarinic acetylcholine receptor M1, GABA receptor, and dopamine receptor D1 (DRD1) signaling networks. Follow-up analysis may yield insights into how this pathway relates specifically to Parkinson's disease symptoms or provide new targets for treatments. This work reinforces the notion that the combination of chemical biology and omics-based approaches provides a broad picture of a molecule's "interactome" and may also give insight into the pleiotropy of effects observed for a drug or perhaps indicate new applications.
Keywords: DRD2; GABA receptor; bioinformatics; dopamine receptors; endocannabinoid pathway; muscarinic receptor M1; photo-cross-linking; photoaffinity labeling (PAL); pramipexole; proteomics; ropinirole.
Conflict of interest statement
The authors declare no competing financial interest.
Figures
Similar articles
-
Dopamine agonists, receptor selectivity and dyskinesia induction in Parkinson's disease.Curr Opin Neurol. 2003 Dec;16 Suppl 1:S3-7. doi: 10.1097/00019052-200312001-00002. Curr Opin Neurol. 2003. PMID: 15180131 Review.
-
In vivo dopamine agonist properties of rotigotine: Role of D1 and D2 receptors.Eur J Pharmacol. 2016 Oct 5;788:183-191. doi: 10.1016/j.ejphar.2016.06.035. Epub 2016 Jun 22. Eur J Pharmacol. 2016. PMID: 27343381
-
Evidence that the BLOC-1 protein dysbindin modulates dopamine D2 receptor internalization and signaling but not D1 internalization.J Neurosci. 2007 Nov 7;27(45):12390-5. doi: 10.1523/JNEUROSCI.1689-07.2007. J Neurosci. 2007. PMID: 17989303 Free PMC article.
-
Pramipexole regulates depression-like behavior via dopamine D3 receptor in a mouse model of Parkinson's disease.Brain Res Bull. 2021 Dec;177:363-372. doi: 10.1016/j.brainresbull.2021.10.015. Epub 2021 Oct 24. Brain Res Bull. 2021. PMID: 34699917
-
Synergistic interactions of D1- and D2-selective dopamine agonists in animal models for Parkinson's disease: sites of action and implications for the pathogenesis of dyskinesias.Can J Neurol Sci. 1992 Feb;19(1 Suppl):147-52. Can J Neurol Sci. 1992. PMID: 1349263 Review.
Cited by
-
Labeling of CC Chemokine Receptor 2 with a Versatile Intracellular Allosteric Probe.ACS Chem Biol. 2024 Sep 20;19(9):2070-2080. doi: 10.1021/acschembio.4c00439. Epub 2024 Aug 26. ACS Chem Biol. 2024. PMID: 39186040 Free PMC article.
-
Detecting and measuring of GPCR signaling - comparison of human induced pluripotent stem cells and immortal cell lines.Front Endocrinol (Lausanne). 2023 May 24;14:1179600. doi: 10.3389/fendo.2023.1179600. eCollection 2023. Front Endocrinol (Lausanne). 2023. PMID: 37293485 Free PMC article. Review.
-
Short and High-Yielding Synthesis of a Minimalist Diazirine-Alkyne Photo-Cross-Linker and Photoaffinity Labeling Derivatives.ACS Omega. 2025 Jan 22;10(4):3622-3626. doi: 10.1021/acsomega.4c08497. eCollection 2025 Feb 4. ACS Omega. 2025. PMID: 39926512 Free PMC article.
-
Covalent functionalization of G protein-coupled receptors by small molecular probes.RSC Chem Biol. 2025 Feb 14;6(4):528-538. doi: 10.1039/d4cb00294f. eCollection 2025 Apr 2. RSC Chem Biol. 2025. PMID: 39957994 Free PMC article. Review.
-
Development of an Affinity-Based Probe to Profile Endogenous Human Adenosine A3 Receptor Expression.J Med Chem. 2023 Aug 24;66(16):11399-11413. doi: 10.1021/acs.jmedchem.3c00854. Epub 2023 Aug 2. J Med Chem. 2023. PMID: 37531576 Free PMC article.
References
-
- Stahl S. M.Stahl’s Essential Psychopharmacology: Neuroscientific Basis and Practical Application, 4th ed.; Cambridge University Press: Cambridge; New York, 2013.
-
- Ariano M. A.; Monsma F. J.; Barton A. C.; Kang H. C.; Haugland R. P.; Sibley D. R. Direct Visualization and Cellular Localization of D1 and D2 Dopamine Receptors in Rat Forebrain by Use of Fluorescent Ligands. Proc. Natl. Acad. Sci. U.S.A. 1989, 86, 8570–8574. 10.1073/pnas.86.21.8570. - DOI - PMC - PubMed
Publication types
MeSH terms
Substances
LinkOut - more resources
Full Text Sources
Medical
Research Materials
