

Physical activity phenotypes and mortality in older adults: a novel distributional data analysis of accelerometry in the NHANES
- PMID: 36183279
- PMCID: PMC9719452
- DOI: 10.1007/s40520-022-02260-3
Physical activity phenotypes and mortality in older adults: a novel distributional data analysis of accelerometry in the NHANES
Abstract
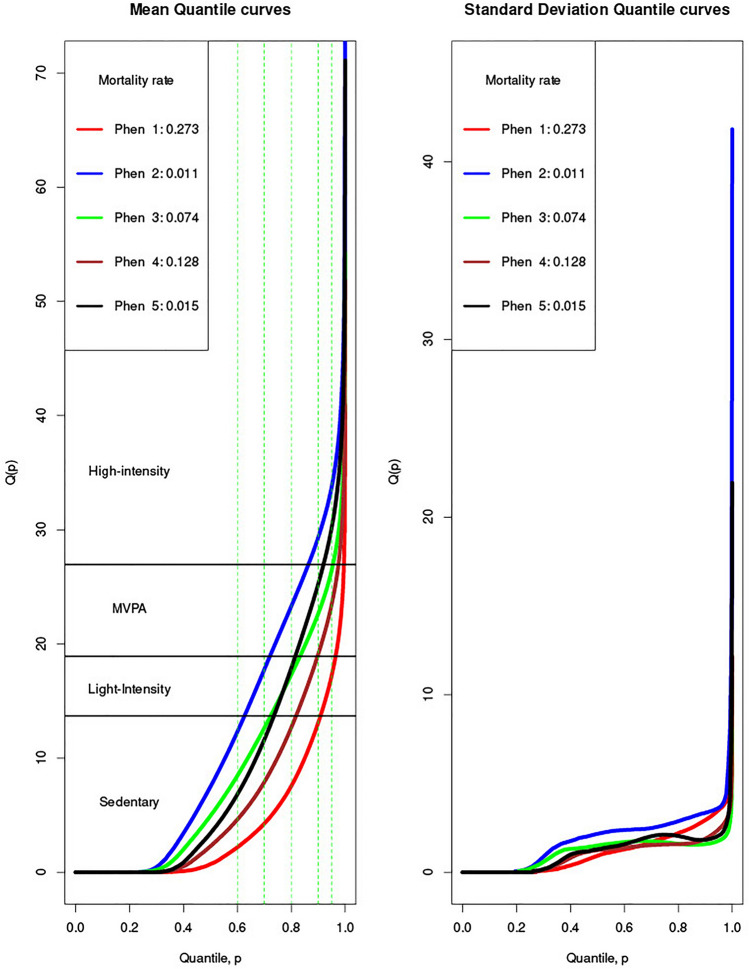
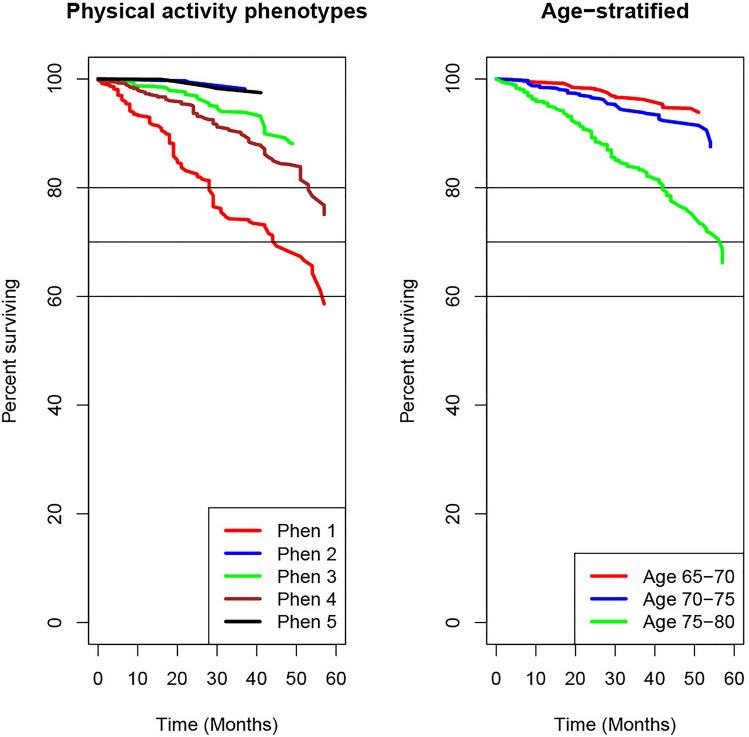
Physical activity is deemed critical to successful ageing. Despite evidence and progress, there is still a need to determine more precisely the direction, magnitude, intensity, and volume of physical activity that should be performed on a daily basis to effectively promote the health of individuals. This study aimed to assess the clinical validity of new physical activity phenotypes derived from a novel distributional functional analysis of accelerometer data in older adults. A random sample of participants aged between 65 and 80 years with valid accelerometer data from the National Health and Nutrition Examination Survey (NHANES) 2011-2014 was used. Five major clinical phenotypes were identified, which provided a greater sensitivity for predicting 5-year mortality and survival outcomes than age alone, and our results confirm the importance of moderate-to-vigorous physical activity. The new clinical physical activity phenotypes are a promising tool for improving patient prognosis and for directing to more targeted intervention planning, according to the principles of precision medicine. The use of distributional representations shows clear advantages over more traditional metrics to explore the effects of the full spectrum of the physical activity continuum on human health.
Keywords: Accelerometry; Distributional representation; Longevity; Physical activity; Precision medicine.
© 2022. The Author(s).
Conflict of interest statement
The authors declare that there is no conflict of interest.
Figures
Similar articles
-
Exploring the association between daily distributional patterns of physical activity and cardiovascular mortality risk among older adults in NHANES 2003-2006.Ann Epidemiol. 2024 Nov;99:24-31. doi: 10.1016/j.annepidem.2024.10.001. Epub 2024 Oct 3. Ann Epidemiol. 2024. PMID: 39368524
-
The Predictive Performance of Objective Measures of Physical Activity Derived From Accelerometry Data for 5-Year All-Cause Mortality in Older Adults: National Health and Nutritional Examination Survey 2003-2006.J Gerontol A Biol Sci Med Sci. 2020 Sep 16;75(9):1779-1785. doi: 10.1093/gerona/glz193. J Gerontol A Biol Sci Med Sci. 2020. PMID: 31504213 Free PMC article.
-
Improving wear time compliance with a 24-hour waist-worn accelerometer protocol in the International Study of Childhood Obesity, Lifestyle and the Environment (ISCOLE).Int J Behav Nutr Phys Act. 2015 Feb 11;12:11. doi: 10.1186/s12966-015-0172-x. Int J Behav Nutr Phys Act. 2015. PMID: 25881074 Free PMC article.
-
Accelerometer-measured dose-response for physical activity, sedentary time, and mortality in US adults.Am J Clin Nutr. 2016 Nov;104(5):1424-1432. doi: 10.3945/ajcn.116.135129. Epub 2016 Oct 5. Am J Clin Nutr. 2016. PMID: 27707702 Free PMC article.
-
Adding web-based behavioural support to exercise referral schemes for inactive adults with chronic health conditions: the e-coachER RCT.Health Technol Assess. 2020 Nov;24(63):1-106. doi: 10.3310/hta24630. Health Technol Assess. 2020. PMID: 33243368 Free PMC article. Clinical Trial.
Cited by
-
Association between profiles of accelerometer-measured daily movement behaviour and mortality risk: a prospective cohort study of British older adults.BMJ Open Sport Exerc Med. 2024 Jun 27;10(2):e001873. doi: 10.1136/bmjsem-2023-001873. eCollection 2024. BMJ Open Sport Exerc Med. 2024. PMID: 38952852 Free PMC article.
-
Characterizing ActiGraph's Idle Sleep Mode in Free-living Assessments of Physical Behavior.J Meas Phys Behav. 2024 Jan;7(1):10.1123/jmpb.2023-0038. doi: 10.1123/jmpb.2023-0038. Epub 2024 Apr 2. J Meas Phys Behav. 2024. PMID: 39478833 Free PMC article. No abstract available.
-
Investigating the value of glucodensity analysis of continuous glucose monitoring data in type 1 diabetes: an exploratory analysis.Front Clin Diabetes Healthc. 2023 Sep 11;4:1244613. doi: 10.3389/fcdhc.2023.1244613. eCollection 2023. Front Clin Diabetes Healthc. 2023. PMID: 37753312 Free PMC article.
-
Data Analytics in Physical Activity Studies With Accelerometers: Scoping Review.J Med Internet Res. 2024 Sep 11;26:e59497. doi: 10.2196/59497. J Med Internet Res. 2024. PMID: 39259962 Free PMC article.
References
-
- del Cruz BP, McGregor DE, del Pozo Cruz J, et al. Integrating sleep, physical activity, and diet quality to estimate all-cause mortality risk: a combined compositional clustering and survival analysis of the National Health and Nutrition Examination Survey 2005–2006 cycle. Am J Epidemiol. 2020;189:1057–1064. doi: 10.1093/aje/kwaa057. - DOI - PubMed
