. 2023 Jan 3:101:skac318.
doi: 10.1093/jas/skac318.

Regional epithelial cell diversity in the small intestine of pigs

Affiliations

Regional epithelial cell diversity in the small intestine of pigs

Jayne E Wiarda et al. J Anim Sci. .

Abstract

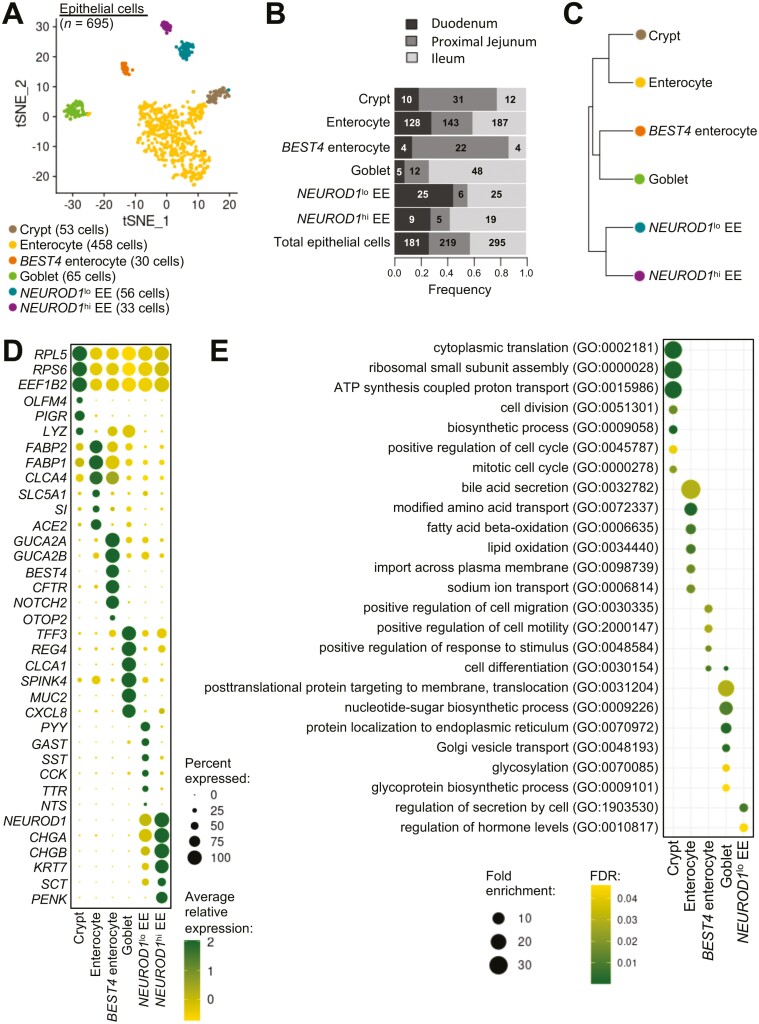
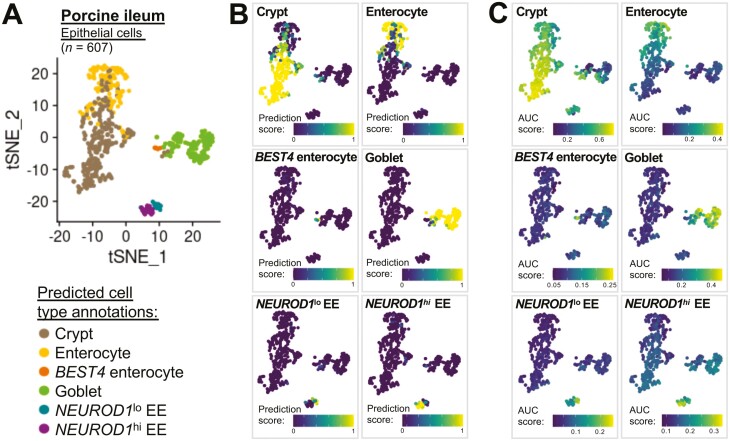
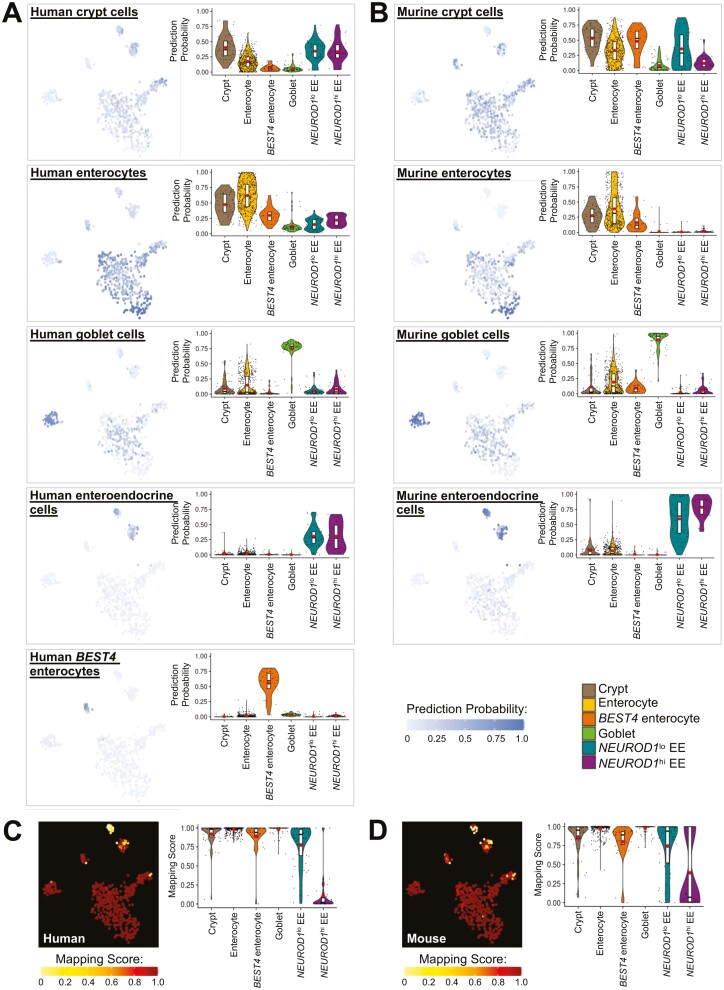
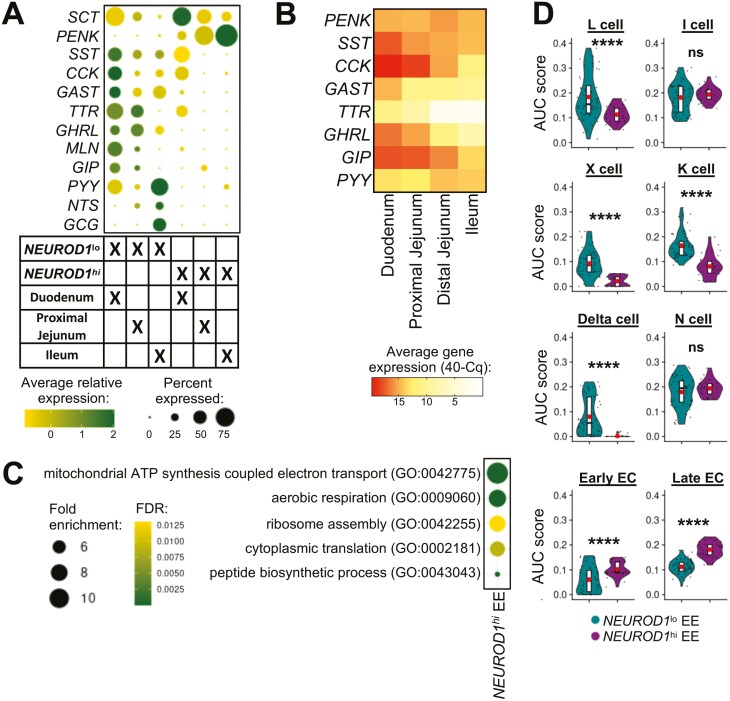
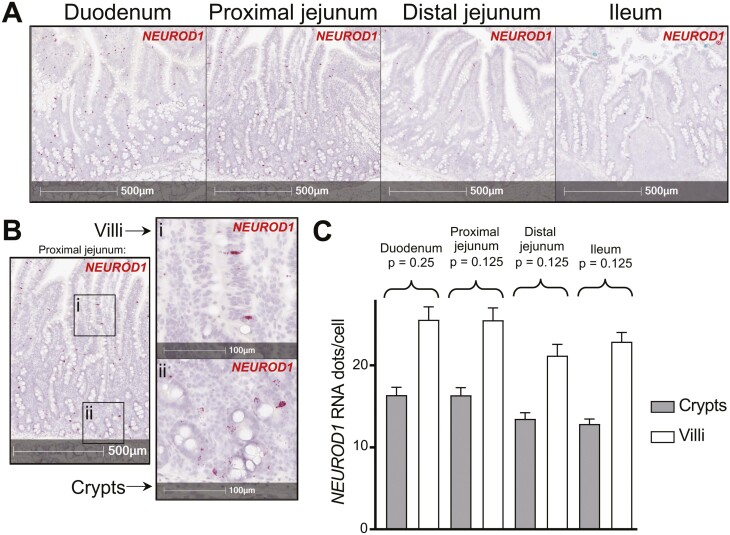
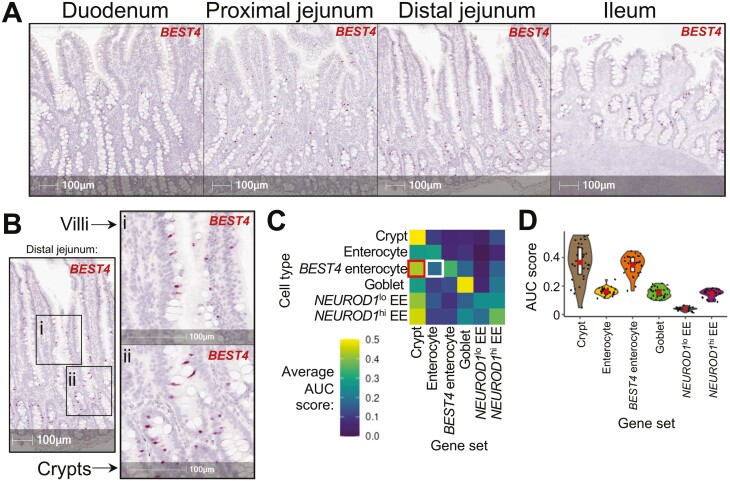
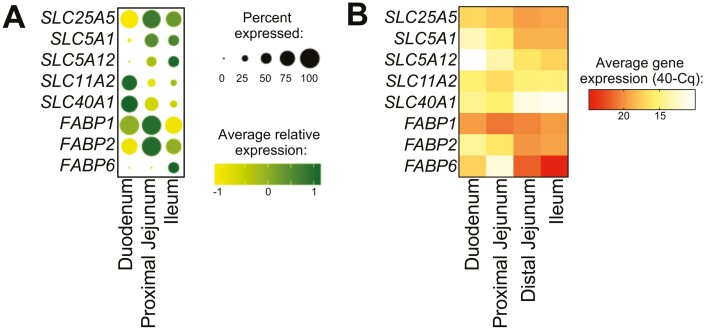
Understanding regional distribution and specialization of small intestinal epithelial cells is crucial for developing methods to control appetite, stress, and nutrient uptake in swine. To establish a better understanding of specific epithelial cells found across different regions of the small intestine in pigs, we utilized single-cell RNA sequencing (scRNA-seq) to recover and analyze epithelial cells from duodenum, jejunum, and ileum. Cells identified included crypt cells, enterocytes, BEST4 enterocytes, goblet cells, and enteroendocrine (EE) cells. EE cells were divided into two subsets based on the level of expression of the EE lineage commitment gene, NEUROD1. NEUROD1hi EE cells had minimal expression of hormone-encoding genes and were dissimilar to EE cells in humans and mice, indicating a subset of EE cells unique to pigs. Recently discovered BEST4 enterocytes were detected in both crypts and villi throughout the small intestine via in situ staining, unlike in humans, where BEST4 enterocytes are found only in small intestinal villi. Proximal-to-distal gradients of expression were noted for hormone-encoding genes in EE cells and nutrient transport genes in enterocytes via scRNA-seq, demonstrating regional specialization. Regional gene expression in EE cells and enterocytes was validated via quantitative PCR (qPCR) analysis of RNA isolated from epithelial cells of different small intestinal locations. Though many genes had similar patterns of regional expression when assessed by qPCR of total epithelial cells, some regional expression was only detected via scRNA-seq, highlighting advantages of scRNA-seq to deconvolute cell type-specific regional gene expression when compared to analysis of bulk samples. Overall, results provide new information on regional localization and transcriptional profiles of epithelial cells in the pig small intestine.

Keywords: BEST4 enterocyte; NEUROD1; enterochromaffin; enteroendocrine; porcine; single-cell RNA sequencing.

Plain language summary

Cells lining the intestinal tract (i.e., epithelial cells) provide a barrier to the outside environment but also play important specialized roles in nutrient absorption and secretion of mucus or hormones involved in controlling appetite and digestion. While similar cell types can be found throughout the small intestine, they have even more specialized function depending on region of the small intestine. Identification and characterization of intestinal epithelial cells are foundational to promoting pig intestinal health for optimal growth. Our research identified six types of epithelial cells across the small intestine of pigs. Enterocytes, an absorptive cell type, shared commonalities with human enterocytes, but a population of enteroendocrine cells, which secrete hormones, was unique to pigs. The location of certain epithelial cells in the intestine was identified and informed the relationship between various epithelial cell types. Overall, a clearer understanding of specific epithelial cells in the porcine intestine is provided, proving a critical foundation to further research aimed at maximizing pig intestinal health.


Conflict of interest statement

All opinions expressed in this article are of the authors' and do not necessarily reflect the policies and views of the supporting agencies.

Figures

Figure 1.
Figure 1.
Epithelial cell diversity in porcine small intestine revealed via scRNA-seq. (A) t-SNE plot of epithelial cells (N = 695) identified in small intestine of a female 7.5-wk-old pig. Each dot represents one cell. Dot color corresponds to epithelial cell type annotation. (B) Stacked bar plot of epithelial cell type distribution in duodenum, proximal jejunum, and ileum of cells shown in A. Each bar is normalized to a total cell frequency of one. Fill colors within bars indicate the proportion of cells derived from each intestinal location. The number of cells represented by each bar/color combination are denoted. (C) Dendrogram displaying hierarchical relatedness of annotated epithelial cell types shown in A. (D) Dot plot of selected differentially expressed genes (y-axis) from Supplementary Table S4 for each annotated epithelial cell type (x-axis) shown in A. Dot size corresponds to the percentage of cells expressing a gene. Dot color corresponds to average relative gene expression level within cells with positive gene expression. (E) Dot plot of selected enriched biological processes (y-axis) from Supplementary Table S5 for each annotated epithelial cell type (x-axis) shown in A. Dot size corresponds to the fold enrichment value of a process. Dot color corresponds to the FDR value of a process. No dot is present if a process was not enriched in a cell type. Data are derived from a female 7.5-wk-old pig (experiment 1). EE, enteroendocrine; exp, experiment; FDR, false discovery rate; t-SNE, t-distributed stochastic neighbor embedding.
Figure 2.
Figure 2.
Reference mapping and gene set enrichment across porcine ileum dataset enforces epithelial cell type identification and annotation. (A) t-SNE plot of epithelial cells (N = 607) identified in ileum of two 7-wk-old pigs (experiment 2). Each dot represents one cell. Dot color corresponds to predicted cell type identity (assigned by highest prediction scores) derived from cells in Figure 1 (experiment 1). (B) Overlay of cell type prediction probabilities onto cells in t-SNE plot shown in A. Titles of each plot correspond to predictions for cell types shown in Figure 1. Each dot represents one cell. Dot color corresponds to prediction probability for a respective cell type in each panel. The highest prediction probability was used to assign cell type identities shown in A. (C) Overlay of gene set enrichment scores onto cells in t-SNE plot shown in A. Titles of each plot correspond to gene sets for each cell type in Figure 1, with genes used in gene sets derived from Supplementary Table S4. Each dot represents one cell. Dot color corresponds to gene set enrichment scores for a respective gene set in each panel. Gene set enrichment scores are given as AUC scores that indicate the proportion of genes in a gene set that are present in the top 5% of genes expressed by an individual cell. AUC, area under the curve; EE, enteroendocrine; exp, experiment; t-SNE, t-distributed stochastic neighbor embedding.
Figure 3.
Figure 3.
Comparison of porcine small intestinal epithelial cells to human and mouse datasets. Prediction of annotated human (A) or murine (B) small intestinal epithelial cell types to porcine small intestinal epithelial cells shown in Figure 1 (experiment 1). Each panel shows prediction probabilities for a different human (A) or murine (B) epithelial cell type overlayed on t-SNE coordinates of porcine cells shown in Figure 1A (left) and summarized in a violin plot for each annotated porcine cell type shown in Figure 1 (right). In t-SNE plots, each dot represents one cell, and dot color corresponds to cell type prediction probability. In violin plots, cell types shown in Figure 1 are on the x-axis, and prediction probability values are on the y-axis. Individual black points represent single cells, the white bar represents the IQR, and the red dot represents the data mean. Violin colors corresponds to different epithelial cell types. Mapping of porcine small intestinal epithelial cells shown in Figure 1 (experiment 1) to human (C) or murine (D) small intestinal epithelial cell datasets. Mapping scores are overlaid onto t-SNE coordinates shown in Figure 1A (left) and summarized in a violin plot for each annotated porcine cell type shown in Figure 1 (right). In t-SNE plots, each dot represents one cell, and dot color corresponds to a mapping score assigned to each cell. In violin plots, cell types shown in Figure 1 are on the x-axis, and mapping score values are on the y-axis. Individual black points represent single cells, the white bar represents the IQR, and the red dot represents the data mean. Violin colors corresponds to different epithelial cell types. EE, enteroendocrine; exp, experiment; IQR, interquartile range; t-SNE, t-distributed stochastic neighbor embedding.
Figure 4.
Figure 4.
Regional expression of hormone-encoding genes by EE cells in the porcine small intestine. (A) Dot plot of hormone-encoding genes (y-axis) for EE cell subsets derived from duodenum, proximal jejunum, or ileum (x-axis), originally shown in Figure 1 (experiment 1). Dot size corresponds to the percentage of cells expressing a gene. Dot color corresponds to average relative gene expression level within cells with positive gene expression. (B) Heatmap of expression for hormone-encoding genes (y-axis) in epithelial cell fractions derived from duodenum, proximal jejunum, distal jejunum, and ileum (x-axis) of four 7-wk-old pigs (experiment 3). Average expression of genes is presented as 40-Cq, where a larger value (red) corresponds to higher gene expression. Cq values were generated using qPCR. Average raw Cq values for each gene within each tissue type are listed in Supplementary Table S6. (C) Dot plot of selected enriched biological processes (y-axis) from Supplementary Table S8 for NEUROD1hi EE cells (x-axis) compared to NEUROD1lo EE cells (experiment 1). Dot size corresponds to the fold enrichment value of a process. Dot color corresponds to the FDR value of a process. (D) Violin plots of AUC scores for murine EE cell gene sets in porcine NEUROD1hi and NEUROD1lo EE cells. AUC scores are only shown for porcine NEUROD1hi and NEUROD1lo EE cells identified in Figure 1 (experiment 1). Murine EE cell gene sets are indicated above each plot. AUC scores are on the y-axis. Individual black points represent single cells, the white bar represents the IQR, and the red dot represents the data mean. Violin color corresponds to NEUROD1lo (teal) and NEUROD1hi (purple) EE cells. AUC, area under the curve; Cq, quantification cycle; EE, enteroendocrine; exp, experiment; FDR, false discovery rate; qPCR, quantitative polymerase chain reaction.
Figure 5.
Figure 5.
Variable NEUROD1expression levels in EE cells located in villi vs. crypts of porcine small intestine. (A) In-situ staining of NEUROD1 gene expression (red) in histological transverse cross sections of duodenum, proximal jejunum, distal jejunum, and ileum from a 7-wk-old pig. Staining was performed on four animals (experiment 3) and was consistent across biological replicates. (B) Higher magnification images of NEUROD1 RNA staining (red) in crypts (bottom right) and villi (top right) of proximal jejunum shown in A. (C) Bar graph of the average number of NEUROD1 RNA dots occurring per cell in NEUROD1+ cells from crypts (gray bars) or villi (white bars) of duodenum, proximal jejunum, distal jejunum, and ileum of four 7-wk-old pigs (experiment 3). Statistical comparisons between crypt and villus cells within an intestinal location were performed by averaging together technical replicates (20 per sample) and performing a Wilcoxon matched-pairs signed rank test. P-values are reported for each intestinal region. Errors bars indicate SEM from all technical replicates within all samples. EE, enteroendocrine; exp, experiment; IQR, interquartile range; SEM, standard error of mean.
Figure 6.
Figure 6.
Small intestinal BEST4 enterocytes have overlapping localization and gene expression with crypt cells in pigs. (A) In-situ staining of BEST4 gene expression (red) in histological transverse cross sections of duodenum, proximal jejunum, distal jejunum, and ileum from a 7-wk-old pig. Staining was performed on four animals (experiment 3) and was consistent across biological replicates. (B) Higher magnification images of BEST4 RNA staining (red) in crypts (bottom right) and villi (top right) of distal jejunum shown in A. (C) Heatmap of the average AUC score, indicating enrichment of gene sets (for each cell type in Figure 1, with genes derived from Supplementary Table S4) within epithelial cell types (cell types shown in Figure 1). Fill color of a tile indicates the percentage of genes in a gene set (x-axis) that were on average found in the top 5% of genes expressed by a cell type (y-axis). (D) Violin plot of AUC scores for gene sets in BEST4 enterocytes. AUC scores are only shown for BEST4 enterocytes identified in Figure 1. Gene sets are shown on the x-axis, and AUC scores are on the y-axis. Individual black points represent single cells, the white bar represents the IQR, and the red dot represents the data mean. AUC, area under the curve, EE, enteroendocrine, exp, experiment; IQR, interquartile range.
Figure 7.
Figure 7.
Regional expression of solute-carrier (SLC) transporter and fatty acid-binding protein FABP genes in the porcine small intestine. (A) Dot plot of SLC transporter and FABP genes (y-axis) for enterocytes derived from duodenum, proximal jejunum, and ileum (x-axis) originally presented in scRNA-seq data of Figure 1 (experiment 1). Dot size corresponds to the percentage of cells expressing the indicated gene and dot color corresponds to average relative gene expression level within cells with positive gene expression. (B) Heatmap of average SLC transporter and FABP gene expression (y-axis) for epithelial cell fractions derived from duodenum, proximal jejunum, distal jejunum, and ileum (x-axis) of four 7-wk-old pigs (experiment 3). Gene expression is presented as average of 40-Cq, where a larger value (red) corresponds to higher gene expression. Average raw Cq values for each gene within each tissue are shown in Supplementary Table S6. Cq values were generated using qPCR. Cq, quantification cycle; exp, experiment; FABP, fatty acid-binding protein; qPCR, quantitative polymerase chain reaction; SLC, solute carrier.

Similar articles

Cited by

References

    1. Aibar, S., González-Blas C. B., Moerman T., Huynh-Thu V. A., Imrichova H., Hulselmans G., Rambow F., Marine J. -C., Geurts P., Aerts J.,. et al.. 2017. SCENIC: single-cell regulatory network inference and clustering. Nat. Methods 14:1083–1086. doi:10.1038/nmeth.4463 - DOI - PMC - PubMed
    1. Aladegbami, B., Barron L., Bao J., Colasanti J., Erwin C. R., Warner B. W., and Guo J... 2017. Epithelial cell specific Raptor is required for initiation of type 2 mucosal immunity in small intestine. Sci. Rep. 7:5580. doi:10.1038/s41598-017-06070-w - DOI - PMC - PubMed
    1. Allaire, J. M., Crowley S. M., Law H. T., Chang S. -Y., Ko H. -J., and Vallance B. A... 2018. The intestinal epithelium: central coordinator of mucosal immunity. Trends Immunol. 39:677–696. doi:10.1016/j.it.2018.04.002 - DOI - PubMed
    1. Borgstrom, A., Wider M., Marks W., Lloyd R., Herman G., and Vinik A... 1986. Immunohistochemical localization of a specific ileal peptide in the pig. Histochemistry 86:101–105. doi:10.1007/BF00492352 - DOI - PubMed
    1. Borisova, M. A., Achasova K. M., Morozova K. N., Andreyeva E. N., Litvinova E. A., Ogienko A. A., Morozova M. V., Berkaeva M. B., Kiseleva E., and Kozhevnikova E. N... 2020. Mucin-2 knockout is a model of intercellular junction defects, mitochondrial damage and ATP depletion in the intestinal epithelium. Sci. Rep. 10:21135. doi:10.1038/s41598-020-78141-4 - DOI - PMC - PubMed