

Air pollution exposure induces a decrease in type II interferon response: A paired cohort study
- PMID: 36183487
- PMCID: PMC9525814
- DOI: 10.1016/j.ebiom.2022.104291
Air pollution exposure induces a decrease in type II interferon response: A paired cohort study
Abstract
Background: While air pollution is a major issue due to its harmful effects on human health, few studies focus on its impact on the immune system and vulnerability to viral infections. The lockdown declared following the COVID-19 pandemic represents a unique opportunity to study the large-scale impact of variations in air pollutants in real life. We hypothesized that variations in air pollutants modify Th1 response represented by interferon (IFN) γ production.
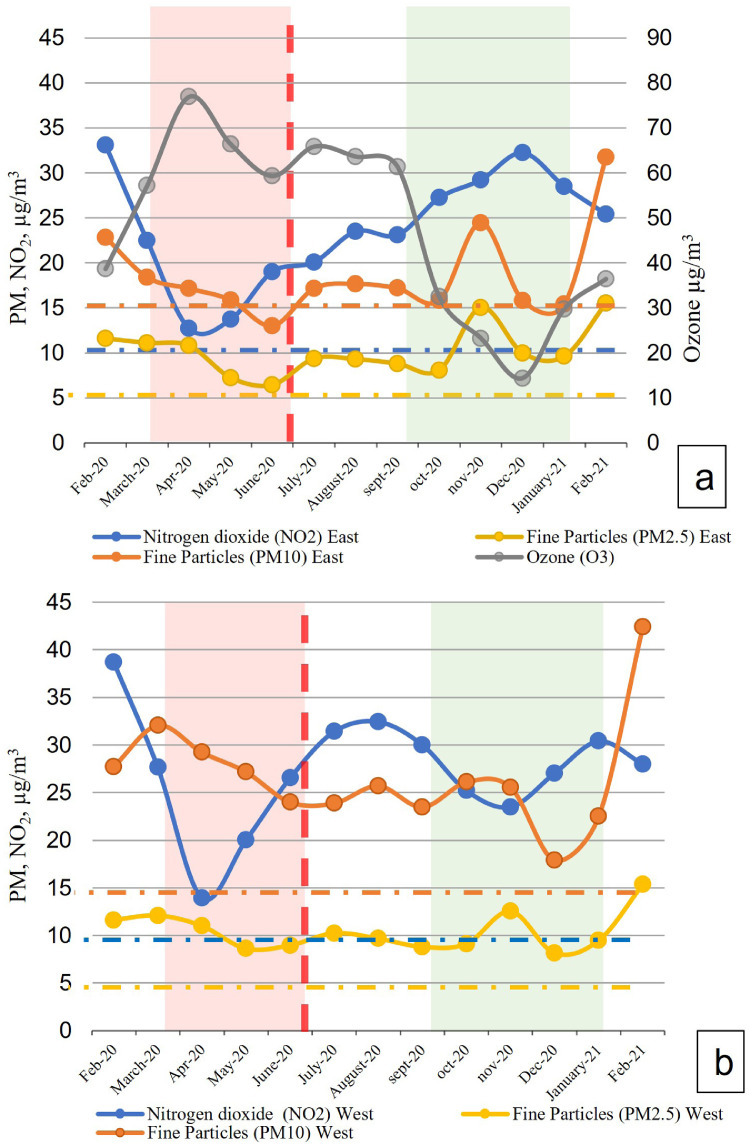
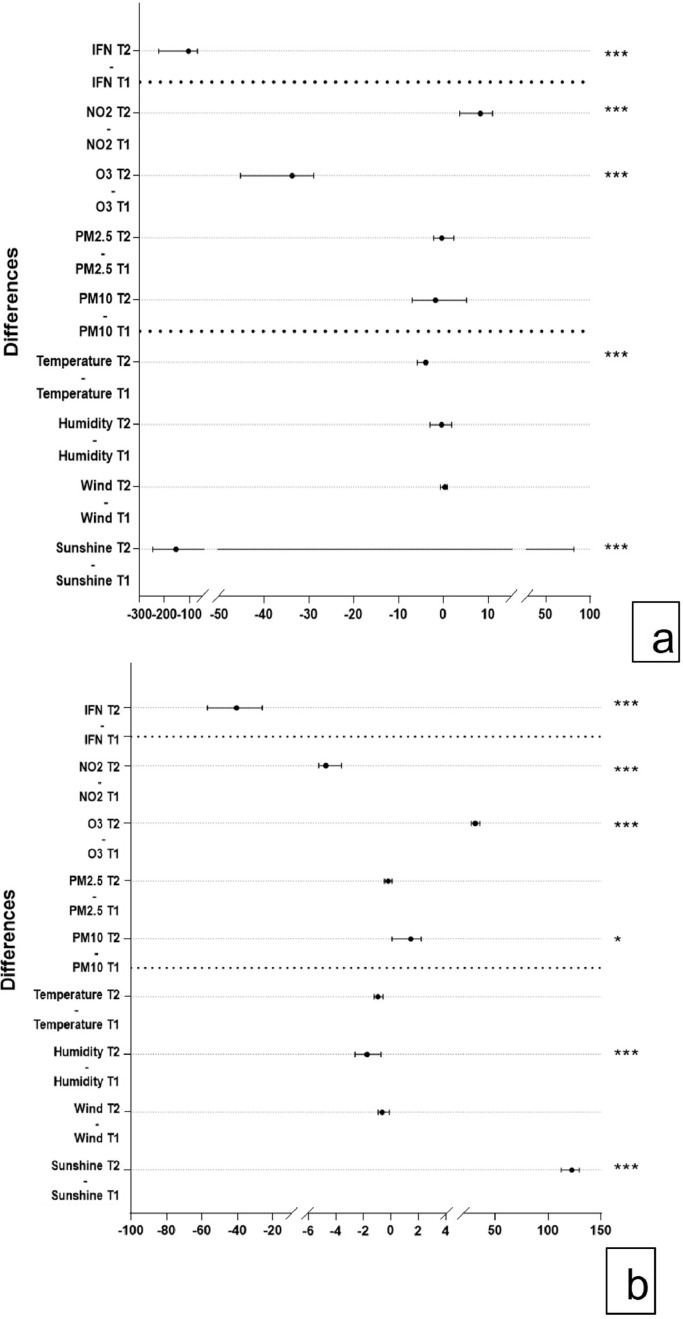
Methods: We conducted a single center paired pilot cohort study of 58 participants, and a confirmation cohort of 320 participants in Nice (France), with for each cohort two samplings at six months intervals. We correlated the variations in the production of IFNγ after non-specific stimulation of participants' immune cells with variations in key regulated pollutants: NO2, O3, PM2.5, and PM10 and climate variables. Using linear regression, we studied the effects of variations of each pollutant on the immune response.
Findings: In the pilot cohort, IFNγ production significantly decreased by 25.7% post-lockdown compared to during lockdown, while NO2 increased significantly by 46.0%. After the adjustment for climate variations during the study period (sunshine and temperature), we observed a significant effect of NO2 variation on IFNγ production (P=0.03). In the confirmation cohort IFNγ decreased significantly by 47.8% and after adjustment for environmental factors and intrinsic characteristics we observed a significant effect of environmental factors: NO2, PM10, O3, climatic conditions (sunshine exposure, relative humidity) on variation in IFNγ production (P=0.005, P<0.001, P=0.001, P=0.002 and P<0.001 respectively) but not independently from the BMI at inclusion and the workplace P=0.007 and P<0.001 respectively).
Interpretation: We show a weakening of the antiviral cellular response in correlation with an increase of pollutants exposition.
Funding: Agence Nationale de la Recherche, Conseil Départemental des Alpes-Maritimes and Region Sud.
Keywords: Air pollution; Immune response; Interferon gamma; Lockdown; Nitrogen dioxide.
Copyright © 2022 The Authors. Published by Elsevier B.V. All rights reserved.
Conflict of interest statement
Declaration of interests The authors declare no conflict of interest.
Figures


References
-
- Medina S, Wagner V. Impact de pollution de l'air ambiant sur la mortalité en France métropolitaine. Réduction en lien avec le confinement du printemps 2020 et nouvelles données sur le poids total pour la période 2016-2019. 2021 April; Available from: https://www.santepubliquefrance.fr/import/impact-de-pollution-de-l-air-a... [cited 2021 July 27].
-
- Lignes directrices OMS relatives à la qualité de l'air : particules, ozone, dioxyde d'azote et dioxyde de soufre.pdf. Available from: https://apps.who.int/iris/bitstream/handle/10665/69476/WHO_SDE_PHE_OEH_0... [cited 2022 January 24].
-
- Directive 2008/50/CE du Parlement européen et du Conseil du 21 mai 2008 concernant la qualité de l'air ambiant et un air pur pour l'Europe.
-
- Evaluation du Plan de Protection de l'Atmosphère des Alpes-Maritimes: 2013-2018. AtmoSud. 2018 Available from: https://www.atmosud.org/publications/evaluation-du-plan-de-protection-de... [cited 2021 August 30].
MeSH terms
Substances
LinkOut - more resources
Full Text Sources
Medical
