. 2022 Dec:26:101552.
doi: 10.1016/j.tranon.2022.101552. Epub 2022 Sep 30.

Rapid evaluation of T cell clonality in the diagnostic work-up of mature T cell neoplasms: TRBC1-based flow cytometric assay experience

Affiliations

Rapid evaluation of T cell clonality in the diagnostic work-up of mature T cell neoplasms: TRBC1-based flow cytometric assay experience

Manuela Capone et al. Transl Oncol. 2022 Dec.

Erratum in

Abstract

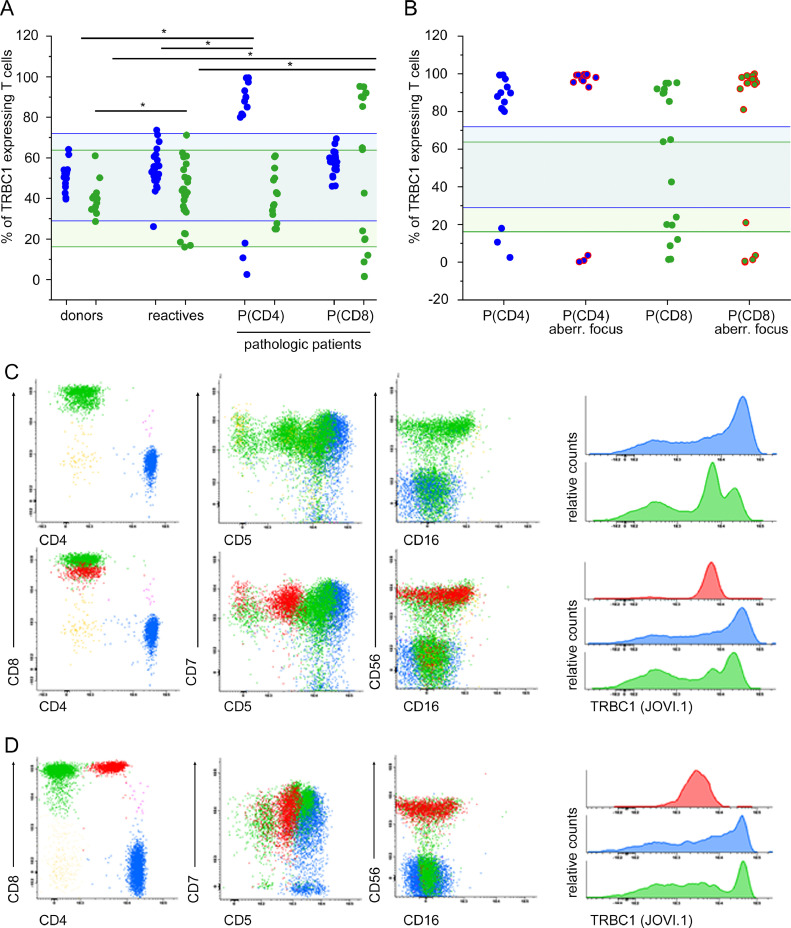
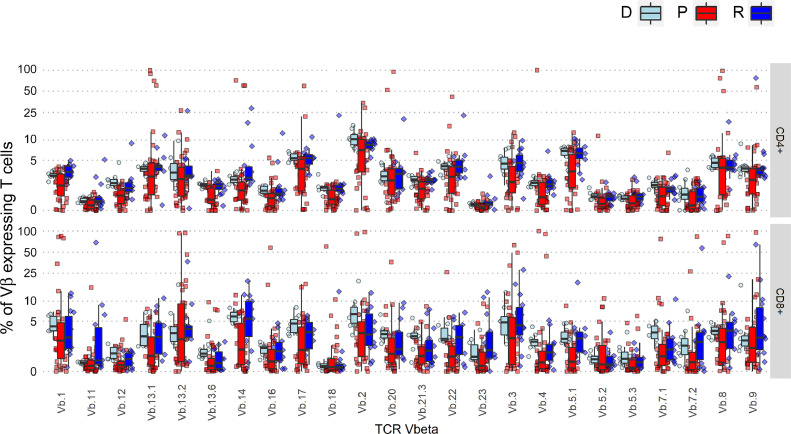
The identification of mature T cell neoplasms by flow cytometry is often challenging, due to overlapping features with reactive T cells and limitations of currently available T cell clonality assays. The description of an antibody specific for one of two mutually exclusive T cell receptor (TCR) β-chain constant regions (TRBC1) provides an opportunity to facilitate the detection of clonal TCRαβ+ T cells based on TRBC-restriction. Here we prospectively analyzed 14 healthy controls and 63 patients with the flow cytometry protocol currently used for suspected T cell neoplasm implemented with immunostaining targeting TRBC1. Specimens were firstly classified in 3 groups based on clinical records data, laboratory findings and immunophenotypic features. T cell clonality was assessed by TCR Vβ repertoire analysis and the new rapid TRBC1 assay. Results showed that TRBC1 unimodal expression was unequivocally associated with samples presenting with immunophenotypic aberrancies. Moreover, we demonstrated that the use of TRBC1 is useful in solving uncertain cases and confirmed the high sensitivity of the method in identifying small T cell clones of uncertain significance (T-CUS). Finally, we found a high degree of concordance (97%) comparing the currently available clonality assessment methods with the proposed new method. In conclusion, our results provided real-life evidence of the utility of TRBC1 introduction in the flow cytometric clonality evaluation for the routine diagnostic work-up of T cell neoplasms.

Keywords: T-cell clonality; T-cell lymphoproliferative diseases/lymphomas; T-cell receptor β chain; TRBC1.


Conflict of interest statement

Declaration of interests The authors declare that they have no known competing financial interests or personal relationships that could have appeared to influence the work reported in this paper.

Figures

Fig 1
Fig. 1
TRBC1 expression in donors, reactive and pathological patients. A) Data represent percentages of cells expressing TRBC1 within CD4+ (blu dots) and CD8+ (green dots) subsets in 14 healthy donors, 26 reactive patients and 35 pathological patients further divided in CD4-pathological (=P(CD4)) and CD8-pathological (=P(CD8)) based on the major T cell subset affected by immunophenotypic aberrancies. In the scatter column graphics, dots correspond to individual percentages of TRBC1+ T cells. Light blue and light green areas represent the normal ranges calculated on healthy donors. Mann-Whitney U t-test was used to calculate statistics on deviations from mean values between groups. p value<0,05 was considered statistically significant. *p<0,001. B) Representation of percentages of TRBC1 expressing T cells using the two different analytic approaches on pathological patients. Results on CD4+ T cells are in blue and on CD8+ T cells are in green. Red circled dots indicate the results restricted to the aberrant subset. C) Representative flow cytometric dot plots and histograms showing the two different analytic approaches applied to one same specimen; CD4+ T cells are depicted in blue, CD8+ in green and the pathological population is in red. D) One representative analysis of a patient presenting a double positive pathological population. CD4+ T cells are depicted in blue, CD8+ in green and the pathological population is in red.
Fig 2
Fig. 2
TCR-Vβ family members expression in donors, reactive and pathological patients. Percentages of cells expressing a specific Vβ family member within CD4+ and CD8+ subsets in 14 healthy donors (D, light blue dots and boxes), 17 reactive patients (R, dark blue dots and boxes) and 40 pathological patients (P, red dots and boxes). In the box-plot graphics, dots correspond to results from individuals while boxes represent 25th and 75th percentile values, lines inside the box correspond to median values (50th percentile) and whiskers represent 5th and 95th percentile values.
Fig 3
Fig. 3
Impact of TRBC1 analysis into the current immunophenotypic panel. A) Heat-map representation of mean fluorescence intensities (MFI) of T cell antigens currently evaluated during T cell neoplasm diagnostic work-up. TRBC1 percentages of expression calculated with the two methods were normalized and introduced as unimodal variables in the different identified groups of donors, reactives and pathological (status).
Fig 4
Fig. 4
TRBC1 utility in uncertain cases resolution and T-CUS identification. (A) Representative flow cytometric plots of an equivocal case showing an oligoclonal TCR-Vβ pattern in the presence of relevant immunophenotypic aberrancies and monotypic TRBC1 profile. (B) Representative flow cytometric plots identifying a T-CUS by an immunophenotypic analysis including TRBC1 in a patient showing a “non reactive“ TCR-Vβ pattern on CD8+ T cells. CD4+ T cells are depicted in blue, CD8+ in green and the pathological population is in red. DP and DN T cells are in pink and yellow respectively.

References

    1. Jaffe E.S. The 2008 WHO classification of lymphomas: implications for clinical practice and translational research. Hematology. 2009;2009:523–531. - PMC - PubMed
    1. Lima M., et al. Utility of flow cytometry immunophenotyping and DNA ploidy studies for diagnosis and characterization of blood involvement in CD4+ Sézary's syndrome. Haematologica. 2003;88:874–887. - PubMed
    1. Kalina T., et al. EuroFlow standardization of flow cytometer instrument settings and immunophenotyping protocols. Leukemia. 2012;26:1986–2010. - PMC - PubMed
    1. Morice W.G., et al. Flow cytometric assessment of TCR-V β expression in the evaluation of peripheral blood involvement by T-Cell lymphoproliferative disorders: a comparison with conventional T-Cell immunophenotyping and molecular genetic techniques. Am. J. Clin. Pathol. 2004;121:373–383. - PubMed
    1. Lima M., et al. Immunophenotypic analysis of the TCR-Vβ repertoire in 98 persistent expansions of CD3+/TCR-αβ+ large granular lymphocytes. Am. J. Pathol. 2001;159:1861–1868. - PMC - PubMed