. 2022 Oct 2;13(1):5786.
doi: 10.1038/s41467-022-33463-x.

The alarmin interleukin-1α triggers secondary degeneration through reactive astrocytes and endothelium after spinal cord injury

Affiliations

The alarmin interleukin-1α triggers secondary degeneration through reactive astrocytes and endothelium after spinal cord injury

Floriane Bretheau et al. Nat Commun. .

Abstract

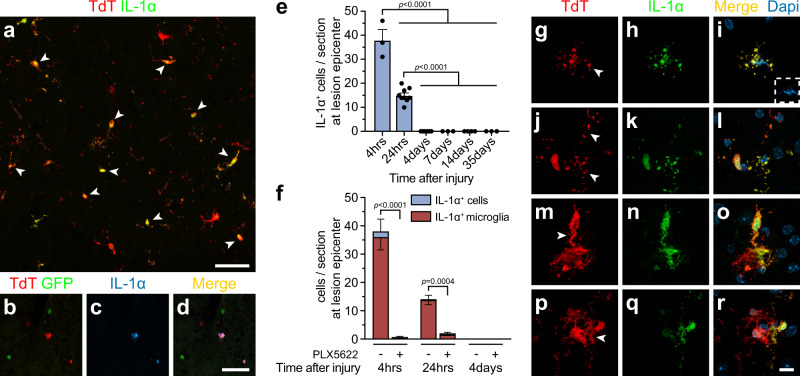
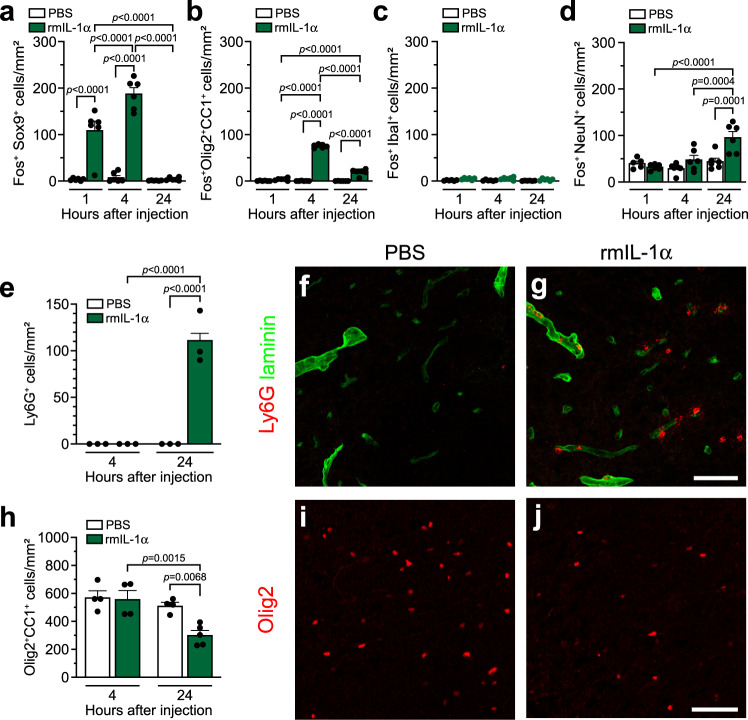
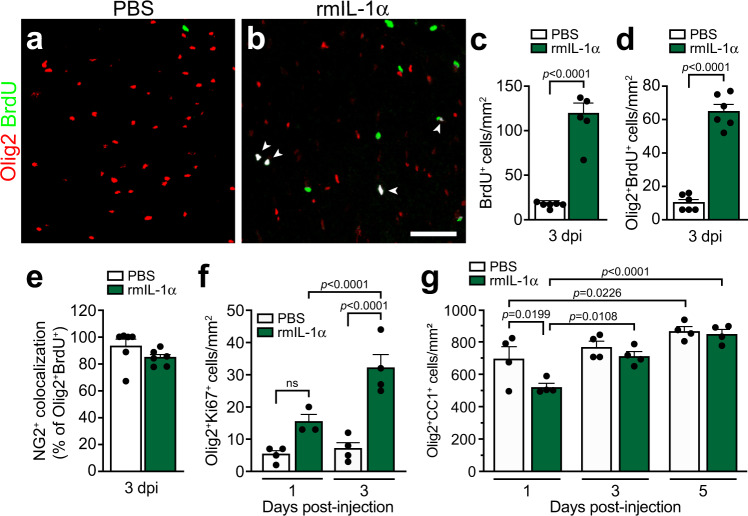
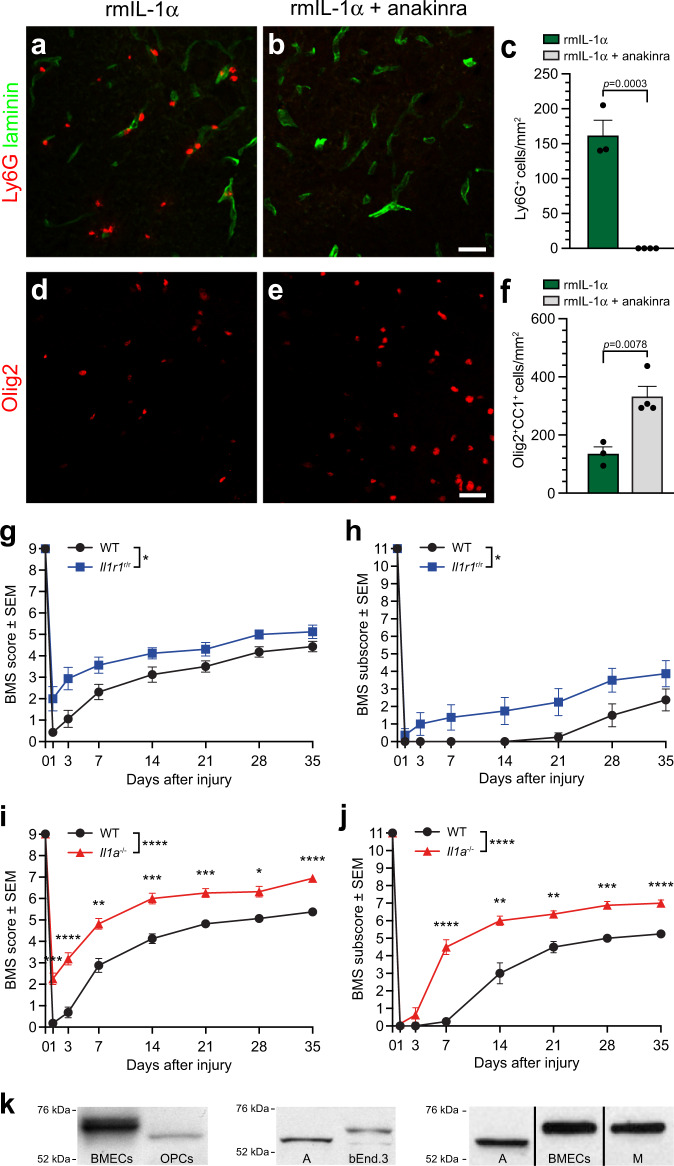
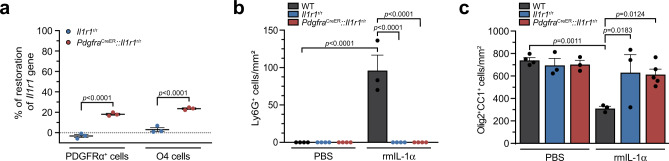
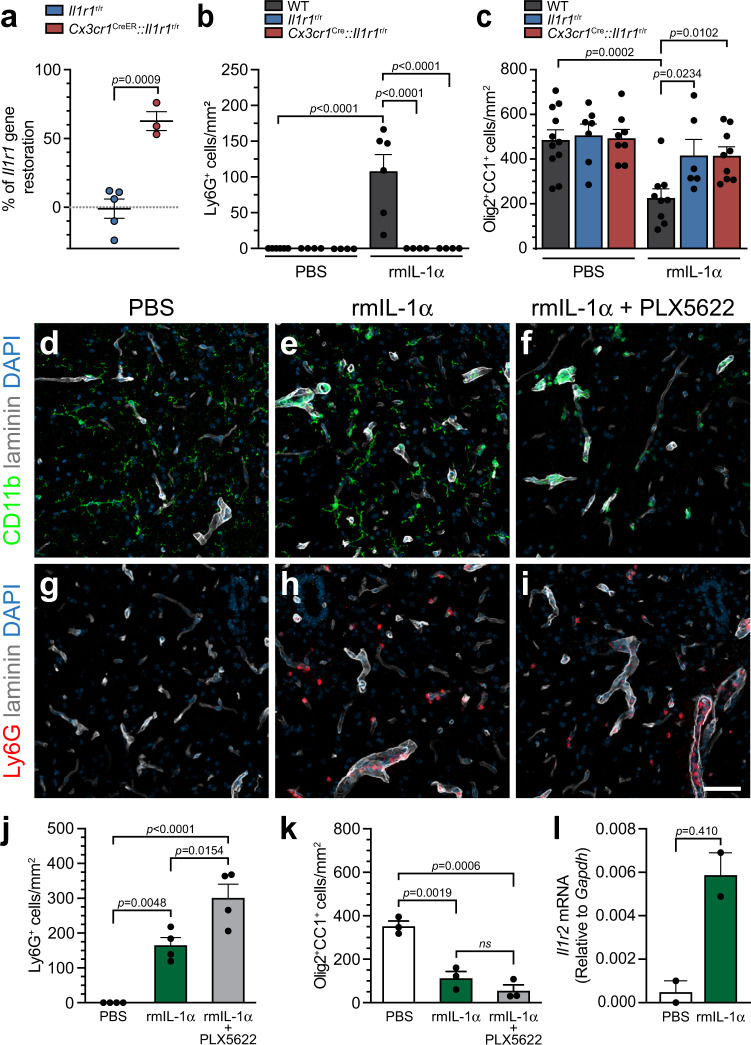
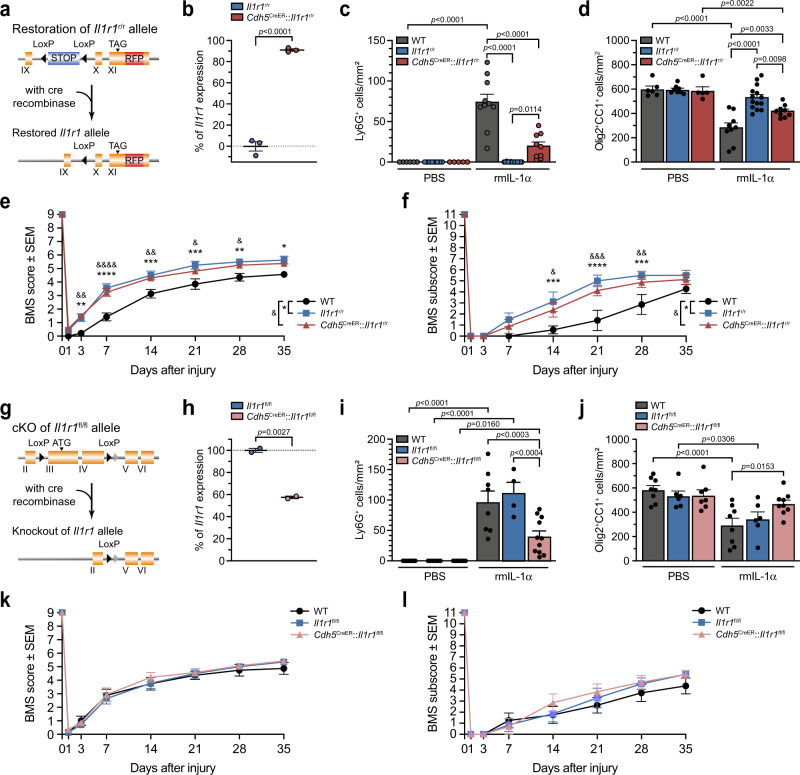
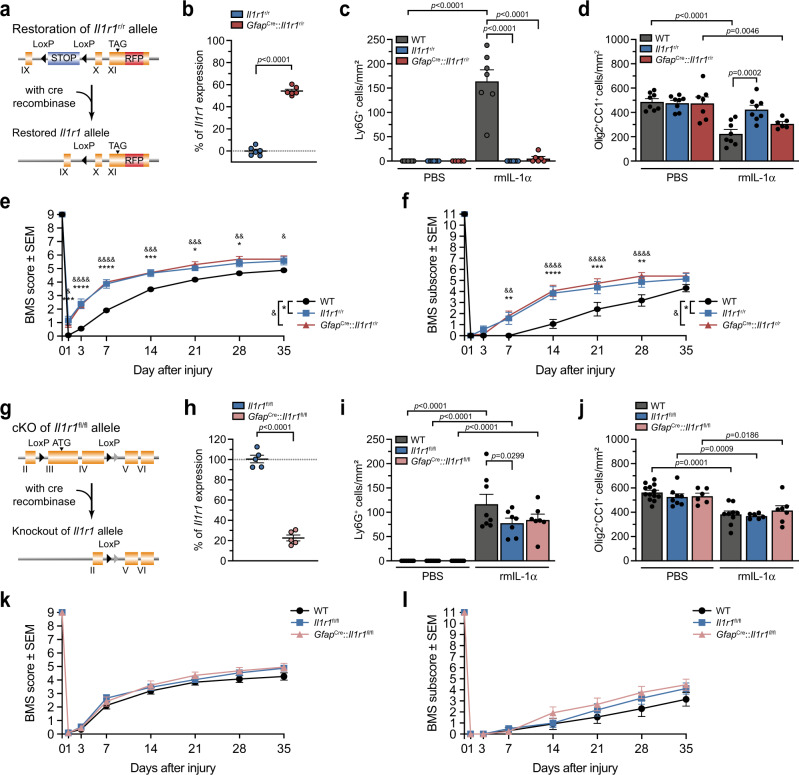
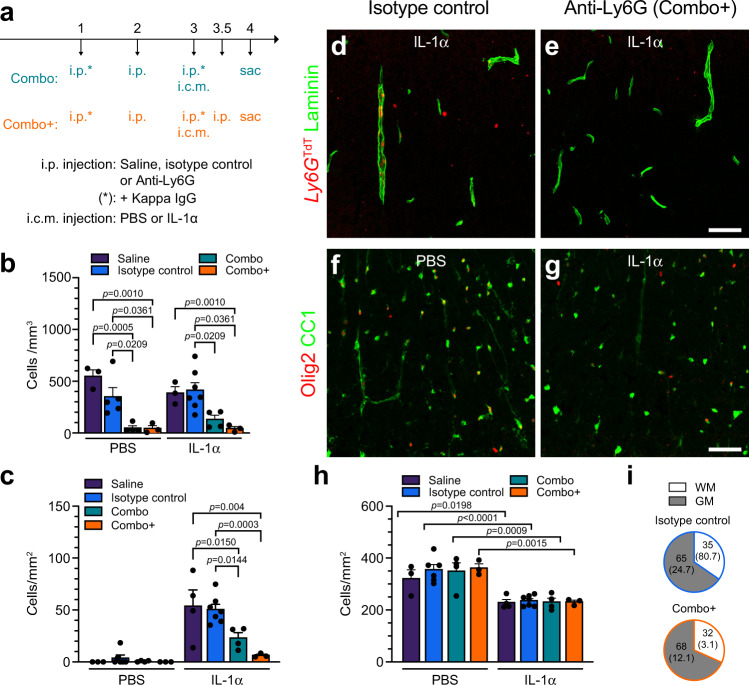
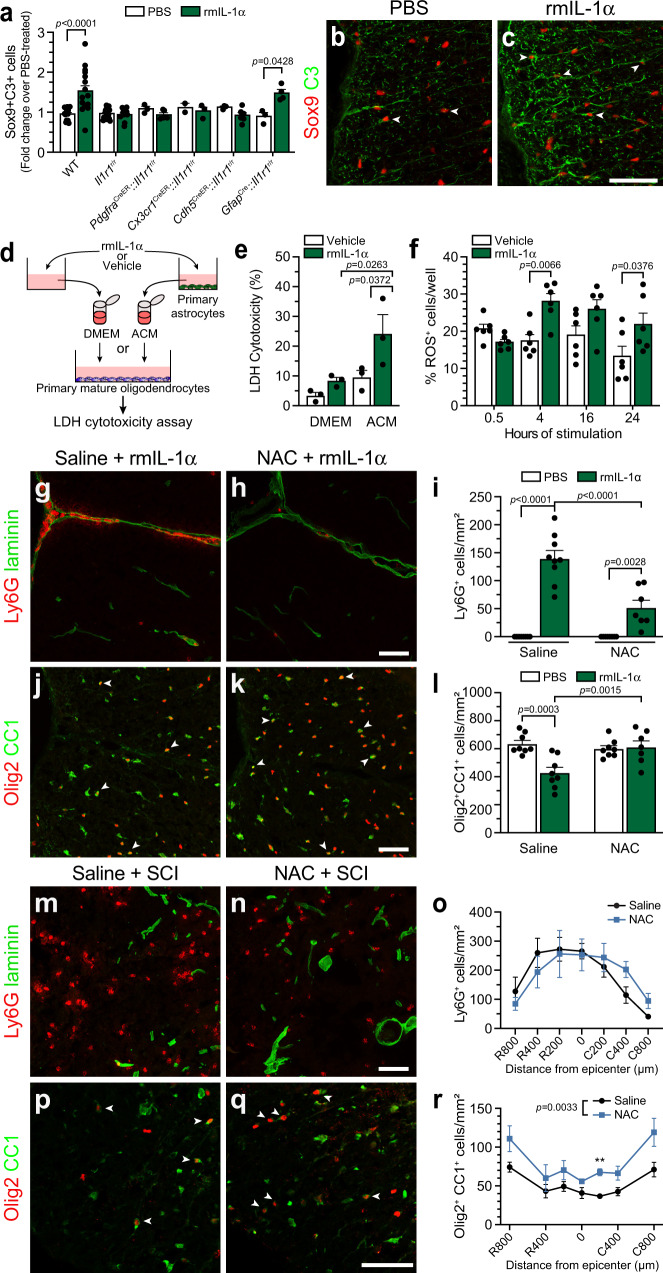
Spinal cord injury (SCI) triggers neuroinflammation, and subsequently secondary degeneration and oligodendrocyte (OL) death. We report that the alarmin interleukin (IL)-1α is produced by damaged microglia after SCI. Intra-cisterna magna injection of IL-1α in mice rapidly induces neutrophil infiltration and OL death throughout the spinal cord, mimicking the injury cascade seen in SCI sites. These effects are abolished through co-treatment with the IL-1R1 antagonist anakinra, as well as in IL-1R1-knockout mice which demonstrate enhanced locomotor recovery after SCI. Conditional restoration of IL-1R1 expression in astrocytes or endothelial cells (ECs), but not in OLs or microglia, restores IL-1α-induced effects, while astrocyte- or EC-specific Il1r1 deletion reduces OL loss. Conditioned medium derived from IL-1α-stimulated astrocytes results in toxicity for OLs; further, IL-1α-stimulated astrocytes generate reactive oxygen species (ROS), and blocking ROS production in IL-1α-treated or SCI mice prevented OL loss. Thus, after SCI, microglia release IL-1α, inducing astrocyte- and EC-mediated OL degeneration.


Conflict of interest statement

The authors declare no competing interests.

Figures

Fig. 1
Fig. 1. Damaged microglia rapidly produce IL-1α at the site of spinal cord contusion in mice.
a Representative confocal image showing IL-1α immunostaining (green) in the spinal cord of an injured Cx3cr1Cre::Rosa26TdT transgenic mouse, in which microglia express the fluorescent reporter Td-Tomato (TdT, red), at 4 h post-SCI. White arrowheads point to specific double-labeled cells. bd Confocal immunofluorescence images showing expression of IL-1α (blue) in microglia (TdT, red), but not macrophages (LysM, green), in the spinal cord of an injured LysM-eGFP::Cx3cr1CreER::R26-TdT mouse at 4 h post-SCI. e, f Quantification of IL-1α-positive (+) cells and IL-1α+TdT+ microglia at the lesion epicenter in untreated Cx3cr1Cre::Rosa26TdT mice (e n = 3 at 4 h, n = 9 at 24 h, n = 6 at 4 days, n = 3 at 7 days, n = 4 at 14 days, n = 3 at 35 days) and fluorescent reporter mice treated with PLX5622 or the control diet (f n = 3 control diet 4 h, n = 3 PLX diet 4 h, n = 4 control diet 24 h, n = 4 PLX diet 24 h, n = 3 control diet 4 days, n = 3 PLX diet 4 days) and killed at various time points post-SCI. gr High magnification confocal images of IL-1α+ TdT+ microglia revealed that these cells often exhibit damaged cell bodies and processes (gl) or have retracted, swollen processes, indicative of an activated status (mr). White arrowheads point to relevant cell morphologies reminiscent of damaged (gl) or activated (mr) cells. Nuclear staining (DAPI) is shown in blue (i, l, o, r) in the merged images. Data are presented as mean values + /− SEM and statistical significance was determined by a one-way (e) or two-way (f) ANOVA with Bonferroni’s post-hoc test. Pairwise comparisons and p-values are indicated in the graphs. Scale bars: (a) 50 µm, (bd, in d) 50 µm, (gr, in r) 10 µm.
Fig. 2
Fig. 2. Injection of IL-1α into the CNS of mice induces rapid activation of glial cells, neutrophil infiltration, and loss of mature oligodendrocytes in the spinal cord.
ad Quantification of the activation marker Fos in astrocytes (Fos+Sox9+ cells), oligodendrocytes (Fos+Olig2+CC1+), microglia (Fos+Iba1+), and neurons (Fos+NeuN+) in the spinal cord of C57BL/6 mice injected with either PBS or rmIL-1α i.c.m. and killed at 1, 4 or 24 h post-injection (n = 6 mice/group). e Quantification of the total number of Ly6G+ neutrophils that infiltrated the spinal cord at 4 and 24 h post-injection of PBS or rmIL-1α (n = 3 mice/group). f, g Representative confocal images showing Ly6G (a marker of neutrophils, red) and laminin (a marker of blood vessel basement membranes, green) immunostainings in the spinal cord of C57BL/6 mice injected with either PBS (f) or rmIL-1α (g) at 24 h post-injection. h Quantification of the total number of Olig2+CC1+ mature oligodendrocytes in the spinal cord white matter of C57BL/6 mice at 4 and 24 h post-i.c.m. injection of either PBS or rmIL-1α (n = 4–5 mice/group: n = 4 PBS 4 h, n = 4 rmIL-1α 4 h, n = 4 PBS 24 h, n = 5 rmIL-1α 24 h). i, j Representative confocal images showing immunostaining for the oligodendrocyte transcription factor 2 (Olig2, red cells), a nuclear marker of oligodendrocyte lineage cells, in the spinal cord of C57BL/6 mice at 24 h post-injection of either PBS (i) or rmIL-1α (j). Data are presented as mean values + /− SEM and statistical significance was determined by a two-way ANOVA followed by a Bonferroni post-hoc test (ae, h). Pairwise comparisons and p-values are indicated in the graphs. Scale bars: (f, g, in g) 50 µm, (i, j, in j) 50 µm.
Fig. 3
Fig. 3. Proliferating oligodendrocyte precursor cells rapidly restore the number of mature oligodendrocytes in mice injected centrally with IL-1α.
a, b Representative confocal images showing Olig2 (red) and BrdU (a marker of cell proliferation, green) immunostainings in the spinal cord white matter of C57BL/6 mice injected with either PBS (a) or rmIL-1α (b) at 3 days post-injection. White arrowheads indicate certain proliferating oligodendrocyte lineage cells. c, d Quantification of the total number of BrdU+ cells (c) and Olig2+BrdU+ double-positive cells (d) in the spinal cord white matter at 3 days post-injection of PBS or rmIL-1α intra-cisterna magna (i.c.m.) (n = 6 mice/group). e Percentage of Olig2+ BrdU+ cells coexpressing the NG2 marker, an indicator of OPCs (n = 6 mice/group). f Quantification of the total number of Olig2+Ki67+ double-positive cells in the spinal cord white matter of C57BL/6 mice at 1 and 3 days post-i.c.m. injection of either PBS or rmIL-1α (n = 3–4 mice/group: n = 4 PBS Day 1, n = 3 rmIL-1α Day 1, n = 4 PBS Day 3, n = 4 rmIL-1α Day 3). g Quantification of the total number of Olig2+ CC1+ mature oligodendrocytes in the spinal cord white matter at 1, 3 and 5 days post-i.c.m. treatment with PBS or rmIL-1α (n = 4 mice/group). Data are presented as mean values + /− SEM and statistical significance was determined by either a one (ce) or two-way (fg) ANOVA followed by a Bonferroni post-hoc test. Pairwise comparisons and p-values are indicated in the graphs. Scale bars: (a, b, in b) 50 µm.
Fig. 4
Fig. 4. IL-1α mediates its effects in both the inflamed and injured mouse spinal cord through IL-1R1.
a, b Representative confocal images showing the presence (or absence) of Ly6G+ neutrophils (red cells) in the spinal cord of C57BL/6 mice injected i.c.m. with either rmIL-1α alone (a) or rmIL-1α + anakinra, a recombinant human IL-1R antagonist (b). All mice were killed at 24 h post-injection. An anti-pan-laminin antibody was used to stain blood vessel basement membranes (green staining). c Quantification of the total number of Ly6G+ neutrophils that infiltrated the spinal cord of mice (n = 3–4 mice/group: n = 3 rmIL-1α, n = 4 rmIL-1α + anakinra). d, e Representative images showing immunostaining for the Olig2 transcription factor in the spinal cord of C57BL/6 mice injected with either rmIL-1α (d) or rmIL-1α + anakinra (e) and killed at 24 h. f Quantification of the total number of Olig2+ CC1+ mature oligodendrocytes in the spinal cord white matter at 24 h post-i.c.m. treatment (n = 3–4 mice/group: n = 3 rmIL-1α, n = 4 rmIL-1α + anakinra). gj Locomotor function was assessed using the BMS score (g, i) and BMS subscore (h, j) over a 35-day period post-SCI in wild-type (WT), Il1r1r/r (Il1r1−/−) or Il1a−/− mice (n = 8 mice per group). k Detection by immunoblotting of IL-1R1 in various murine primary and immortalized cells including: Lane 1 = primary brain microvascular endothelial cells (BMECs), Lane 2 = primary oligodendrocyte progenitor cells (OPCs), Lane 3 = primary astrocytes (A), Lane 4 = immortalized bEnd.3 ECs (bEnd.3), Lane 5 = primary astrocytes (A), Lane 6 = primary BMECs, and Lane 7 = primary microglia (M). Data are presented as mean values + /− SEM and statistical significance was determined by either a two-tailed Student’s t-test (c, f) or a two-way repeated measures ANOVA followed by a Bonferroni post-hoc test (gj). When not directly indicated in the graphs, p-values are as follows: ****p < 0.0001, ***p < 0.001, **p < 0.01, *p < 0.05, compared to the WT group. Scale bars: (a, b, in b) 25 µm, (d, e, in e) 25 µm.
Fig. 5
Fig. 5. Restoration of the Il1r1 gene in oligodendrocyte lineage cells does not lead to IL-1α-mediated neuroinflammation and oligodendrocyte loss.
a Quantification of restoration of Il1r1 gene expression in primary PDGFRα+ and O4+ oligodendrocyte lineage cells isolated by immunopanning from the uninjured spinal cord of adult Il1r1r/r mice, who express an IL-1R1-knockout phenotype, and PdgfraCreER::Il1r1r/r mice at 50 days post-tamoxifen treatment (n = 3 per group and each sample has a pool of 4 mice). b Quantification of the number of Ly6G+ neutrophils that infiltrated the spinal cord of WT, Il1r1r/r and PdgfraCreER::Il1r1r/r mice at 24 h post-injection of either PBS or rmIL-1α (n = 3–4 mice/group: n = 4 WT + PBS, n = 4 Il1r1r/r + PBS, n = 4 PdgfraCreER::Il1r1r/r + PBS, n = 3 WT + rmIL-1α, n = 4 Il1r1r/r + rmIL-1α, n = 4 PdgfraCreER::Il1r1r/r + rmIL-1α). c Quantification of the total number of Olig2+ CC1+ mature oligodendrocytes in the spinal cord white matter of WT, Il1r1r/r and PdgfraCreER::Il1r1r/r mice at 24 h post-injection of either PBS or rmIL-1α (n = 3–5 mice/group: n = 4 WT + PBS, n = 3 Il1r1r/r + PBS, n = 3 PdgfraCreER::Il1r1r/r + PBS, n = 3 WT + rmIL-1α, n = 3 Il1r1r/r + rmIL-1α, n = 5 PdgfraCreER::Il1r1r/r + rmIL-1α). Data are presented as mean values + /− SEM and statistical significance was determined by a two-way ANOVA followed by a Bonferroni post-hoc test (ac). Pairwise comparisons and p-values are indicated in the graphs.
Fig. 6
Fig. 6. Microglia alleviate IL-1α-mediated neuroinflammation and oligodendrocyte loss independently of their expression of IL-1R1.
a Quantification of restoration of Il1r1 gene expression in primary microglia isolated from the uninjured spinal cord of adult Il1r1r/r mice expressing an IL-1R1-knockout phenotype (set to 0%) and Cx3cr1CreER::Il1r1r/r mice at 30 days post-tamoxifen treatment (n = 5 Il1r1r/r, n = 3 Cx3cr1CreER::Il1r1r/r). b Quantification of the number of Ly6G+ neutrophils that infiltrated the spinal cord of WT, Il1r1r/r and Cx3cr1CreER::Il1r1r/r mice at 24 h post-injection of either PBS or rmIL-1α (n = 6 WT + PBS, n = 4 Il1r1r/r + PBS, n = 4 Cx3cr1CreER::Il1r1r/r + PBS, n = 6 WT + rmIL-1α, n = 4 Il1r1r/r + rmIL-1α, n = 4 Cx3cr1CreER::Il1r1r/r + rmIL-1α). c Quantification of the number of Olig2+ CC1+ mature oligodendrocytes in the spinal cord white matter of WT, Il1r1r/r and Cx3cr1CreER::Il1r1r/r mice at 24 h post-injection (n = 11 WT + PBS, n = 7 Il1r1r/r + PBS, n = 8 Cx3cr1CreER::Il1r1r/r + PBS, n = 9 WT + rmIL-1α, n = 6 Il1r1r/r + rmIL-1α, n = 9 Cx3cr1CreER::Il1r1r/r + rmIL-1α). di Confocal images showing the presence of CD11b+ cells (green cells in df; CD11b stains microglia, macrophages and neutrophils) and Ly6G+ neutrophils (red cells, gi) in the spinal cord of C57BL/6 mice injected with either PBS (d, g), rmIL-1α (e, h) or rmIL-1α + PLX5622 (f, i) at 24 h post-injection. j Quantification of the number of Ly6G+ neutrophils that infiltrated the spinal cord of C57BL/6 mice at 24 h post-injection of either PBS, rmIL-1α, or rmIL-1α + PLX5622 (n = 4 mice/group). k Quantification of the number of Olig2+ CC1+ mature oligodendrocytes in the spinal cord white matter of C57BL/6 mice at 24 h post-injection of either PBS, rmIL-1α, or rmIL-1α + PLX5622 (n = 3 mice/group). l Relative expression of Il1r2 gene in mice injected with PBS or rmIL-1α, as determined by quantitative real-time PCR (n = 2 per group, where each n is a pool of 4 mice). Data are presented as means + /− SEM and statistical significance determined by either a two-tailed Student’s t-test (a, l), one-way ANOVA (j, k), or two-way ANOVA (b, c) followed by a Bonferroni post-hoc test. Pairwise comparisons and p-values are indicated in the graphs. Scale bars: (d–i, in i) 50 µm.
Fig. 7
Fig. 7. IL-1α-induced neuroinflammation and oligodendrocyte loss is partly mediated by endothelial IL-1R1.
a Genetic design of the Cdh5CreER::Il1r1r/r mouse line. b Quantification of Il1r1 gene expression in primary brain endothelial cells isolated from adult Il1r1r/r mice expressing an IL-1R1-knockout phenotype (set to 0%) and Cdh5CreER::Il1r1r/r mice at 30 days post-tamoxifen treatment (n = 3 mice/group). c Quantification of Ly6G+ neutrophils in the spinal cord of WT, Il1r1r/r and Cdh5CreER::Il1r1r/r mice at 24 h post-i.c.m. injection of PBS or rmIL-1α (n = 6 WT + PBS, n = 8 Il1r1r/r + PBS, n = 5 Cdh5CreER::Il1r1r/r + PBS, n = 10 WT + rmIL-1α, n = 14 Il1r1r/r + rmIL-1α, n = 9 Cdh5CreER::Il1r1r/r + rmIL-1α). d Quantification of Olig2+ CC1+ mature oligodendrocytes in the spinal cord at 24 h post-injection (n = 6 WT + PBS, n = 8 Il1r1r/r + PBS, n = 5 Cdh5CreER::Il1r1r/r + PBS, n = 9 WT + rmIL-1α, n = 14 Il1r1r/r + rmIL-1α, n = 9 Cdh5CreER::Il1r1r/r + rmIL-1α). e, f Locomotor function was assessed using the BMS score (e) and BMS subscore (f) after SCI (n = 8 mice/group). g Genetic design of the Cdh5CreER::Il1r1fl/fl mouse line. h Il1r1 gene expression in brain endothelial cells of adult Il1r1fl/fl mice, which normally express the Il1r1 gene (set to 100%), and Cdh5CreER::Il1r1fl/fl mice at 30 days post-tamoxifen (n = 2 mice/group). i Quantification of spinal cord-infiltrated neutrophils at 24 h post-injection (n = 8 WT + PBS, n = 6 Il1r1fl/fl + PBS, n = 7 Cdh5CreER::Il1r1fl/fl + PBS, n = 8 WT + rmIL-1α, n = 4 Il1r1fl/fl + rmIL-1α, n = 11 Cdh5CreER::Il1r1fl/fl + rmIL-1α). j Quantification of mature oligodendrocytes at 24 h post-injection (n = 8 WT + PBS, n = 6 Il1r1fl/fl + PBS, n = 7 Cdh5CreER::Il1r1fl/fl + PBS, n = 8 WT + rmIL-1α, n = 6 Il1r1fl/fl + rmIL-1α, n = 9 Cdh5CreER::Il1r1fl/fl + rmIL-1α). k, l BMS scores (k) and subscores (l) after SCI (n = 7–8 mice/group). Data are means + /− SEM and statistical significance was determined by a two-tailed Student’s t-test (b, h), two-way ANOVA (c, d, I, j), or two-way repeated measures ANOVA (e, f, k, l) followed by Bonferroni post-hoc test. e, f ****p < 0.0001, ***p < 0.001, **p < 0.01, *p < 0.05; &&&&p < 0.0001, &&&p < 0.001, &&p < 0.01, &p < 0.05. Other pairwise comparisons and p-values are indicated in graphs.
Fig. 8
Fig. 8. IL-1α-induced neuroinflammation and oligodendrocyte loss is partly mediated by astrocytic IL-1R1.
a Genetic design of the GfapCre::Il1r1r/r mouse line. b Quantification of Il1r1 gene expression in primary brain astrocytes from adult Il1r1r/r mice expressing an IL-1R1-knockout phenotype (set to 0%) and GfapCre::Il1r1r/r mice (n = 6 mice/group). c Quantification of Ly6G+ neutrophils that infiltrated the spinal cord of WT, Il1r1r/r and GfapCre::Il1r1r/r mice at 24 h post-i.c.m. injection of PBS or rmIL-1α (n = 7 WT + PBS, n = 8 Il1r1r/r + PBS, n = 5 GfapCre::Il1r1r/r + PBS, n = 7 WT + rmIL-1α, n = 8 Il1r1r/r + rmIL-1α, n = 6 GfapCre::Il1r1r/r + rmIL-1α). d Quantification of Olig2+ CC1+ mature oligodendrocytes in the spinal cord at 24 h post-injection (n = 8 WT + PBS, n = 8 Il1r1r/r + PBS, n = 7 GfapCre::Il1r1r/r + PBS, n = 8 WT + rmIL-1α, n = 8 Il1r1r/r + rmIL-1α, n = 6 GfapCre::Il1r1r/r + rmIL-1α). e, f Locomotor function was assessed using the BMS score (e) and BMS subscore (f) after SCI (n = 16 WT, n = 15 Il1r1r/r, n = 15 GfapCre::Il1r1r/r). g Genetic design of the GfapCre::Il1r1fl/fl mouse line. h Il1r1 gene expression in primary brain astrocytes isolated from adult Il1r1fl/fl mice, which normally express the Il1r1 gene (set to 100%), and GfapCre::Il1r1fl/fl mice (n = 5 mice/group). i Quantification of spinal cord-infiltrated neutrophils at 24 h post-injection (n = 8 WT + PBS, n = 8 Il1r1fl/fl + PBS, n = 8 GfapCre::Il1r1fl/fl + PBS, n = 8 WT + rmIL-1α, n = 7 Il1r1fl/fl + rmIL-1α, n = 7 GfapCre::Il1r1fl/fl + rmIL-1α). j Quantification of mature OLs at 24 h post-injection (n = 13 WT + PBS, n = 8 Il1r1fl/fl + PBS, n = 6 GfapCre::Il1r1fl/fl + PBS, n = 9 WT + rmIL-1α, n = 6 Il1r1fl/fl + rmIL-1α, n = 7 GfapCre::Il1r1fl/fl + rmIL-1α). k, l BMS scores (k) and subscores (l) after SCI (n = 13 WT, n = 16 Il1r1fl/fl, n = 13 GfapCre::Il1r1fl/fl). All data are means + /− SEM and statistical significance was determined by a two-tailed Student’s t-test (b, h), two-way ANOVA (c, d, i, j), or two-way repeated measures ANOVA (e, f, k, l) followed by Bonferroni post-hoc test. e, f ****p < 0.0001, ***p < 0.001, **p < 0.01, *p < 0.05; &&&&p < 0.0001, &&&p < 0.001, &&p < 0.01, &p < 0.05. Other pairwise comparisons and p-values are indicated in graphs.
Fig. 9
Fig. 9. Depletion of neutrophils does not alter IL-1α-mediated oligodendrocyte loss.
a Diagram showing the experimental design and timeline of the depletion study. Abbreviations: Combo, combination strategy; Combo+, adapted combination strategy; i.c.m., intra-cisterna magna; i.p., intraperitoneal; sac, sacrifice. b Quantification by flow cytometry of the number of Ly6GTdT+ neutrophils in the blood of PBS- and IL-1α-injected Ly6gCre-TdT::R26-TdT mice pretreated with either the Combo+ strategy, Combo strategy, isotype control antibodies or saline. Mice were killed at 24 h post-i.c.m. injection (n = 3 Saline + PBS, n = 5 Isotype control + PBS, n = 4 Combo + PBS, n = 3 Combo+ + PBS, n = 3 Saline + IL-1α, n = 7 Isotype control + IL-1α, n = 4 Combo + IL-1α, n = 3 Combo+ + IL-1α). c Quantification of Ly6GTdT+ neutrophils that infiltrated the spinal cord at 24 h post-i.c.m. injection (n = 3 Saline + PBS, n = 6 Isotype control + PBS, n = 4 Combo + PBS, n = 3 Combo+ + PBS, n = 4 Saline + IL-1α, n = 7 Isotype control + IL-1α, n = 4 Combo + IL-1α, n = 3 Combo+ + IL-1α). d, e Confocal images showing Ly6GTdT+ cells (red) and laminin (green) in the spinal cord of Ly6gCre-TdT::R26-TdT mice injected i.c.m. with rmIL-1α, and pretreated i.p. with either isotype control antibodies (d) or the Combo+ treatment (e). f, g Confocal immunofluorescence imaging of Olig2 and CC1 in the spinal cord white matter of Ly6gCre-TdT::R26-TdT mice injected i.c.m. with either IL-1α or PBS, and treated with either isotype control antibodies (f) or the Combo+ strategy (g). h Quantification of Olig2+ CC1+ mature OLs in the spinal cord white matter of mice (n = 3 Saline + PBS, n = 6 Isotype control + PBS, n = 4 Combo + PBS, n = 3 Combo+ + PBS, n = 4 Saline + IL-1α, n = 7 Isotype control + IL-1α, n = 4 Combo + IL-1α, n = 3 Combo+ + IL-1α). i Percentage and total number (in parentheses) of Ly6GTdT+ neutrophils in the spinal cord gray matter (GM) versus white matter (WM). All data are mean values + /− SEM and statistical significance was determined by a two-way ANOVA followed by Bonferroni post-hoc test (b, c, h). Pairwise comparisons and p-values are indicated in graphs. Scale bars: (d, e, in e) 50 µm, (f, g, in g) 50 µm.
Fig. 10
Fig. 10. Reactive oxygen species released by astrocytes in response to IL-1α induce oligodendrocyte death.
a Quantification of Sox9+C3+ astrocytes in the spinal cord of IL-1R1-deficient (Il1r1r/r) and cell-specific IL-1R1 conditional restored mice injected i.c.m. with PBS or rmIL-1α and killed at day 1 (n = 15 WT + PBS, n = 16 WT + rmIL-1α, n = 13 Il1r1r/r + PBS, n = 11 Il1r1r/r + rmIL-1α, n = 3 PdgfraCreER::Il1r1r/r + PBS, n = 5 PdgfraCreER::Il1r1r/r + rmIL-1α, n = 2 Cx3cr1CreER::Il1r1r/r + PBS, n = 3 Cx3cr1CreER::Il1r1r/r + rmIL-1α, n = 3 Cdh5CreER::Il1r1r/r + PBS, n = 6 Cdh5CreER::Il1r1r/r + rmIL-1α, n = 3 GfapCre::Il1r1r/r + PBS, n = 4 GfapCre::Il1r1r/r + rmIL-1α). b, c Sox9 (red) and C3 (green) immunostainings in the spinal cord of mice injected with PBS or rmIL-1α. White arrowheads point to double-labeled cells. d Experimental design for the lactate dehydrogenase (LDH) assay. Primary astrocytes were cultured in presence of PBS (vehicle) or rmIL-1α. Primary mature OLs were then incubated in DMEM containing (or not) rmIL-1α, or conditioned medium derived from astrocytes (ACM) stimulated with vehicle or IL-1α. e Quantification of OL loss using LDH assay (n = 3 wells/condition). f Quantification of reactive oxygen species (ROS) production in primary astrocytes stimulated with vehicle or rmIL-1α (n = 6 wells/condition). g, h Immunofluorescence showing Ly6G+ neutrophils (red) in the spinal cord of C57BL/6 mice injected i.c.m. with rmIL-1α and i.p. with N-acetyl-L-cysteine (NAC) or saline. Mice were killed at 24 h post-i.c.m. injection. i Quantification of spinal cord-infiltrated Ly6G+ neutrophils (n = 8 Saline+PBS, n = 9 Saline+rmIL-1α, n = 8 NAC + PBS, n = 7 NAC + rmIL-1α). j, k Confocal immunofluorescence showing Olig2 (red) and CC1 (green) in the spinal cord of mice injected i.c.m. with rmIL-1α and i.p. with NAC or saline at 24 h. l Quantification of mature OLs in the spinal cord (n = 8 mice/group). m, n Immunostaining of Ly6G+ neutrophils (red) at the lesion epicenter at day 1 post-SCI in C57BL/6 mice treated with NAC or saline. o Quantification of spinal cord-infiltrated neutrophils (n = 5 mice/group). p, q Immunostaining for Olig2 (red) and CC1 (green) at the lesion epicenter at day 1 post-SCI. r Quantification of mature OLs in the injured spinal cord (n = 5 mice/group). Data are means (+/−SEM) and statistical significance determined by two-way ANOVA followed by Bonferroni post-hoc test (a, e, f, i, l, o, r). **p < 0.01 (r). Other pairwise comparisons and p-values are indicated in graphs. All scale bars: 50 µm.

References

    1. Tator CH, Fehlings MG. Review of the secondary injury theory of acute spinal cord trauma with emphasis on vascular mechanisms. J. Neurosurg. 1991;75:15–26. doi: 10.3171/jns.1991.75.1.0015. - DOI - PubMed
    1. Tator CH. Update on the pathophysiology and pathology of acute spinal cord injury. Brain Pathol. 1995;5:407–413. doi: 10.1111/j.1750-3639.1995.tb00619.x. - DOI - PubMed
    1. David, S. & Lacroix, S. in Clinical Neuroimmunology (eds J. Antel, G. Birnbaum, H. P. Hartung, & A. Vincent) 53-63 (Oxford University press, 2005).
    1. Didangelos A, et al. High-throughput proteomics reveal alarmins as amplifiers of tissue pathology and inflammation after spinal cord injury. Sci. Rep. 2016;6:21607. doi: 10.1038/srep21607. - DOI - PMC - PubMed
    1. Nimmerjahn A, Kirchhoff F, Helmchen F. Resting microglial cells are highly dynamic surveillants of brain parenchyma in vivo. Science. 2005;308:1314–1318. doi: 10.1126/science.1110647. - DOI - PubMed

Publication types