. 2023 Feb 1;31(2):435-453.
doi: 10.1016/j.ymthe.2022.09.018. Epub 2022 Oct 3.

WNT-modulating gene silencers as a gene therapy for osteoporosis, bone fracture, and critical-sized bone defects

Affiliations

WNT-modulating gene silencers as a gene therapy for osteoporosis, bone fracture, and critical-sized bone defects

Won-Taek Oh et al. Mol Ther. .

Abstract

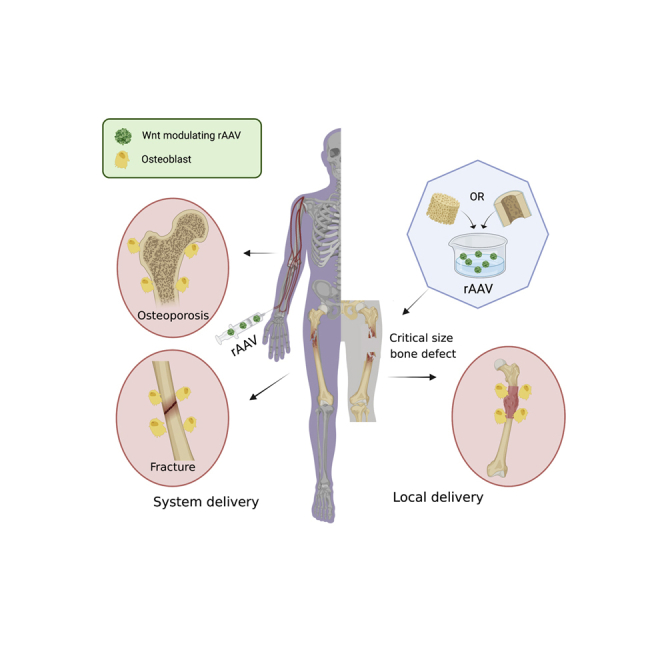
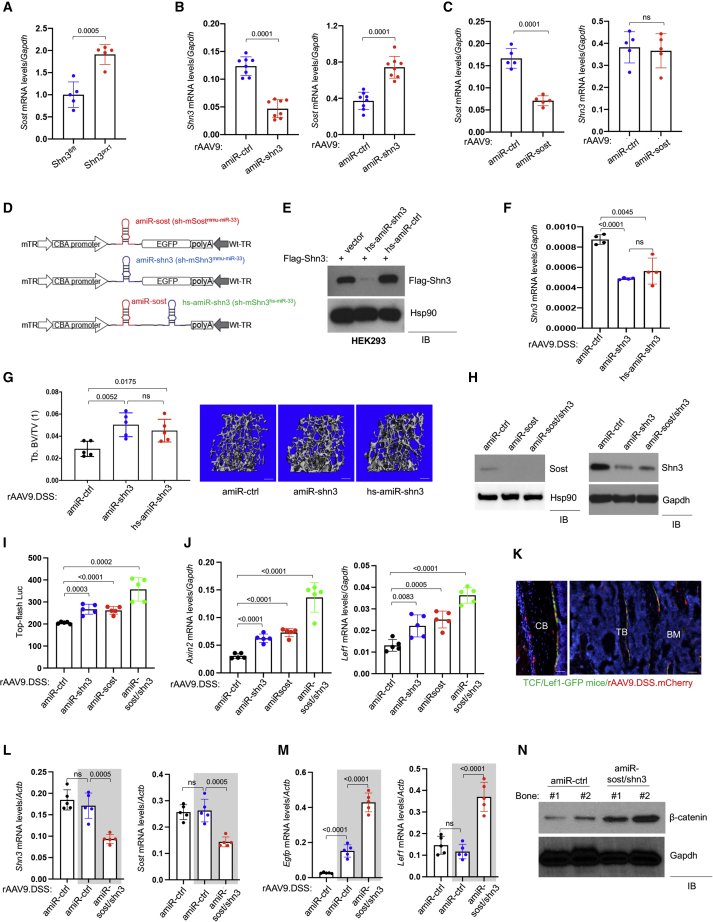
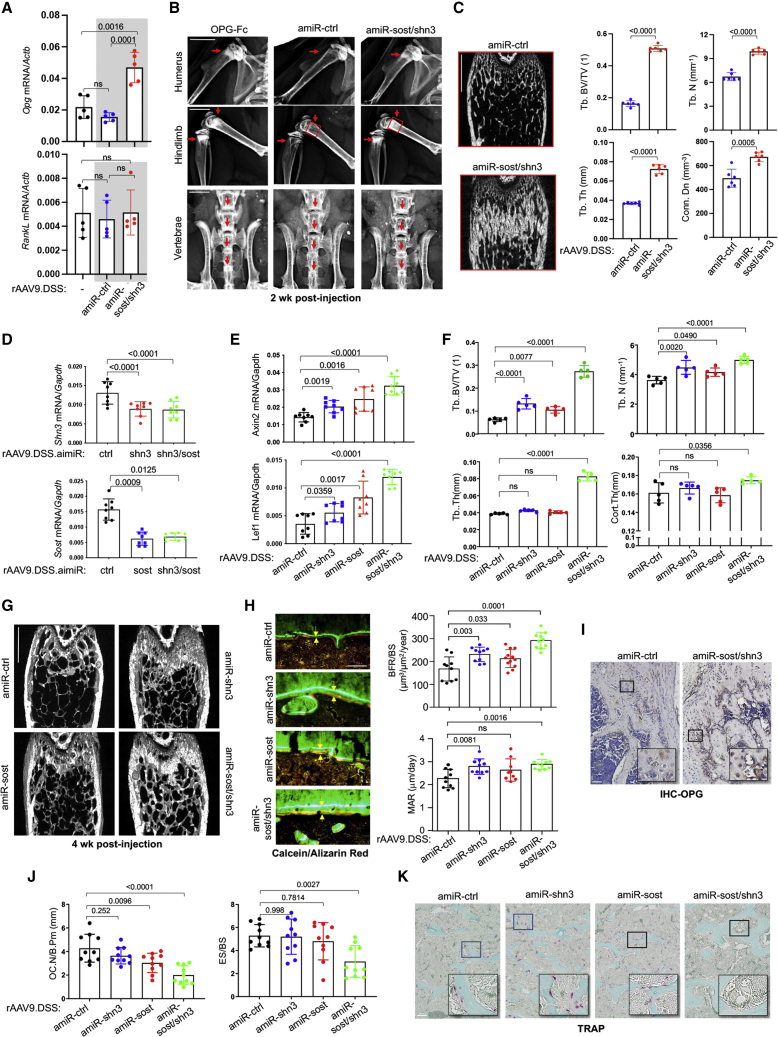
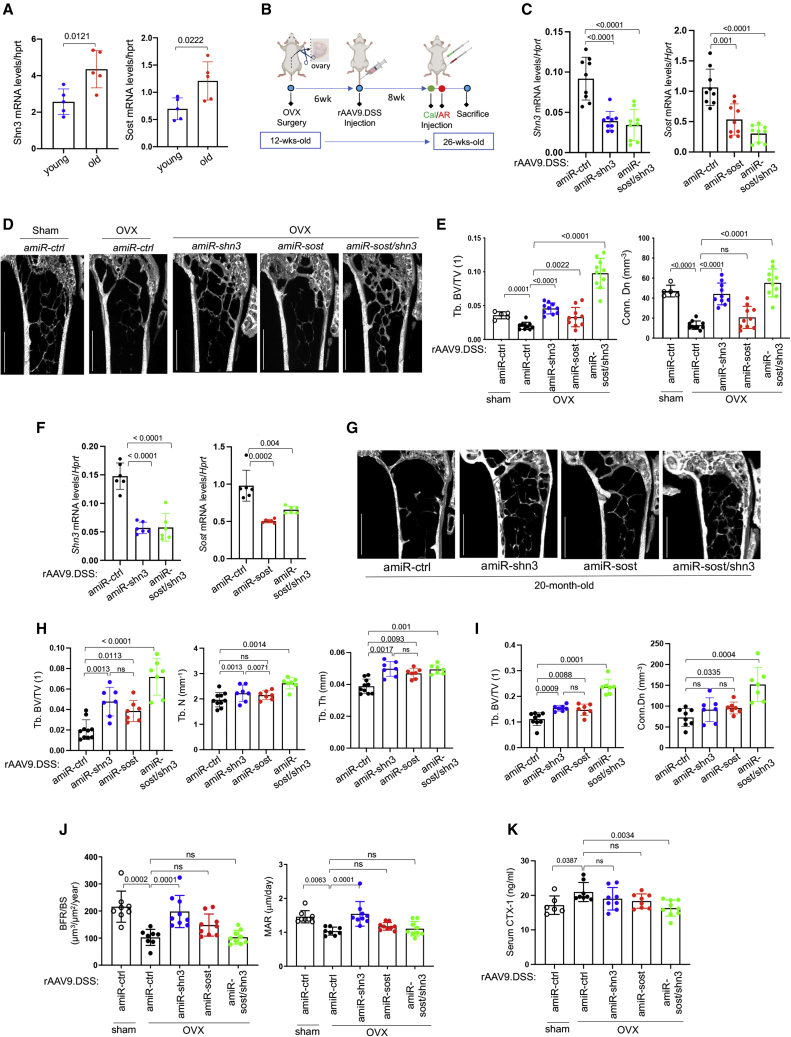
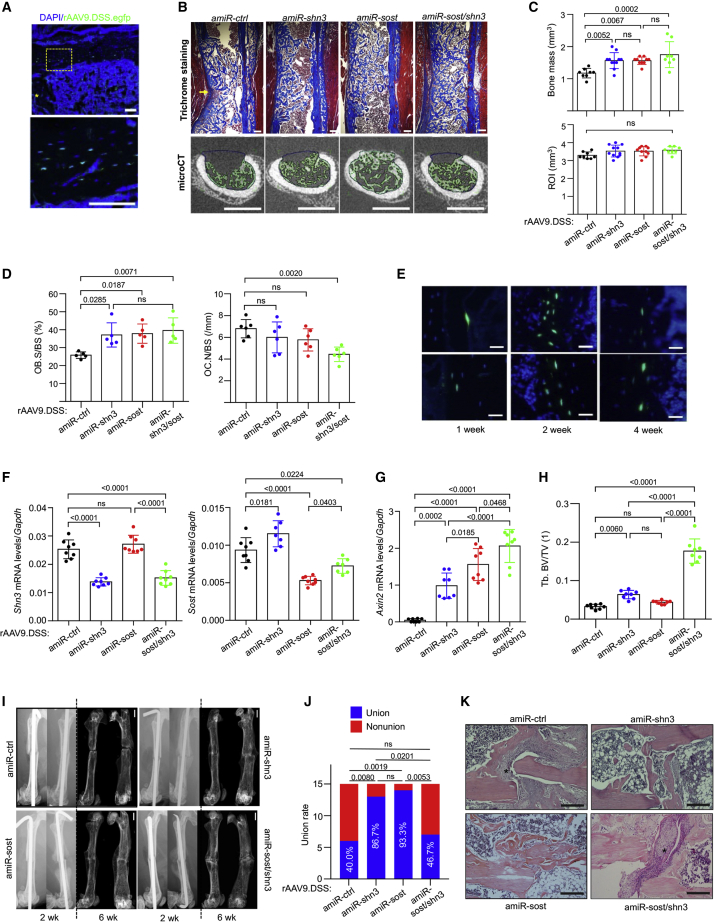
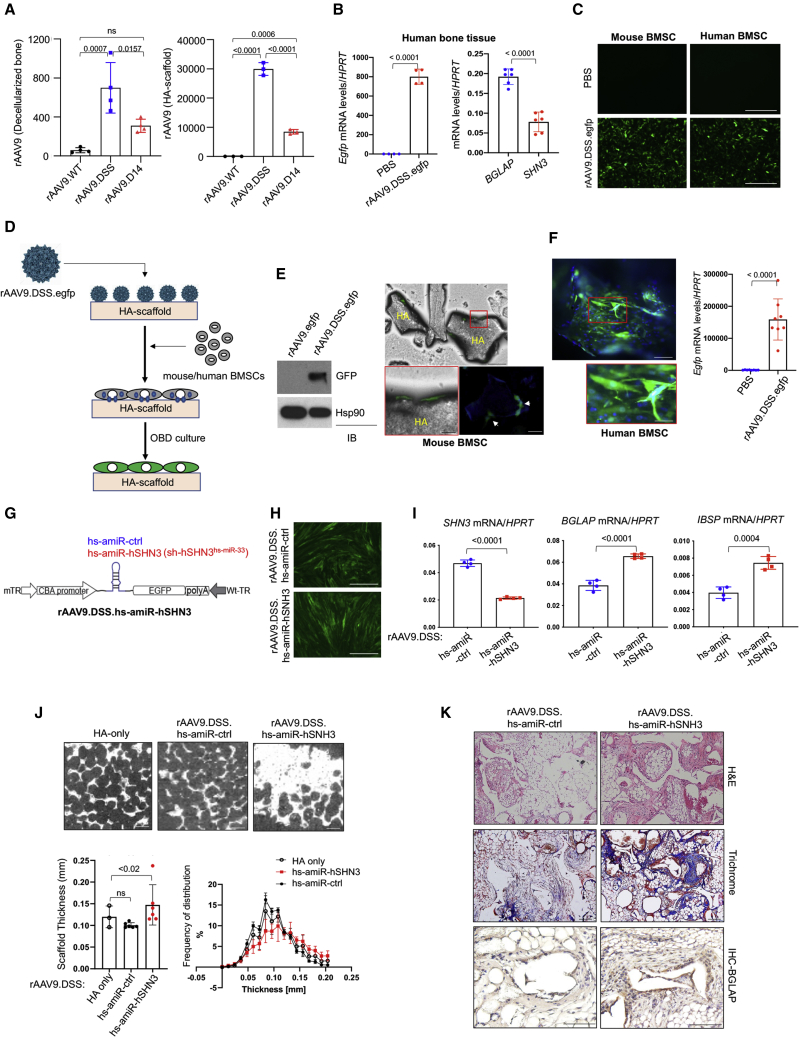
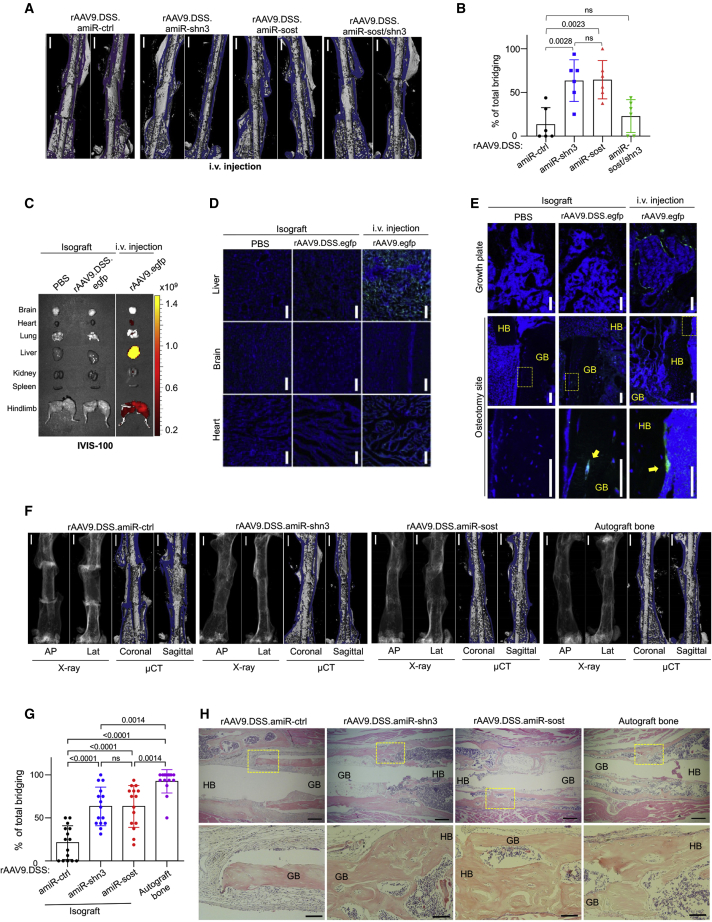
Treating osteoporosis and associated bone fractures remains challenging for drug development in part due to potential off-target side effects and the requirement for long-term treatment. Here, we identify recombinant adeno-associated virus (rAAV)-mediated gene therapy as a complementary approach to existing osteoporosis therapies, offering long-lasting targeting of multiple targets and/or previously undruggable intracellular non-enzymatic targets. Treatment with a bone-targeted rAAV carrying artificial microRNAs (miRNAs) silenced the expression of WNT antagonists, schnurri-3 (SHN3), and sclerostin (SOST), and enhanced WNT/β-catenin signaling, osteoblast function, and bone formation. A single systemic administration of rAAVs effectively reversed bone loss in both postmenopausal and senile osteoporosis. Moreover, the healing of bone fracture and critical-sized bone defects was also markedly improved by systemic injection or transplantation of AAV-bound allograft bone to the osteotomy sites. Collectively, our data demonstrate the clinical potential of bone-specific gene silencers to treat skeletal disorders of low bone mass and impaired fracture repair.

Keywords: bone fracture; critical-sized bone defect; osteoblast; osteoclast; osteoporosis; rAAV; schnurri-3; sclerostin; skeletal organoid.


Conflict of interest statement

Declaration of interests J.-H.S. is a scientific co-founder of AAVAA Therapeutics and holds equity in this company. G.G. is a scientific co-founder of AAVAA Therapeutics, Voyager Therapeutics, and Aspa Therapeutics and holds equity in these companies. G.G. is an inventor on patents with potential royalties licensed to Voyager Therapeutics, Aspa Therapeutics, and other biopharmaceutical companies. D.S.O. is a chief scientific officer of Osteogene Tech. These pose no conflicts for this study. The other authors declare no competing interests.

Figures

None
Graphical abstract
Figure 1
Figure 1
Generation of bone-targeted AAV carrying WNT-modulating gene silencers (A) mRNA levels of Sost in the tibias of 3-month-old wild-type (WT) (Shn3fl/fl) and Shn3prx1 mice (n = 5). (B and C) mRNA levels of Shn3 and Sost in the tibias of 3-month-old WT mice treated with rAAV9 carrying amiR-ctrl, amiR-shn3 (B, n = 8), or amiR-sost (C, n = 5). (D) Diagram of the AAV vector genome containing a cytomegalovirus (CMV) enhancer/chicken β-actin promoter (CBA), amiR-sost (sh-mSostmmu-miR−33), amiR-shn3 (sh-mShn3mmu-miR−33), or amiR-sost/hs-amiR-shn3 (sh-mSostmmu-miR−33;sh-mShn3hs-miR−33), an Egfp reporter gene (EGFP), β-globin polyA sequence (polyA), and mutant (m) or WT terminal repeat (TR). (E) A FLAG-Shn3-expressing plasmid was transfected into HEK293 cells along with vector control or a plasmid encoding hs-amiR-shn3 or amiR-ctrl, and, 2 days later, cell lysates were immunoblotted for FLAG-Shn3 or Hsp90 (as a loading control). (F and G) rAAV9.DSS (5 × 1013 vg/kg) carrying amiR-ctrl, amiR-shn3, or hs-amiR-shn3 was injected i.v. into 2-month-old mice, and, 2 months later, mRNA levels of Shn3 in the tibias were measured by RT-PCR and normalized to Gapdh (F). MicroCT analysis showing trabecular bone mass in AAV-treated femurs. Relative quantification (G, left) and representative 3D-reconstructions (G, right) are displayed. Tb.BV/TV, trabecular bone volume/total volume. Scale bar, 500 μm. (H–J) Ocy454 osteocytic cells were incubated with rAAV9.DSS carrying amiR-ctrl, amiR-shn3, amiR-sost, or amiR-shn3/sost for 2 days, cultured under differentiation conditions for 6 days, and immunoblotted with the indicated antibodies (H). AAV-treated Ocy454 cells were transfected with a β-catenin-responsive reporter gene (Top-flash Luc), cultured for 6 days in the presence of rWNT3a, and luciferase activity was measured (I, n = 4). Alternatively, mRNA levels of β-catenin target genes, Axin2 and Lef1, were assessed by RT-PCR and normalized to Gapdh (J, n = 5). (K–N) Two-month-old TCF/LEF1-GFP reporter mice were i.v. injected with rAAV9.DSS.mCherry (5 × 1013 vg/kg), and, 2 weeks later, expression of GFP and mCherry in the femurs was visualized by fluorescence microscopy (K, n = 3). Scale bar, 100 μm. CB, cortical bone; TB, trabecular bone; BM, bone marrow. Alternatively, rAAV9.DSS (5 × 1013 vg/kg) carrying amiR-ctrl or amiR-sost/shn3 were i.v. injected into WT or TCF/LEF1-GFP reporter (gray box) mice, and, 2 weeks later, mRNA levels of Shn3 and Sost (L) and egfp and Lef1 (M) in the tibia were measured by RT-PCR and normalized to Actb (n = 5). Protein lysates from the femur were immunoblotted for β-catenin. Gapdh was used as a loading control (N). WT mice were used as a negative control. Values represent mean ± SD by an unpaired two-tailed Student’s t test (A–C) and one-way ANOVA test (F, G, I, J, L, and M). ns, not significant.
Figure 2
Figure 2
Bone-targeted AAV gene silencers increase bone formation in mice (A–C) Two-month-old WT and TCF/Lef1-GFP reporter (gray box) mice were injected i.v. with rAAV9.DSS (5 × 1013 vg/kg) carrying amiR-ctrl or amiR-sost/shn3, and, 2 weeks later, mRNA levels of Opg and RankL in the tibia were measured by RT-PCR and normalized to Actb (A, n = 5). Bone accrual in the metaphyseal areas of humerus, hindlimb, and vertebrae was assessed by radiography (red arrows). Alternatively, OPG-Fc (1 mg/kg) was intraperitoneally (i.p.) injected weekly into 2-month-old WT mice (B, n = 3). Femoral bone mass was assessed by microCT. Red box in (B) shows representative 2D-transsection (C, left) and relative quantification (C, right) are displayed (n = 6). Tb.BV/TV, trabecular bone volume/total volume; Tb.N, trabecular number; Tb.Th, trabecular thickness; Condon, connective density. Scale bars, (B) 50 μm, (C) 1 mm. (D–K) Two-month-old WT mice were i.v. injected with rAAV9.DSS (5 × 1013 vg/kg) carrying amiR-ctrl, amiR-shn3, amiR-sost, or amiR-sost/shn3, and, 4 weeks later, mRNA levels of Shn3 and Sost (D) and Axin2 and Lef1 (E) in the tibia were measured by RT-PCR and normalized to Gapdh (n = 8). Femoral bone mass was assessed by microCT (F, G). Representative 3D-reconstruction (G) and relative quantification (F) are displayed (n = 8). Cort.Th, cortical thickness. Scale bar, 1 mm. Dynamic histomorphometry was performed in the metaphysis of AAV-treated femurs (H and J). (H) (Left) Representative calcein/alizarin red labeling (arrows indicate the distance between calcein and alizarin red labeling); (right) relative histomorphometric quantification of bone-formation rate (BFR)/bone surface (BS) and mineral apposition rate (MAR). (I) IHC for OPG was performed in AAV-treated femurs. (J and K) Plots showing quantification of OC.N/B.Pm and ES/BS (J) and representative images from TRAP staining (K) (n = 10). Scale bars: (G) 1 mm, (H) 50 μm, (I) 100 μm, (K) 100 μm. Values represent mean ± SD by an unpaired two-tailed Student’s t test (C) and one-way ANOVA test (A, D–F, H, J).
Figure 3
Figure 3
Bone-targeted AAV gene silencers reverse bone loss in osteoporosis (A) mRNA levels of Shn3 or Sost in the tibia of young (2-month-old) or old (20-month-old) mice (n = 5). (B) Diagram of the study and treatment methods. (C–E) Sham or OVX surgery was performed on 3-month-old female mice, and, 6 weeks later, mice were i.v. injected with rAAV9.DSS (5 × 1013 vg/kg) carrying amiR-ctrl, amiR-shn3, amiR-sost, or amiR-sost/shn3. Eight weeks later, mRNA levels of Shn3 and Sost in the tibia were assessed by RT-PCR and normalized to Hprt (C, n = 9). Femoral bone mass was assessed by microCT (D and E). Representative 3D-reconstruction (D) and relative quantification (E) are displayed (n = 5–10). Scale bar: (D) 1 mm. (F–I) Twenty-month-old male mice were i.v. injected with rAAV9.DSS (5 × 1013 vg/kg) carrying amiR-ctrl, amiR-shn3, amiR-sost, or amiR-sost/shn3, and, 2 months later, mRNA levels of Shn3 and Sost in the tibia were assessed by RT-PCR and normalized to Hprt (F, n = 6). Trabecular bone mass in femurs (G and H) and lumbar vertebrae (L4, I) were assessed by microCT. Representative 3D reconstruction (G) and relative quantification (H and I) are displayed (n = 8–10). Scale bar: (G) 1 mm. (J and K) Sham or OVX surgery was performed on 3-month-old female mice, and, 6 weeks later, mice were i.v. injected with rAAV9.DSS. Histomorphometric quantification of BFR/BS and MAR was performed 8 weeks post injection (J). Serum CTX-I levels were measured to assess in vivo osteoclast activity (K). Values represent mean ± SD by an unpaired two-tailed Student’s t test (A) and one-way ANOVA test (C, E, F, H–K).
Figure 4
Figure 4
Bone-targeted AAV gene silencers promote bone regeneration in mice (A) rAAV9.DSS.egfp (5 × 1013 vg/kg) was injected i.v. into 2-month-old mice, and, 2 weeks later, a 3-mm length of cortical bone defect was generated on the lateral aspect of the left femur. GFP expression in the cryo-sectioned femurs was monitored by fluorescence microscopy 2 weeks post surgery (n = 3). Scale bar: 100 μm. (B–D) Two-month-old mice were i.v. injected with rAAV9.DSS (5 × 1013 vg/kg) carrying amiR-ctrl, amiR-shn3, amiR-sost, or amiR-sost/shn3, and, 2 weeks later, cortical bone defect surgery was performed on the lateral aspect of the left femur. Newly formed bones in the defect areas were assessed by microCT and histology 2 weeks after the surgery (B and C). Representative trichrome-stained longitudinal sections of femurs (B, top), 2D cross-sectional microCT images (B, bottom), and relative quantification of bone volume, region of interest (ROI, C), Ob.S/BS (and osteoclast numbers per bone surface (Oc.N/BS) (D) are displayed (n = 8). Scale bars: (B, top) 200 μm, (B, bottom) 1 mm. (E) Three-month-old mice were i.v. injected with rAAV9.DSS.egfp (5 × 1013 vg/kg), and, 2 weeks later, femoral osteotomy and intramedullary fixation were performed. GFP expression on the cryo-sectioned femurs was assessed by fluorescence microscopy 1, 2, and 4 weeks postoperatively. Scale bars: (B) 200 μm, (E) 25 μm. (F–K) Three-month-old mice were i.v. injected with rAAV9.DSS (5 × 1013 vg/kg) carrying amiR-ctrl, amiR-shn3, amiR-sost, or amiR-sost/shn3, and, 2 weeks later, femoral osteotomy and intramedullary fixation were performed. Six weeks after the surgery, mRNA levels of Shn3 and Sost (F) and Axin2 (G) in the tibia were assessed by RT-PCR and normalized to Gapdh (n = 8). Tb.BV/TV in the contralateral femurs was assessed by microCT (H, n = 8). Representative radiography and microCT images of the fractured femurs 2 and 6 weeks post surgery are displayed, respectively (I). Union rate at the fracture sites was quantitated by microCT (J). Representative H&E-stained longitudinal sections of femurs at the fracture sites 6 weeks post surgery are displayed (K). Asterisk (∗) indicates fibrous tissues at persistent non-union sites. Scale bars: (I) 1 mm, (K) 200 μm. Values represent mean ± SD by a one-way ANOVA test (C, D, F–H, J).
Figure 5
Figure 5
Development of a human skeletal organoid with high bone-forming activity (A) rAAV vectors (109 GC) were incubated with decellularized mouse bone (left) or hydroxyapatite (HA)-based scaffold (right) for h at 37°C, and unbound rAAVs were removed by centrifugation. AAV titers were measured by ddPCR and normalized to PBS control. (B) Freshly harvested human bone tissue was incubated with PBS or rAAV9.DSS.egfp (4 × 1011 GC) for 2 days, and mRNA levels of BGLAP, SHN3, and egfp were measured by RT-PCR and normalized to HPRT (n = 4–6). (C) Mouse or human BMSCs were incubated with PBS or rAAV9.DSS.egfp (5 × 106 MOI), and, 2 days later, GFP expression was assessed by fluorescence microscopy. Scale bar, 500 μm. (D) Diagram of the study and treatment methods. (E and F) rAAV9.DSS.egfp (2 × 1011 GC) were incubated with HA scaffold for 1 h, and then mouse (E) or human (F) BMSCs were seeded on the rAAV9.DSS.egfp scaffold. Two days after the culture, GFP expression was assessed by immunoblotting with an anti-GFP antibody, fluorescence microscopy, or RT-PCR (n = 8). Scale bar: (E, right top) 500 μm, (E, right bottom) 100 μm, (F, left top) 100 μm, (F, left bottom) 25 μm. (G) Diagram of the construct containing a CBA promoter, hs-amiR-ctrl or hs-amiR-hSHN3 (sh-hSHN3hs-miR−33), EGFP, mTR/Wt-TR, and polyA. (H and I) Two days after incubation of human BMSCs with rAAV9.DSS carrying hs-amiR-ctrl or hs-amiR-hSHN3, AAV-transduced cells were cultured under osteogenic conditions for 4 days. GFP expression and mRNA levels of SHN3, BGLAP, or IBSP were assessed by fluorescence microscopy (H) and RT-PCR (I, n = 4), respectively. Scale bar, 100 μm. (J and K) HA scaffold was incubated with rAAV9.DSS carrying hs-amiR-ctrl or hs-amiR-hSHN3 for 1 h and then incubated with human BMSCs under osteogenic conditions for 2 days. The scaffold was implanted into the interscapular fat pads of immunodeficient SCID mice, and, 4 weeks later, bone accrual was assessed by microCT (J). Representative 2D images (J, top) and relative quantification showing bone thickness and distribution (J, bottom) of the HA scaffold are displayed (n = 5). Non-treated HA scaffold was used as a negative control (HA only, J). Alternatively, longitudinal sections of the scaffold were stained for H&E (K, top) and trichrome (K, middle) and immuno-stained for BGLAP (K, bottom). Scale bars: (J) 100 μm, (K) 100 μm. Values represent mean ± SD by an unpaired two-tailed Student’s t test (B, F, I) and one-way ANOVA test (A, J).
Figure 6
Figure 6
Bone-targeted AAV gene silencers promote healing of critical-sized bone defects (A and B) Three-month-old mice were i.v. injected with rAAV9.DSS (5 × 1013 vg/kg) carrying amiR-ctrl, amiR-shn3, amiR-sost, or amiR-sost/shn3 and, 2 weeks later, implantation of isograft into the osteotomy sites was performed on the left femurs. Twelve weeks later, total bridging between the implanted isograft and the host bone was assessed by microCT. Representative images (A) and percentage (B) of total bridging are displayed (n = 5–6). Scale bar: (A) 1 mm. (C–E) Decellularized isograft was incubated with PBS or rAAV9.DSS.egfp for 1 h, and then the PBS-treated or rAAV9.DSS.egfp-attached isograft was implanted into the osteotomy sites of the left femurs. Three weeks later, GFP expression in individual tissues was monitored by IVIS-100 optical imaging (C) and fluorescence microscopy (D and E). For the tissue distribution study of systemically delivered rAAV9.DSS, rAAV9.DSS.egfp (5 × 1013 vg/kg) was i.v. injected (n = 3). HB, host bone. Arrows indicate AAV-transduced osteoblasts. Scale bars: (D) 25 μm, (E) 100 μm. (F–H) Decellularized isograft was incubated with rAAV9.DSS (2 × 1011 GC) carrying amiR-ctrl, amiR-shn3, or amiR-sost for 1 h, and then rAAV9.DSS-isograft was implanted into the osteotomy sites of the left femurs. Twelve weeks later, the total bridging between the implanted isograft and the host bone was assessed by radiography and microCT (F and G). As a positive control, an autograft bone was implanted into the osteotomy sites. Representative radiography and microCT images (F), percentage of total bridging (G, n = 15), and H&E-stained longitudinal sections in the osteotomy sites (H) are displayed. Scale bars: (F) 1 mm, (H, top) 400 μm, (H, bottom) 100 μm. Values represent mean ± SD by a one-way ANOVA test (A and G).

References

    1. Langdahl B., Ferrari S., Dempster D.W. Bone modeling and remodeling: potential as therapeutic targets for the treatment of osteoporosis. Ther. Adv. Musculoskelet. Dis. 2016;8:225–235. - PMC - PubMed
    1. Eastell R., Christiansen C., Grauer A., Kutilek S., Libanati C., McClung M.R., et al. Effects of denosumab on bone turnover markers in postmenopausal osteoporosis. J. Bone Miner Res. 2011;26:530–537. - PubMed
    1. Rasmusson L., Abtahi J. Bisphosphonate associated osteonecrosis of the jaw: an update on pathophysiology, risk factors, and treatment. Int. J. Dent. 2014;2014:471035. - PMC - PubMed
    1. Gerstenfeld L.C., Sacks D.J., Pelis M., Mason Z.D., Graves D.T., Barrero M., et al. Comparison of effects of the bisphosphonate alendronate versus the RANKL inhibitor denosumab on murine fracture healing. J. Bone Miner Res. 2009;24:196–208. - PMC - PubMed
    1. Russow G., Jahn D., Appelt J., Mardian S., Tsitsilonis S., Keller J. Anabolic therapies in osteoporosis and bone regeneration. Int. J. Mol. Sci. 2018;20 - PMC - PubMed

Publication types

Substances