

The combined role of PET/CT metabolic parameters and inflammatory markers in detecting extensive disease in small cell lung cancer
- PMID: 36185188
- PMCID: PMC9515531
- DOI: 10.3389/fonc.2022.960536
The combined role of PET/CT metabolic parameters and inflammatory markers in detecting extensive disease in small cell lung cancer
Abstract
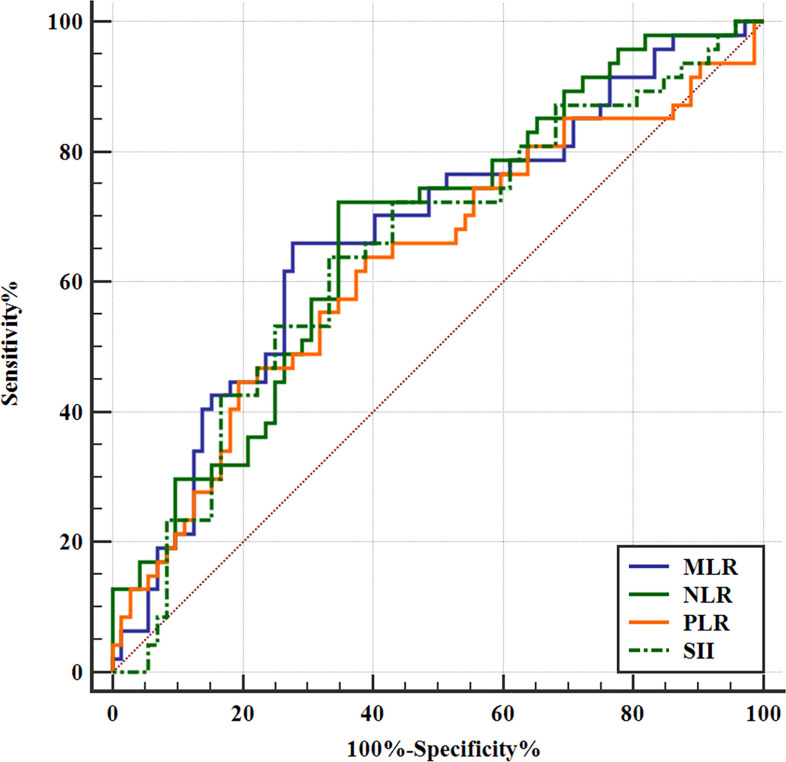
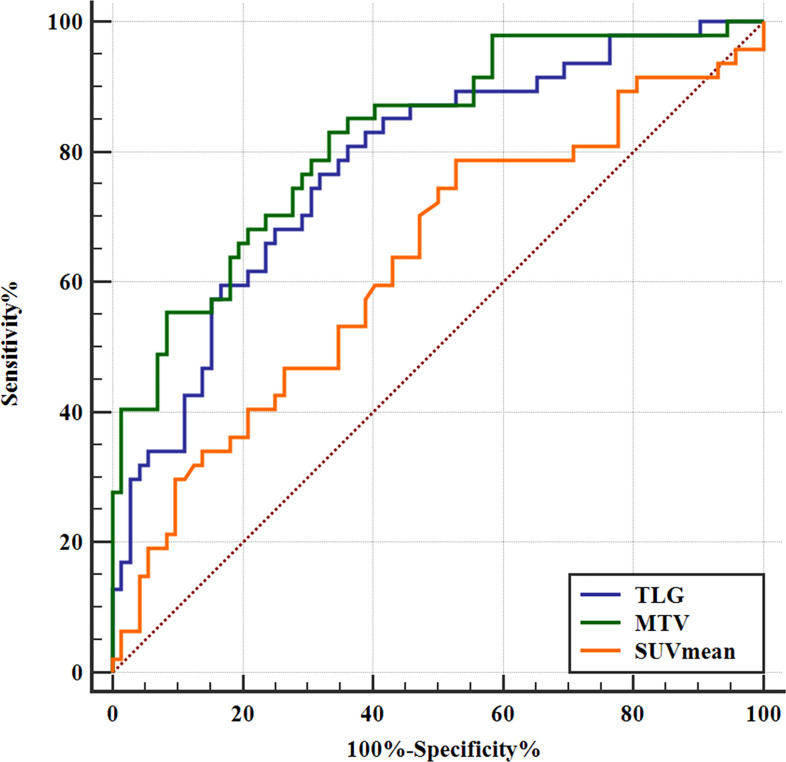
The combined role of inflammatory markers [including neutrophil/lymphocyte ratio (NLR), platelet/lymphocyte ratio (PLR), monocyte/lymphocyte ratio (MLR), and systemic immune-inflammation index (SII)] and PET/CT metabolic parameters [including maximum standardized uptake value (SUVmax), mean standardized uptake value (SUVmean), metabolic tumor volume (MTV), and TLG (total lesion glycolysis)] at baseline in evaluating the binary stage [extensive-stage disease (ED) and limited-stage disease (LD)] of small cell lung cancer (SCLC) is unclear. In this study, we verified that high metabolic parameters and inflammatory markers were related to the binary stage of SCLC patients, respectively (p < 0.05). High inflammatory markers were also associated with high MTV and TLG in patients with SCLC (p < 0.005). Moreover, the incidences of co-high metabolic parameters and inflammatory markers were higher in ED-SCLC (p < 0.05) than those in LD-SCLC. Univariate logistic regression analysis demonstrated that Co-high MTV/NLR, Co-high MTV/MLR, Co-high MTV/SII, Co-high TLG/NLR, Co-high TLG/MLR, and Co-high TLG/SII were significantly related to the binary stage of SCLC patients (p = 0.00). However, only Co-high MTV/MLR was identified as an independent predictor for ED-SCLC (odds ratio: 8.67, 95% confidence interval CI: 3.51-21.42, p = 0.000). Our results suggest that co-high metabolic parameters and inflammatory markers could be of help for predicting ED-SCLC at baseline. Together, these preliminary findings may provide new ideas for more accurate staging of SCLC.
Keywords: MTV/MLR; PET/CT; SCLC; inflammatory markers; metabolic parameters.
Copyright © 2022 Hu, Sun, Li, Li, Li and Hu.
Conflict of interest statement
The authors declare that the research was conducted in the absence of any commercial or financial relationships that could be construed as a potential conflict of interest.
Figures
Similar articles
-
Prognostic significance of neutrophil/lymphocyte ratio (NLR) and correlation with PET-CT metabolic parameters in small cell lung cancer (SCLC).Int J Clin Oncol. 2019 Feb;24(2):168-178. doi: 10.1007/s10147-018-1338-8. Epub 2018 Aug 14. Int J Clin Oncol. 2019. PMID: 30109543
-
Prognostic impact of the 18F-fluorodeoxyglucose positron-emission tomography/computed tomography metabolic parameters and correlation with hematological inflammatory markers in lung cancer.J Cancer Res Ther. 2021 Jul-Sep;17(4):925-930. doi: 10.4103/jcrt.JCRT_1046_20. J Cancer Res Ther. 2021. PMID: 34528543
-
Correlation study on 18F-FDG PET/CT metabolic characteristics of primary lesion with clinical stage in lung cancer.Q J Nucl Med Mol Imaging. 2021 Jun;65(2):172-177. doi: 10.23736/S1824-4785.19.03146-7. Epub 2019 Mar 25. Q J Nucl Med Mol Imaging. 2021. PMID: 30916535
-
Metabolic parameters with different thresholds for evaluating tumor recurrence and their correlations with hematological parameters in locally advanced squamous cell cervical carcinoma: an observational 18F-FDG PET/CT study.Quant Imaging Med Surg. 2019 Mar;9(3):440-452. doi: 10.21037/qims.2019.02.09. Quant Imaging Med Surg. 2019. PMID: 31032191 Free PMC article.
-
Clinical impact of inflammatory and nutrition index based on metabolic tumor activity in non‑small cell lung cancer treated with immunotherapy.Oncol Lett. 2024 Jan 19;27(3):110. doi: 10.3892/ol.2024.14243. eCollection 2024 Mar. Oncol Lett. 2024. PMID: 38304175 Free PMC article.
Cited by
-
The association of metabolic positron emission tomography/computed tomography parameters with survival in small cell lung cancer.Ann Saudi Med. 2025 Jan-Feb;45(1):25-32. doi: 10.5144/0256-4947.2025.25. Epub 2025 Feb 6. Ann Saudi Med. 2025. PMID: 39929786 Free PMC article.
-
Hematological characteristics of COVID-19 patients with fever infected by the Omicron variant in Shanghai: A retrospective cohort study in China.J Clin Lab Anal. 2023 Jan;37(1):e24808. doi: 10.1002/jcla.24808. Epub 2022 Dec 16. J Clin Lab Anal. 2023. PMID: 36525342 Free PMC article.
-
Brian [18F]FDG PET associations of cervical cancer-related peripheral inflammatory markers.Front Oncol. 2025 Jun 26;15:1598911. doi: 10.3389/fonc.2025.1598911. eCollection 2025. Front Oncol. 2025. PMID: 40666098 Free PMC article.
References
LinkOut - more resources
Full Text Sources
Research Materials