

Human PSCs determine the competency of cerebral organoid differentiation via FGF signaling and epigenetic mechanisms
- PMID: 36185382
- PMCID: PMC9523398
- DOI: 10.1016/j.isci.2022.105140
Human PSCs determine the competency of cerebral organoid differentiation via FGF signaling and epigenetic mechanisms
Abstract
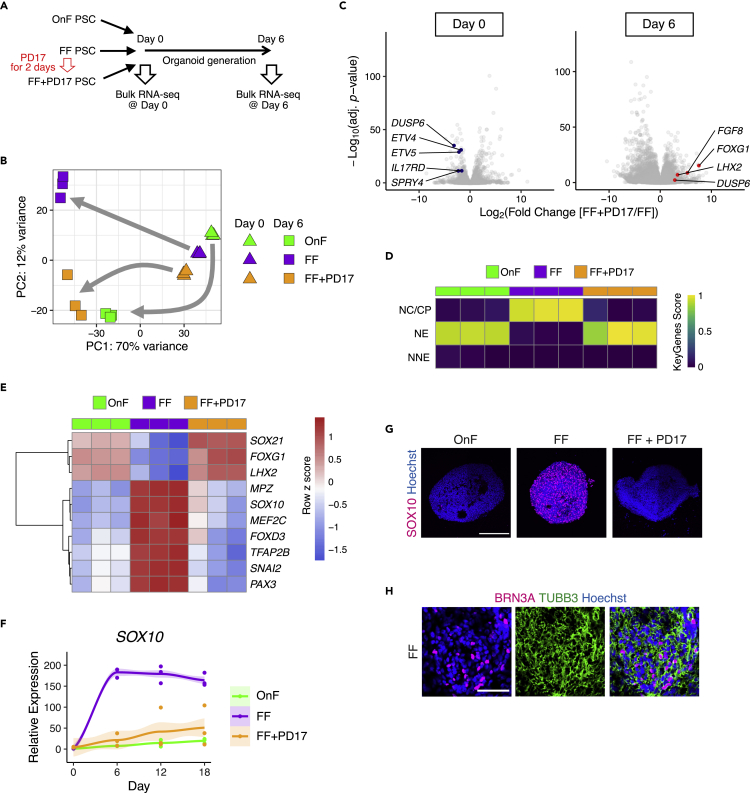
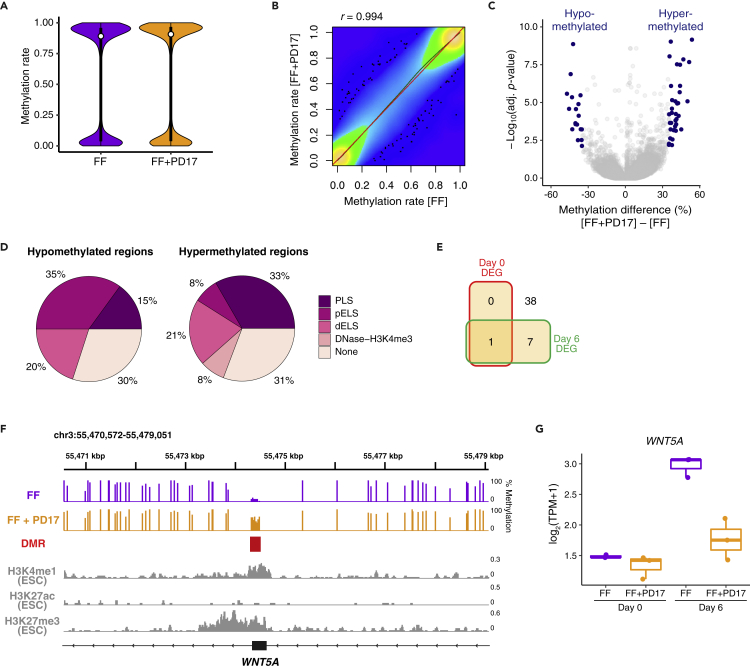
Various culture methods have been developed for maintaining human pluripotent stem cells (PSCs). These PSC maintenance methods exhibit biased differentiation; for example, feeder-dependent PSCs efficiently yield cerebral organoids, but it is difficult to generate organoids from feeder-free PSCs. It remains unknown how PSC maintenance conditions affect differentiation. In this study, we identified fibroblast growth factor (FGF) signaling in feeder-free PSC maintenance as a key factor that determines the differentiation toward cerebral organoids. The inhibition of FGF signaling in feeder-free PSCs rescued organoid generation to the same level in feeder-dependent cultures. FGF inhibition induced DNA methylation at the WNT5A locus, and this epigenetic change suppressed the future activation of non-canonical Wnt signaling after differentiation, leading to reliable cerebral organoid generation. This study underscores the importance of PSC culture conditions for directed differentiation into cerebral organoids, and the epigenetic status regulated by FGF signaling is involved in the underlying mechanisms.
Keywords: Cell biology; Genomics; Omics; Stem cells research; Transcriptomics.
© 2022 The Author(s).
Conflict of interest statement
H.O. is a compensated scientific consultant for SanBio Co. Ltd. and K Pharma Inc. These companies have no relationship with the present study. The other authors declare no competing interest.
Figures


Similar articles
-
Novel culture system via wirelessly controllable optical stimulation of the FGF signaling pathway for human and pig pluripotency.Biomaterials. 2021 Feb;269:120222. doi: 10.1016/j.biomaterials.2020.120222. Epub 2020 Jul 15. Biomaterials. 2021. PMID: 32736809
-
A Simple Method for Generating Cerebral Organoids from Human Pluripotent Stem Cells.Int J Stem Cells. 2022 Feb 28;15(1):95-103. doi: 10.15283/ijsc21195. Int J Stem Cells. 2022. PMID: 35220295 Free PMC article.
-
3D organoid cultivation improves the maturation and functional differentiation of cholangiocytes from human pluripotent stem cells.Front Cell Dev Biol. 2024 Jul 8;12:1361084. doi: 10.3389/fcell.2024.1361084. eCollection 2024. Front Cell Dev Biol. 2024. PMID: 39040044 Free PMC article.
-
Pluripotent stem cell-derived kidney organoids: An in vivo-like in vitro technology.Eur J Pharmacol. 2016 Nov 5;790:12-20. doi: 10.1016/j.ejphar.2016.06.059. Epub 2016 Jul 1. Eur J Pharmacol. 2016. PMID: 27375081 Review.
-
FGF Signaling Pathway: A Key Regulator of Stem Cell Pluripotency.Front Cell Dev Biol. 2020 Feb 18;8:79. doi: 10.3389/fcell.2020.00079. eCollection 2020. Front Cell Dev Biol. 2020. PMID: 32133359 Free PMC article. Review.
Cited by
-
Validation of non-destructive morphology-based selection of cerebral cortical organoids by paired morphological and single-cell RNA-seq analyses.Stem Cell Reports. 2024 Nov 12;19(11):1635-1646. doi: 10.1016/j.stemcr.2024.09.005. Epub 2024 Oct 10. Stem Cell Reports. 2024. PMID: 39393360 Free PMC article.
-
Recapitulation and investigation of human brain development with neural organoids.IBRO Neurosci Rep. 2023 Dec 27;16:106-117. doi: 10.1016/j.ibneur.2023.12.006. eCollection 2024 Jun. IBRO Neurosci Rep. 2023. PMID: 39007085 Free PMC article.
-
Rapid and Robust Multi-Phenotypic Assay System for ALS Using Human iPS Cells with Mutations in Causative Genes.Int J Mol Sci. 2023 Apr 10;24(8):6987. doi: 10.3390/ijms24086987. Int J Mol Sci. 2023. PMID: 37108151 Free PMC article.
-
Chd5 Regulates the Transcription Factor Six3 to Promote Neuronal Differentiation.Stem Cells. 2023 Mar 17;41(3):242-251. doi: 10.1093/stmcls/sxad002. Stem Cells. 2023. PMID: 36636025 Free PMC article.
-
Progranulin enhances the engraftment of transplanted human iPS cell-derived cerebral neurons.Stem Cells Transl Med. 2024 Nov 12;13(11):1113-1128. doi: 10.1093/stcltm/szae066. Stem Cells Transl Med. 2024. PMID: 39340829 Free PMC article.
References
-
- Benito-Kwiecinski S., Giandomenico S.L., Sutcliffe M., Riis E.S., Freire-Pritchett P., Kelava I., Wunderlich S., Martin U., Wray G.A., McDole K., et al. An early cell shape transition drives evolutionary expansion of the human forebrain. Cell. 2021;184:2084–2102.e19. doi: 10.1016/j.cell.2021.02.050. - DOI - PMC - PubMed
LinkOut - more resources
Full Text Sources
Other Literature Sources
Molecular Biology Databases
