. 2022 Sep 15:14:980636.
doi: 10.3389/fnagi.2022.980636. eCollection 2022.

Long-term gamma transcranial alternating current stimulation improves the memory function of mice with Alzheimer's disease

Affiliations

Long-term gamma transcranial alternating current stimulation improves the memory function of mice with Alzheimer's disease

Linyan Wu et al. Front Aging Neurosci. .

Abstract

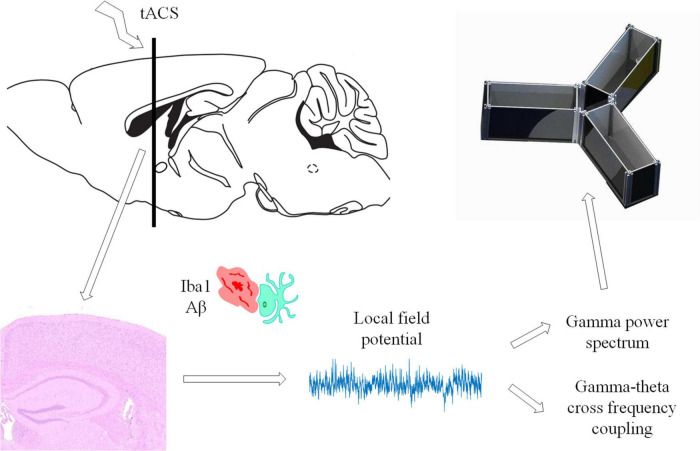
Background: The main manifestation of Alzheimer's disease (AD) in patients and animal models is impaired memory function, characterized by amyloid-beta (Aβ) deposition and impairment of gamma oscillations that play an important role in perception and cognitive function. The therapeutic effect of gamma band stimulation in AD mouse models has been reported recently. Transcranial alternating current stimulation (tACS) is an emerging non-invasive intervention method, but at present, researchers have not completely understood the intervention effect of tACS. Thus, the intervention mechanism of tACS has not been fully elucidated, and the course of treatment in clinical selection also lacks theoretical support. Based on this issue, we investigated the effect of gamma frequency (40 Hz) tACS at different durations in a mouse model of AD.

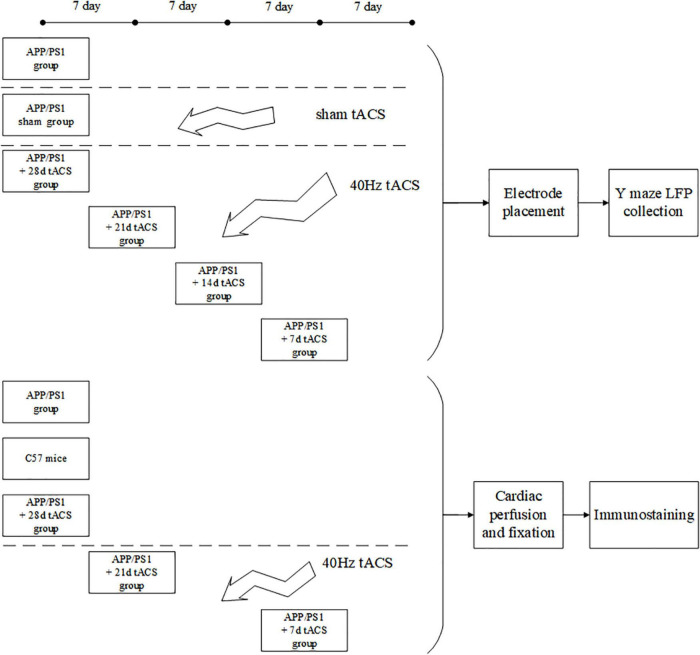
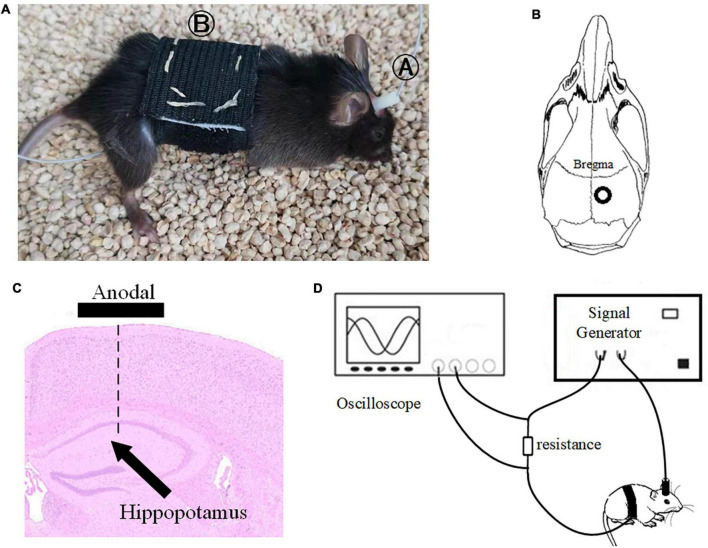
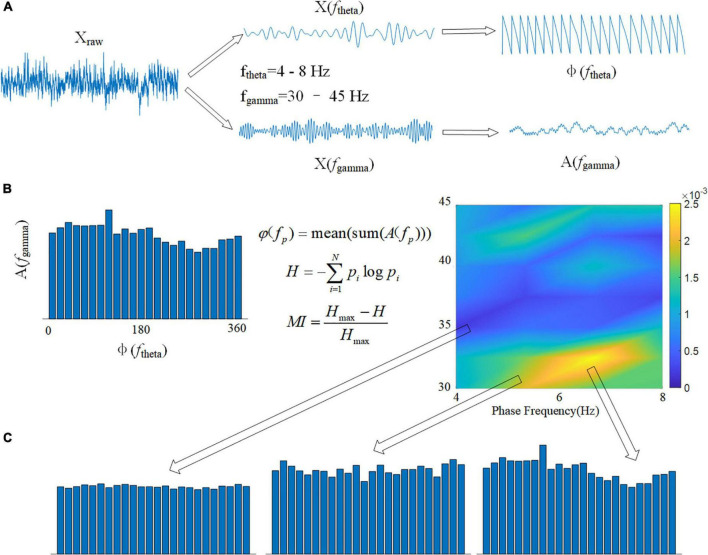
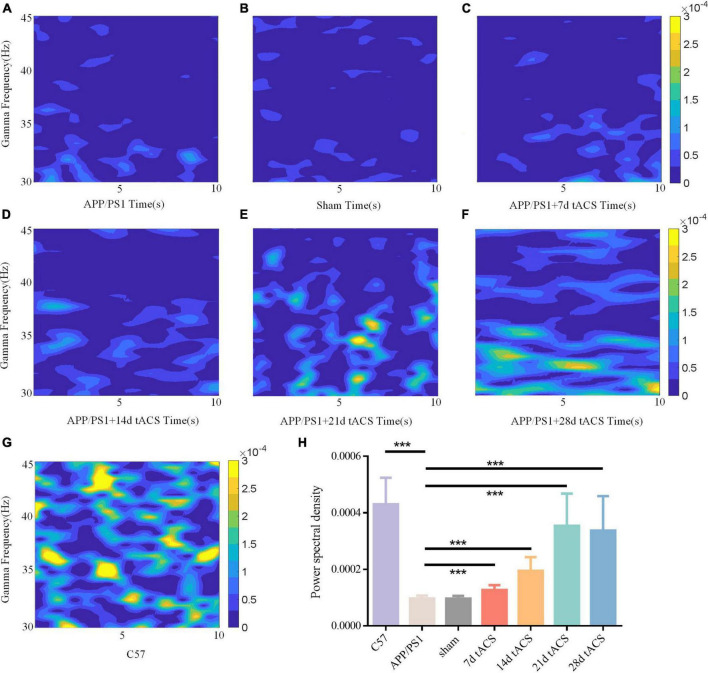
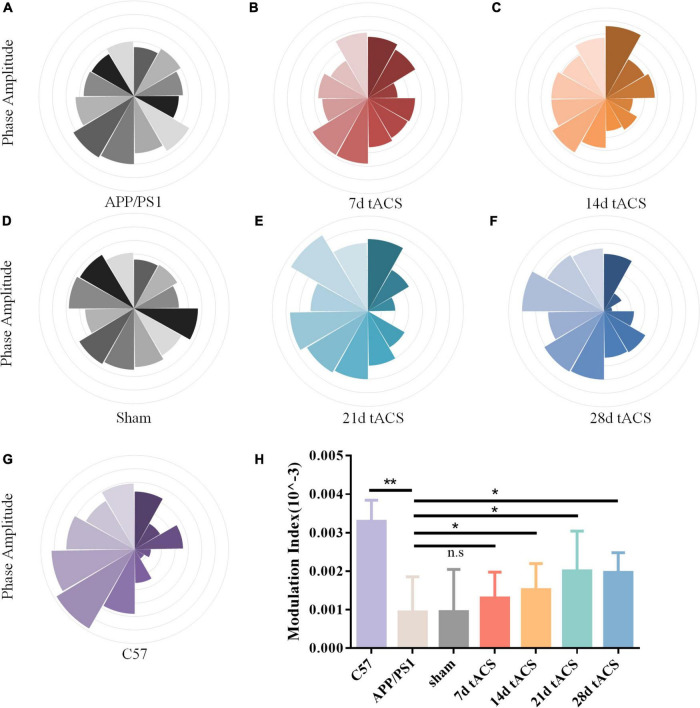
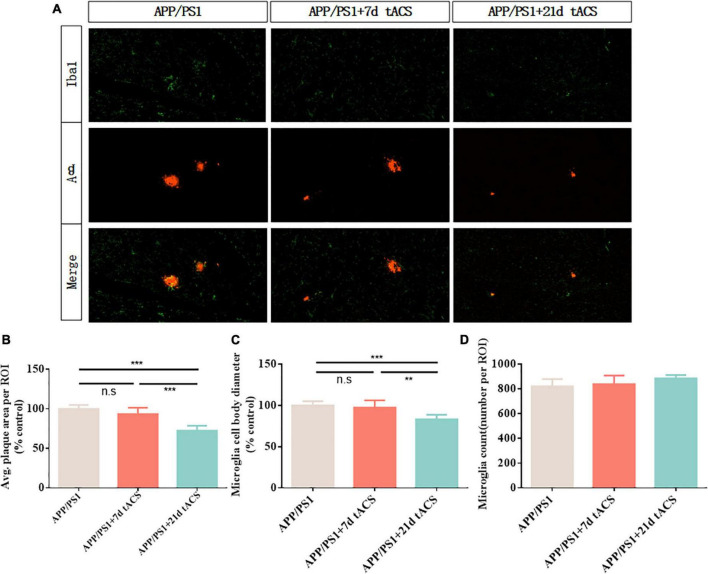
Materials and methods: We placed stimulating electrodes on the skull surface of APP/PS1 and wild-type control mice (n = 30 and n = 5, respectively). Among them, 20 APP/PS1 mice were divided into 4 groups to receive 20 min 40 Hz tACS every day for 1-4 weeks. The other 10 APP/PS1 mice were equally divided into two groups to receive sham treatment and no treatment. No intervention was performed in the wild-type control mice. The short-term memory function of the mice was examined by the Y maze. Aβ levels and microglia in the hippocampus were measured by immunofluorescence. Spontaneous electroencephalogram gamma power was calculated by the average period method, and brain connectivity was examined by cross-frequency coupling.

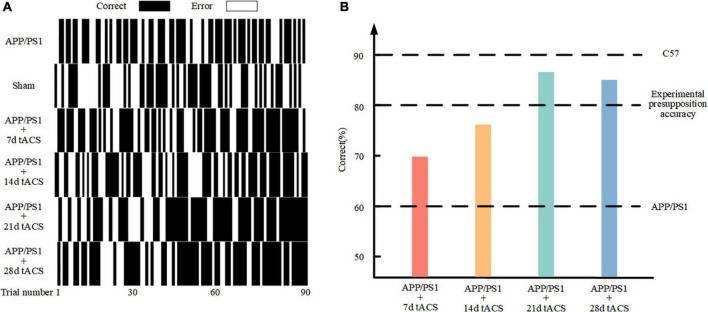
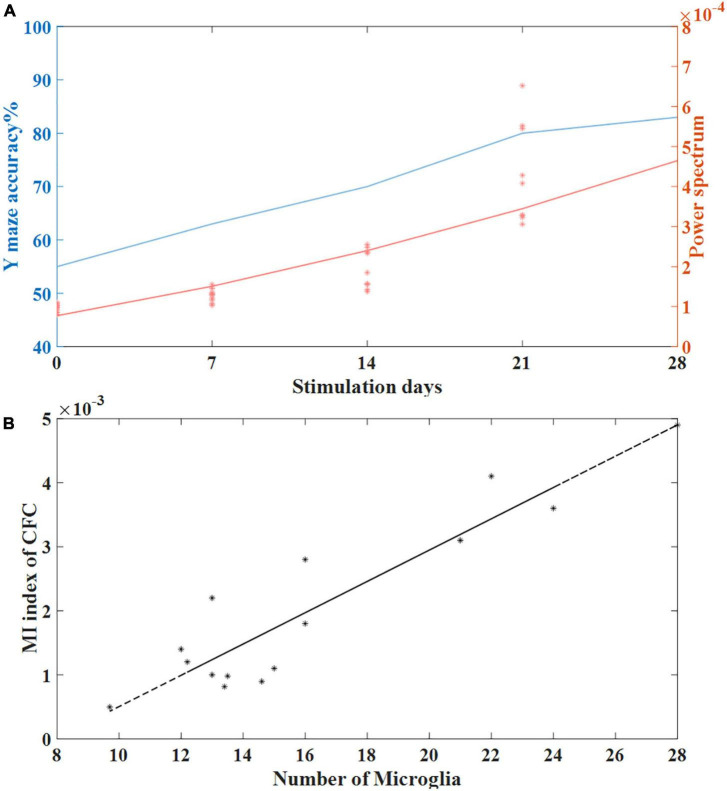
Results: We found that the long-term treatment groups (21 and 28 days) had decreased hippocampal Aβ levels, increased electroencephalogram spontaneous gamma power, and ultimately improved short-term memory function. The treatment effect of the short-term treatment group (7 days) was not significant. Moreover, the treatment effect of the 14-day treatment group was weaker than that of the 21-day treatment group.

Conclusion: These results suggest that long-term gamma-frequency tACS is more effective in treating AD by reducing Aβ load and improving gamma oscillation than short-term gamma-frequency tACS.

Keywords: APP/PS1; beta-amyloid; hippocampus; microglia; transcranial alternating current stimulation.


Conflict of interest statement

The authors declare that the research was conducted in the absence of any commercial or financial relationships that could be construed as a potential conflict of interest.

Figures

FIGURE 1
FIGURE 1
Experimental flow chart.
FIGURE 2
FIGURE 2
Stimulation diagram. (A) Schematic diagram of mouse stimulation. A and B are two electrodes. (B,C) Stimulation target. (D) We used an oscilloscope to monitor the stimulation current in real time to ensure the efficiency of the stimulation electrode.
FIGURE 3
FIGURE 3
Calculation flowchart for MI. (A) The original signal Xraw is filtered in two frequency bands, and the phase of the theta band φ(ftheta) and the amplitude of the gamma band A(fgamma) are calculated using the Hilbert transform. (B) Using the modulation index formula φ(fp), calculate the average value of all amplitudes A(fgamma) corresponding to each 15° phase in boxes. The spectrum of MI can be drawn using 1 Hz as the phase frequency step and 2 Hz as the amplitude frequency step. (C) The variance of MI is represented by the depth of color in the spectrum.
FIGURE 4
FIGURE 4
(A) Behavioral results in the Y maze. (B) Comparison of 90 behavioral results in the different stimulation time groups.
FIGURE 5
FIGURE 5
(A) APP/PS1 group power spectrum, (B) sham group power spectrum, (C) 7-day APP/PS1 group power spectrum, (D) 14-day APP/PS1 group power spectrum, (E) 21-day APP/PS1 group power spectrum, (F) 28-day APP/PS1 group power spectrum, (G) C57 group power spectrum. (H) Spontaneous gamma power between different groups, * indicates P < 0.05, ** indicates P < 0.01. n = 5 mice for each group. The power spectral density of C57 group was 0.000433 ± 0.000127, APP/PS1 group was 0.000092 ± 0.000035, sham group was 0.00009 ± 0.000015, 7 days tACS group was 0.000138 ± 0.000055, 14 days tACS group was 0.000204 ± 0.000072, 21 days tACS group was 0.000377 ± 0.000141, and 28 days tACS group was 0.000364 ± 0.000153.
FIGURE 6
FIGURE 6
(A) APP/PS1 group MI spectrum, (B) 21 days APP/PS1 group MI spectrum, (C) 28 days APP/PS1 group MI spectrum, (D) sham group MI spectrum, (E) 21 days APP/PS1 group MI spectrum, (F) 28 days APP/PS1 group MI spectrum, (G) C57 group MI spectrum, (H) MI of CFC between different groups, * indicates P < 0.05, ** indicates P < 0.01. n = 5 mice for each group. The MI index of mice in C57 group was 0.0033 ± 0.0006, the MI index of mice in APP/PS1 group was 0.0009 ± 0.0009, the MI index of mice in sham group was 0.001 ± 0.0011, the MI index of mice in 7 days tACS group was 0.0013 ± 0.0025, the MI index of mice in 14 days tACS group was 0.0016 ± 0.0006, the MI index of mice in 21 days tACS group was 0.0021 ± 0.0011, and the MI index of mice in 28 days tACS group was 0.0020 ± 0.0005.
FIGURE 7
FIGURE 7
Transcranial alternating current stimulation induces a microglial response in the hippocampus of APP/PS1 mice. (A) Immunohistochemistry with anti-Iba1 and anti-Aβ antibodies in the hippocampus of APP/PS1 mice. (B) Average area of Aβ-positive plaques in the hippocampus. (C) Diameter of Iba1-positive microglial cell bodies in the hippocampus. (D) Number of Iba1-positive microglia in the hippocampus. ** Indicates P < 0.01,*** indicates P < 0.001. n = 5 mice for each group. The marks in the diagram represent data points. The Aβ area of mice in 7 days tACS group was 96% ± 2.1% of that of APP/PS1 group. The Aβ area of mice in 21 days tACS group was 77% ± 6.9% of that of APP/PS1 group. The microglia diameter of mice in 7 days tACS group was 98% ± 1.6% of that of APP/PS1 group. The microglia diameter of mice in 21 days tACS group was 81% ± 5.3% of that of APP/PS1 group.
FIGURE 8
FIGURE 8
(A) The relationship between stimulation time and behavioral accuracy and the relationship between stimulation time and spontaneous gamma power spectrum. (B) Correlation between the number of microglia and the MI index of CFC in the tACS treatment groups (n = 20). The line is the best-fit linear regression (stars), with correlation r = 0.92 (Pearson, P < 0.01).
FIGURE 9
FIGURE 9
Summary diagram showing that long-term tACS improves the memory function of AD mice.

References

    1. Abbott A., Dolgin E. (2016). Leading Alzheimer’s theory survives drug failure. Nature 540 15–16. 10.1038/nature.2016.21045 - DOI - PubMed
    1. Bamberger M. E., Harris M. E., McDonald D. R., Husemann J., Landreth G. E. A. (2003). cell surface receptor complex for fibrillar beta-amyloid mediates microglial activation. J. Neurosci. 23 2665–2674. 10.1523/JNEUROSCI.23-07-02665.2003 - DOI - PMC - PubMed
    1. Belluscio M. A., Mizuseki K., Schmidt R., Kempter R., Buzsaki G. (2012). Cross-frequency phase–phase coupling between theta and gamma oscillations in the hippocampus. J. Neurosci. 32:423. 10.1523/JNEUROSCI.4122-11.2012 - DOI - PMC - PubMed
    1. Bero A. W., Yan P., Roh J. H., Cirrito J. R., Stewart F. R., Raichle M. E., et al. (2011). Neuronal activity regulates the regional vulnerability to amyloid-b deposition. Nat. Neurosci. 14 750–756. 10.1038/nn.2801 - DOI - PMC - PubMed
    1. Brown M. R., Radford S. E., Hewitt E. W. (2013). Modulation of β-amyloid fibril formation in Alzheimer’s disease by microglia and infection. Front. Mol. Neurosci. 13:609073. 10.3389/fnmol.2020.609073 - DOI - PMC - PubMed

LinkOut - more resources