. 2022 Sep 6;12(15):6527-6547.
doi: 10.7150/thno.74053. eCollection 2022.

Single-cell transcriptome profiling of the human endometrium of patients with recurrent implantation failure

Affiliations

Single-cell transcriptome profiling of the human endometrium of patients with recurrent implantation failure

Zhen-Zhen Lai et al. Theranostics. .

Abstract

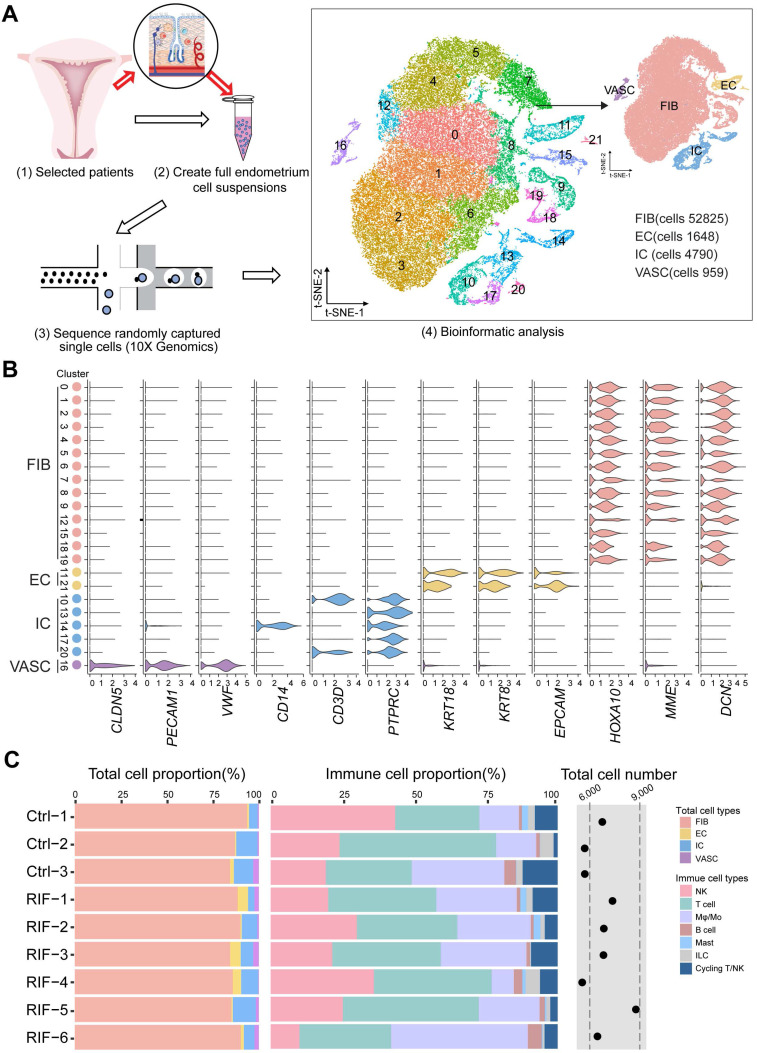
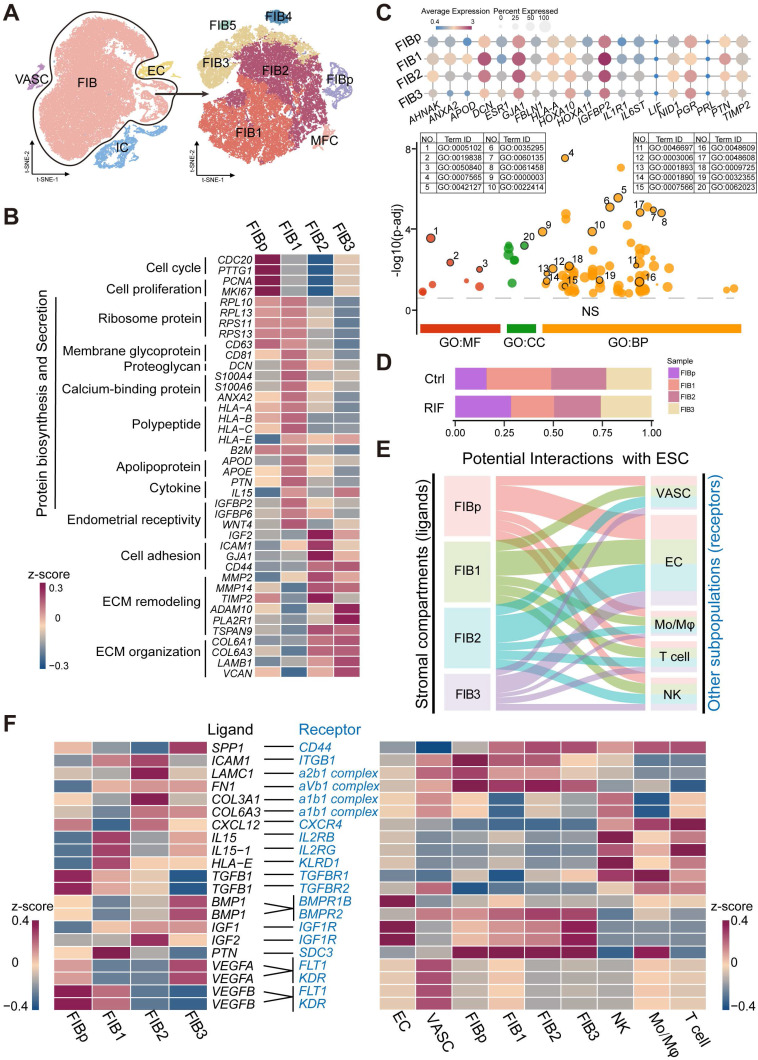
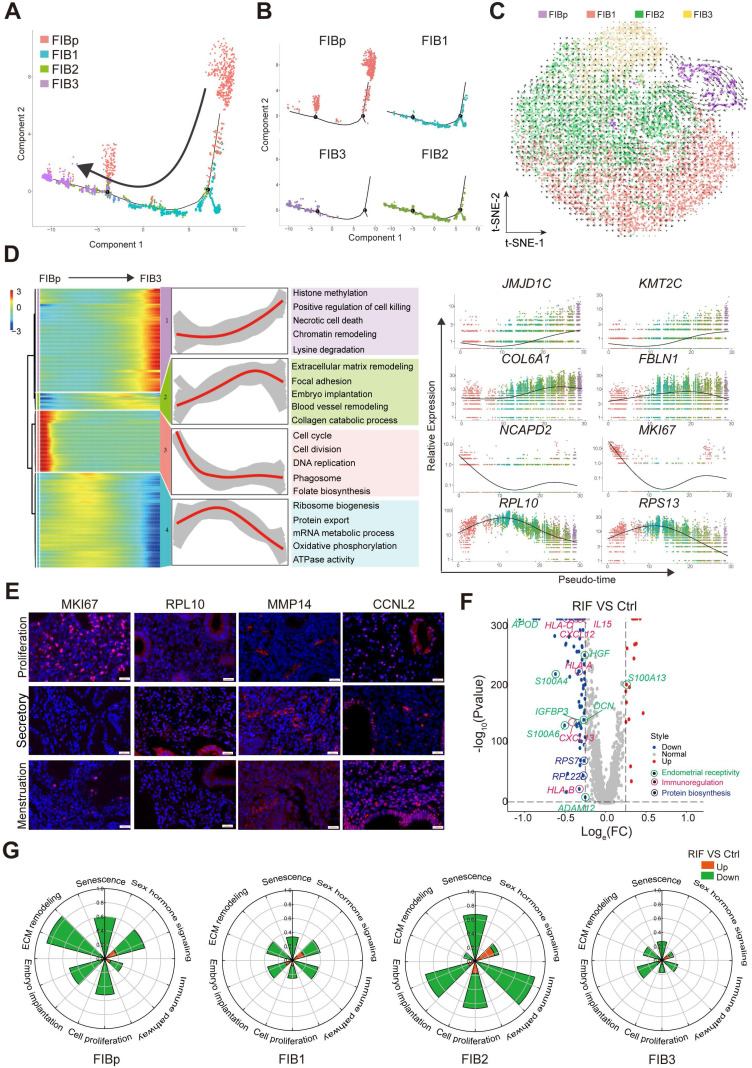
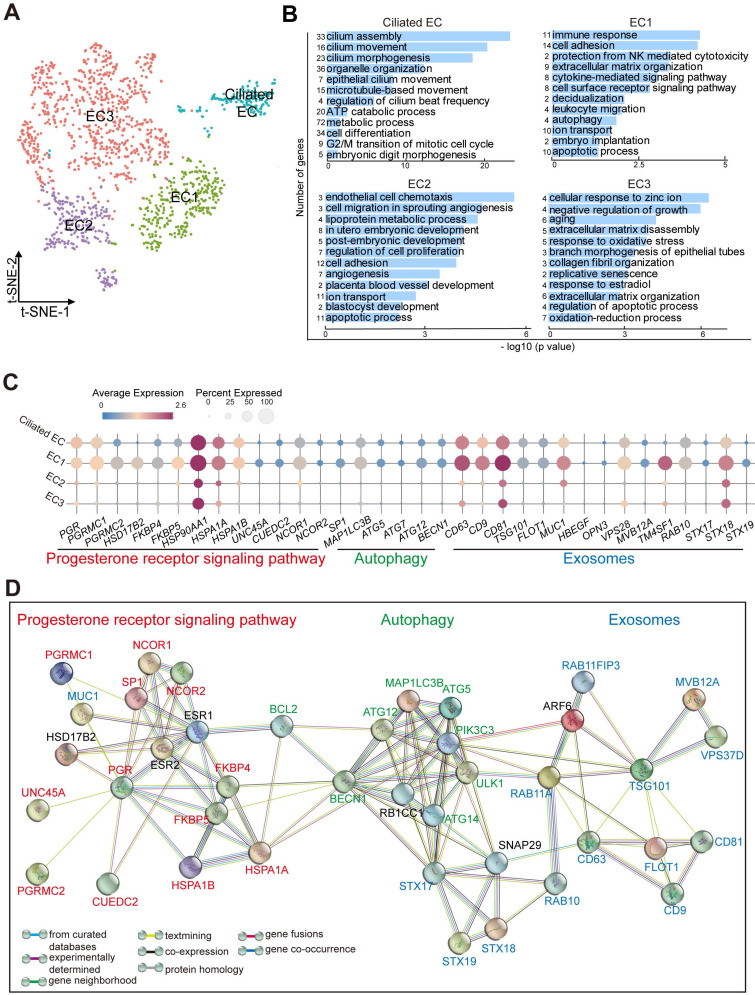
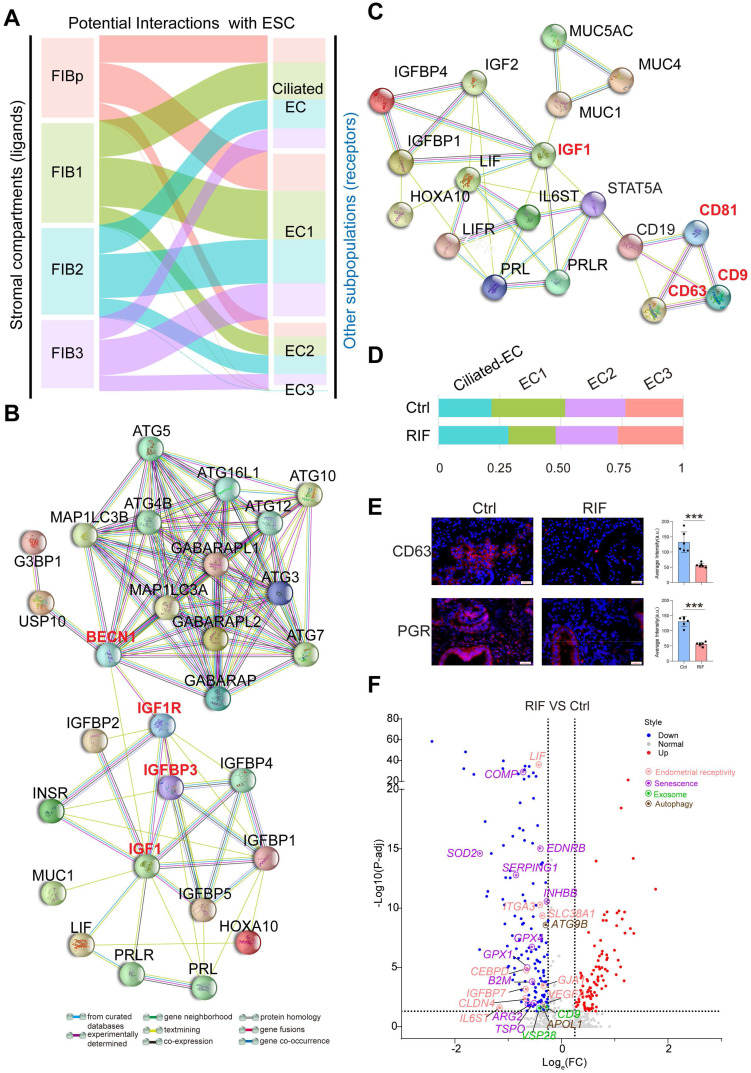
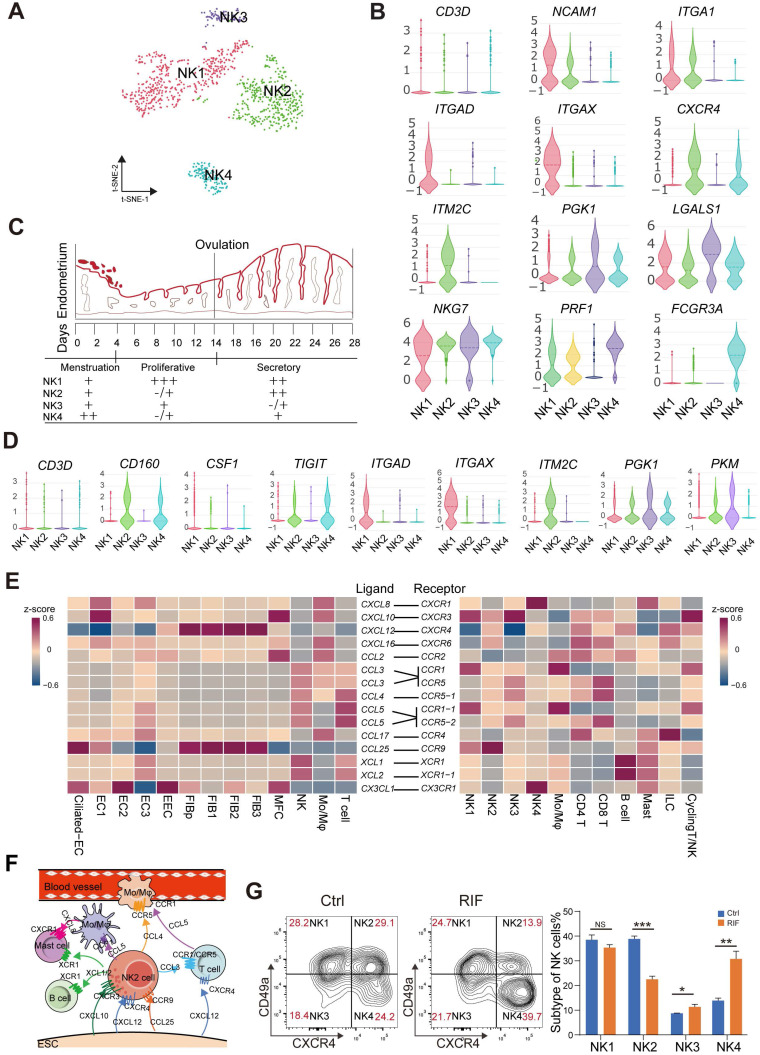
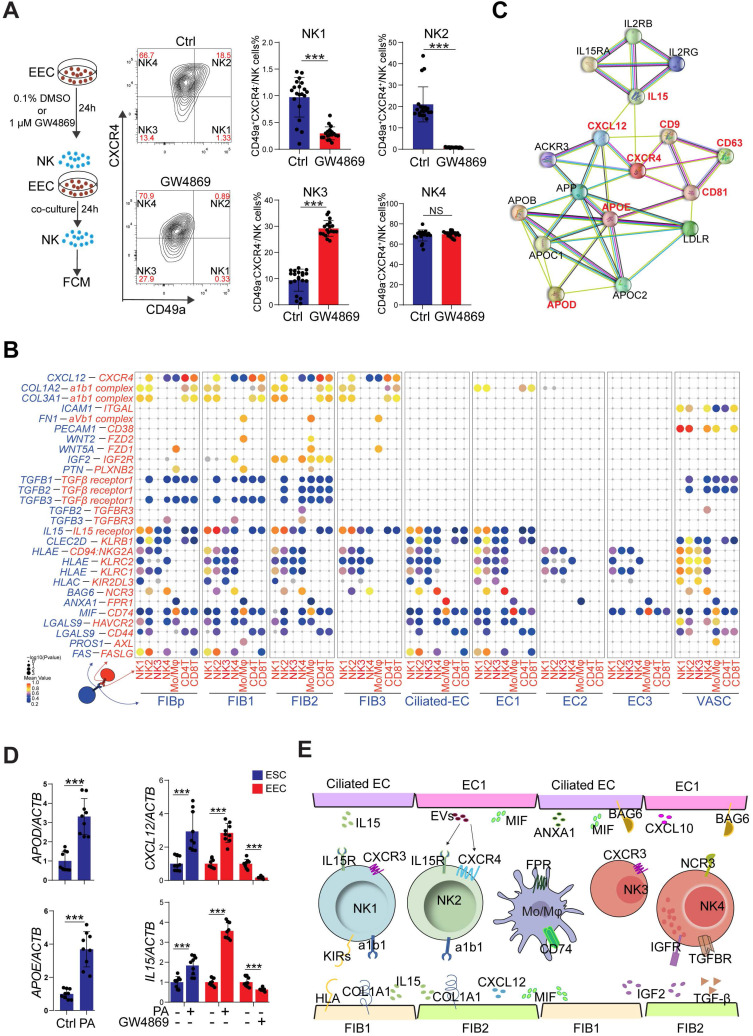
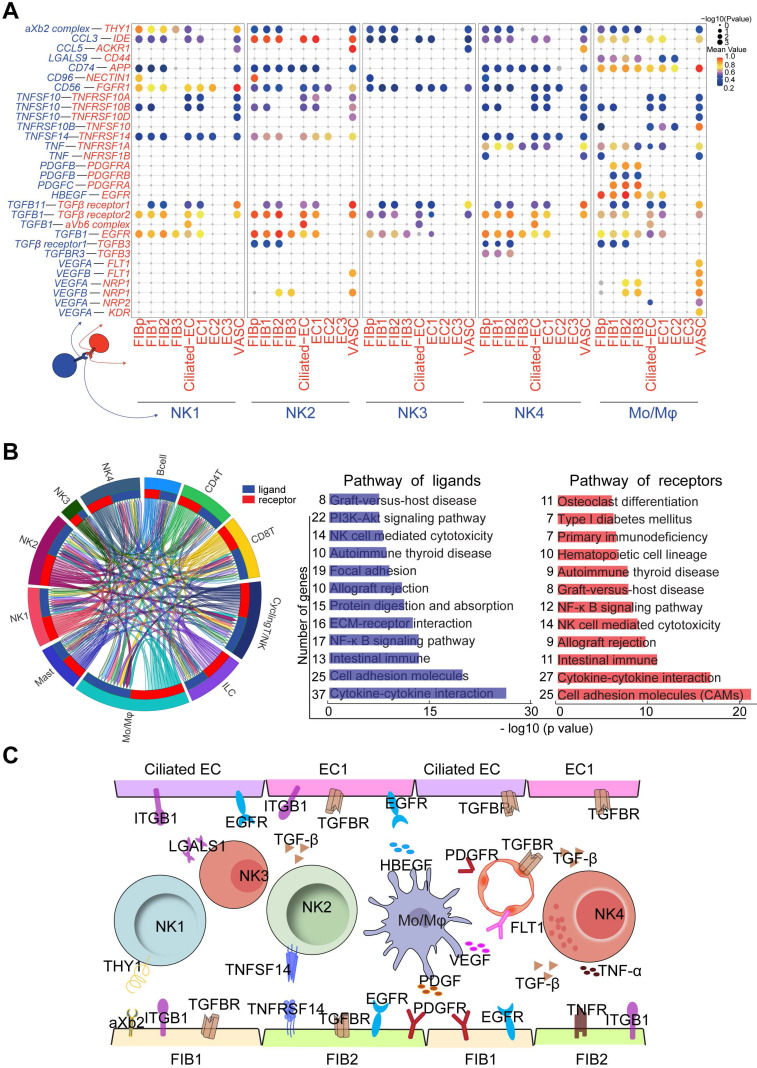
Introduction: Despite great advances in assisted reproductive technology (ART), recurrent implantation failure (RIF) cannot be effectively avoided. Notably, cellular characteristics and communication that regulate endometrial receptivity and differentiation, and its disorders in RIF at window of implantation (WOI) remain rudimentary. Objectives: In this study, we profiled the endometrial cells present at the WOI timing in RIF patients and healthy controls using single-cell RNA sequencing (scRNA-seq) and provided a detailed molecular and cellular map of a healthy and RIF endometrium at the WOI. Method: In the current study, the endometrium from RIF patient (n = 6; age range, 32 - 35 years) and control (Ctrl) (n = 3; age range, 29 - 35 years) groups were studied at a single-cell resolution. single-cell RNA-seq and analysis were performed on the endometrium of patients with RIF and Ctrl. Immunofluorescence, flow cytometry assays, and quantitative real-time polymerase chain reaction (qRT-PCR) were performed to verify cellular identity and function. Results: We profiled the transcriptomes of 60222 primary human endometrial cells isolated from control and RIF patients at a single-cell resolution. We discovered dramatic differential expression of endometrial receptivity-related genes in four major endometrial fibroblast-like cells from RIF patients compared to the control endometrium. We observed that CD49a+CXCR4+NK cells were diminished in proportion with RIF. The decrease in subset of CD63highPGRhigh endometrial epithelial cells with high levels of progesterone receptor, autophagy and exosomes should contribute to the decrease in subset of NK cells. Additionally, we characterized aberrant molecular and cellular characteristics and endometrial cell-cell communication disorders in RIF patients. Conclusion: Our study provides deeper insights into endometrial microenvironment disorder of RIF that are potentially applicable to improving the etiological diagnosis and therapeutics of unexplained RIF.

Keywords: NK cell; endometrial fibroblast-like cell; endometrial receptivity; epithelial cell; recurrent implantation failure.


Conflict of interest statement

Competing Interests: The authors have declared that no competing interest exists.

Figures

Figure 1
Figure 1
Atlas of the endometrium of healthy controls and RIF patients. (A) Flowchart overview of the scRNA-seq and methodology (left), and t-SNE plots on 60222 single cells in the endometrium of three control and six RIF patients (right), indicating 22 clusters and four major cell types (FIB, EC, IC and VASC). (B) Violin plots of representative marker genes for 22 clusters and 4 cell subsets. The X-axis is a log scale normalized read count. (C) Proportion and total cell number of FIB, VASC, IC and the subpopulation of IC (NK, T, Mφ/Mo, B, Mast, ILC and T/NKp cells) in the endometrium of different samples. FIB: fibroblast-like cells; EC: epithelial cells; IC: immune cells; VASC: vascular cells.
Figure 2
Figure 2
Identification of population of human endometrial FIB at the WOI. (A) Cell cluster of FIB (52825 cells) was re-clustered into seven sub-clusters visualized by t-SNE. (B) Heat map showing relative expression (z-score) of selected genes for four main sub-clusters of endometrial FIB. (C) Bubble diagram showing average expression of endometrial receptivity-related genes (such as HOXA10, IGFBP2, LIF, and PRL) for four FIBs (FIBp, FIB1, FIB2 and FIB3) (up). Manhattan plot indicating the Gene Ontology (GO) enrichment of endometrial receptivity-related genes, and the most important GO terms (the details of GO terms are showed in Figure S6) of endometrial receptivity-related genes (down). One dot represented one GO term, and the size of the dots represented the number of genes that were enriched. The Manhattan plot was drawn by an online tool - g:Profile (https://biit.cs.ut.ee/gprofiler/). (D) Proportions of the four FIBs between the Ctrl and RIF groups. (E) Potential interactions between four FIBs and other subtypes of endometrium cells based on receptor-ligand pairs analysis. Width of the line represented the number of receptor-ligand pairs. (F) Heat map showing selected significant ligand-receptor interactions (P value < 0.05, permutation test, see Methods) between four FIBs (left) and endometrium cells (right). Assays were carried out at the mRNA level, but are extrapolated as protein interactions.
Figure 3
Figure 3
Subsets of FIB with poor endometrial receptivity and immune regulation are observed in RIF patients. (A, B) Monocle pseudotime trajectory showing the progression of FIBp, FIB1, FIB2, and FIB3. (C) t-SNE with RNA velocity vectors for FIBp, FIB1, FIB2 and FIB3. (D) Expression of the genes in a branch-dependent manner. Each row indicated the standardized kinetic curves of a gene. From the left to the right of the heatmap, the kinetic curve progresses from the FIBp along the trajectory to the FIB3 (left). Based on their characteristic expression dynamics, 21480 genes were categorized into 4 clusters, and the enriched GO terms for each gene cluster were identified (middle). Expression patterns of representative genes along the reprogramming trajectory (right). (E) Immunofluorescence staining of MKi67, RPL10, MMP14, and CCNL2 in in three different menstrual cycles of endometrial stroma from controls (n = 6 for each group). Scale bar, 20 µm (times of endometrial biopsy are showed in Table S4). (F) Volcano plot showing differentially expressed genes of the four FIBs between the Ctrl and RIF groups. Red color indicates genes that are upregulated and blue color indicates downregulated genes in the RIF groups compared with the Ctrl groups. (G) Rose diagrams indicating the proportion of upregulated (red) and downregulated (green) genes in four FIBs from the RIF groups compared with the Ctrl groups. List of genes screened is shown in Tables S2.
Figure 4
Figure 4
Subset of endometrial epithelial cell, EC1, is diminished in the endometrium of RIF patients. (A) t-SNE map of four sub-clusters (Ciliated-EC, EC1, EC2, and EC3) of EC. (B) Significant gene markers (listed in the Supplemental Information) for each cluster in the EC were selected to perform GO analysis. The GO terms with P < 0.05 are shown. Gene number of each GO term is listed on the left. P value is shown as -log 10 (P value). (C) Bubble diagram showing average expression of selected genes (progesterone receptor signaling pathway, autophagy and exosomes-related genes) for the four sub-clusters of EC. (D) The PPI network of selected genes in (C). Different edges color presented different interactions.
Figure 5
Figure 5
A close interactive dialogue between endometrial stromal cells and epithelial cells. (A) Potential interactions between four FIB (FIBp, FIB1, FIB2, and FIB3) and four EC (Ciliated-EC, EC1, EC2 and EC3) subpopulations based on receptor-ligand pairs. The width of the line represented the number of receptor-ligand pairs. (B) Protein-protein interaction (PPI) network of IGF, endometrial receptivity-related genes and autophagy-related genes. Different edges color presented different interactions. (C) Protein-protein interaction network of IGF and endometrial receptivity-related genes and exosome-related gene. Different edges color presented different interactions. (D) Proportion of the four sub-clusters of EC in the Ctrl and RIF groups. (E) Expressions of CD63 and PGR in endometrial stroma from controls and RIF patients at the WOI time were analyzed by immunofluorescence staining (n = 6 for each group). Data were presented as mean ± SEM and analyzed by t test (***, p < 0.001). Scale bar, 20 µm (times of endometrial biopsy were showed in Table S5). (F) Volcano plot showing differentially expressed genes of ECs between the Ctrl and RIF groups. Red color indicates genes that are upregulated and blue color indicates downregulated genes in the RIF groups when compared with the Ctrl groups.
Figure 6
Figure 6
Endometrial CD49a+CXCR4+ NK2 cells are decreased in the RIF patients. (A) t-SNE map of four sub-clusters of endometrial NK cells. (B) Expression of representative marker genes in Violin plots. (C) Changes of NK1, NK2, NK3, and NK4 cellular proportion in total endometrial CD45+CD3-CD56+ NK cells across the menstrual cycles were analyzed using FCM analysis (-/+: < 10%, +: < 20%, ++: < 50%, +++: ≥ 50%). (D) Expression of representative marker genes in the Violin plots. (E) Heat map of CellPhoneDB showing selected significant ligand-receptor interactions (P value < 0.05, permutation test, see Methods) between all subtypes of endometrium cells (left) and all immunocytes (right). Assays were carried out at the mRNA level, but are extrapolated as protein interactions. (F) Diagram of the main chemokine and receptors expressed on the FIBs and immunocytes that are involved in cell migration and recruitment. (G) Proportions of the four NK cellular subtypes in the endometrial stroma in the controls and RIF patients (n = 6, for each group) were analyzed by flow cytometry. Cells were initially gated within CD45+CD3-CD56+ gate, and then CXCR4 and CD49a gating. Data were presented as mean ± SEM and analyzed by t test (NS, no significance, *, p < 0.05, **, p < 0.01, ***, p < 0.001).
Figure 7
Figure 7
Restricted secretory abilities of EC1 and FIB1 contribute to the decrease of NK2 cells of RIF patients. (A) Flowchart overview of the experiment strategy of isolated endometrial NK cells and hEECs (left) in co-culture model (left). The hEECs were pre-treated with 0.1% DMSO (n = 20) or 1 µM GW4869 (n = 18) for 24 h, and then co-cultured with isolated endometrial NK cells for another 24 h, in vitro. The proportion of four sub-clusters of NK cells were analyzed by flow cytometry (right). Cells were initially gated within CD56+, and then CXCR4 and CD49a gating. Data were presented as mean ± SEM and analyzed by the t test (NS, no significance, ***, p < 0.001). (B) Overview of selected ligand-receptor interactions; P values indicated by circle size, scale on right. The means of the average expression level of interacting molecule 1 in cluster 1 and interacting molecule 2 in cluster 2 were indicated by color. (C) Protein-protein interaction network of exosome-related genes, APOD/APOE, CXCL12 and IL15. (D) Primary ESCs were treated with the vehicle or 10 μM PA for 48h, in vitro. The hEECs were treated with the vehicle or 10 µM PA for 48 h, or 0.1% DMSO or 1 µM GW4869 for 24 h, in vitro. The mRNA expression levels of these genes in ESCs and hEECs were then measured by qRT-PCR (n = 9). Data were presented as mean ± SEM and analyzed by t test (***, p < 0.001). (E) Schematic cell interactions in the endometrium. Cell interaction of endometrial non-immune cells (FIB and EC, ligands) and immune cells (NK, Mo/Mφ, receptors). The pathway and function of cell interactions were mainly involved in cell adhesion, cell migration and immunomodulation.
Figure 8
Figure 8
Cell communication networks of FIB, EC and immune cells contribute to widespread decidualization features at the WOI. (A) Overview of selected ligand-receptor interactions; P values indicated by circle size, and scale on right. The means of the average expression level of interacting molecule 1 in cluster 1 and interacting molecule 2 in cluster 2 were indicated by color. (B) Circos plot of interaction network for endometrial immune cells (left). The ribbons connect each ligand to the assigned receptors. The color of a ribbon is consistent with the color at the receptor side to ligand side. And ligand and receptor genes involved in each cluster were selected to perform pathway analysis (right). Pathway with P < 0.05 are shown. Gene number of each pathway is listed on the left. P value is shown as -log 10 (P value). (C) Cell interaction of immune cells (NK, Mo/Mφ, ligands), endometrial non-immune cells (FIB, EC and VASCs, receptors). Pathway and function of cell interactions were mainly involved in cell adhesion, cell growth and differentiation, tissue modeling, inflammatory response and angiogenesis.

Similar articles

Cited by

References

    1. Diedrich K, Fauser BC, Devroey P, Griesinger G, Evian Annual Reproduction Workshop G. The role of the endometrium and embryo in human implantation. Hum Reprod Update. 2007;13:365–77. - PubMed
    1. Coughlan C, Ledger W, Wang Q, Liu F, Demirol A, Gurgan T. et al. Recurrent implantation failure: definition and management. Reprod Biomed Online. 2014;28:14–38. - PubMed
    1. Wu F, Chen X, Liu Y, Liang B, Xu H, Li TC. et al. Decreased MUC1 in endometrium is an independent receptivity marker in recurrent implantation failure during implantation window. Reprod Biol Endocrinol. 2018;16:60. - PMC - PubMed
    1. Moustafa S, Young SL. Diagnostic and therapeutic options in recurrent implantation failure. F1000Res. 2020. 9. - PMC - PubMed
    1. Wang W, Vilella F, Alama P, Moreno I, Mignardi M, Isakova A. et al. Single-cell transcriptomic atlas of the human endometrium during the menstrual cycle. Nat Med. 2020;26:1644–53. - PubMed

Publication types