. 2022 Sep 21:2022:7248572.
doi: 10.1155/2022/7248572. eCollection 2022.

Identification of a Metabolic Reprogramming-Associated Risk Model Related to Prognosis, Immune Microenvironment, and Immunotherapy of Stomach Adenocarcinoma

Affiliations

Identification of a Metabolic Reprogramming-Associated Risk Model Related to Prognosis, Immune Microenvironment, and Immunotherapy of Stomach Adenocarcinoma

Yan Zhao et al. J Oncol. .

Abstract

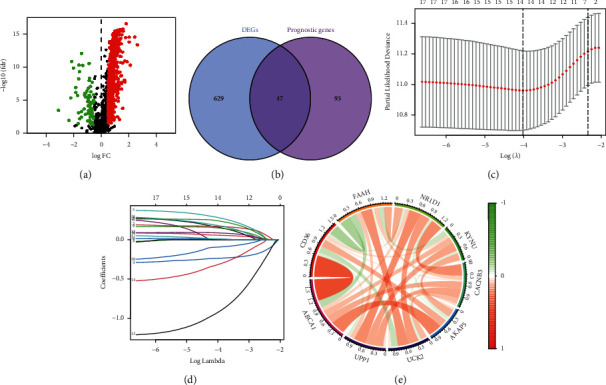
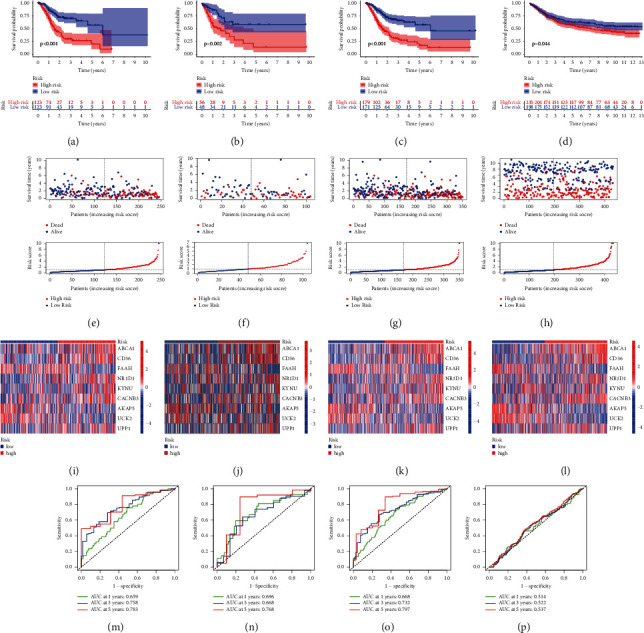
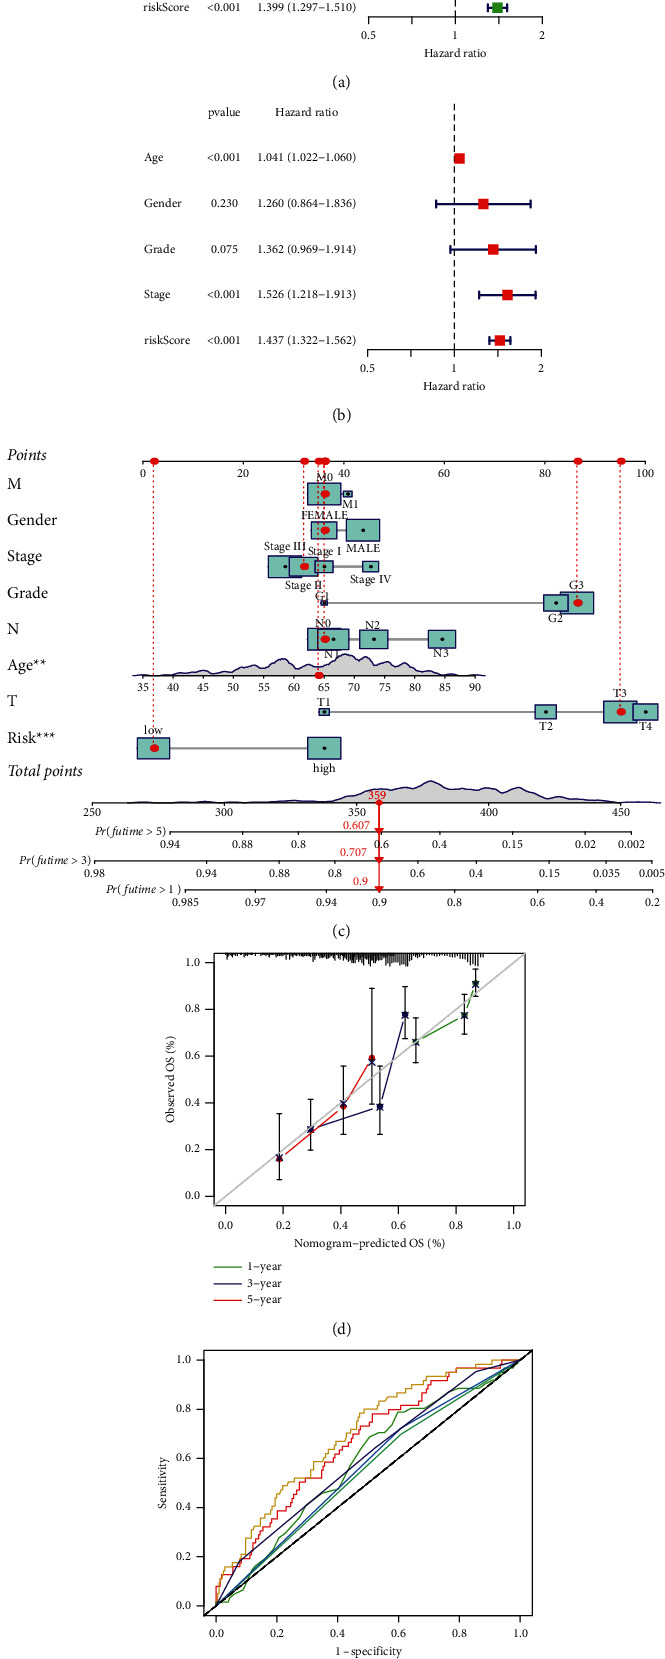
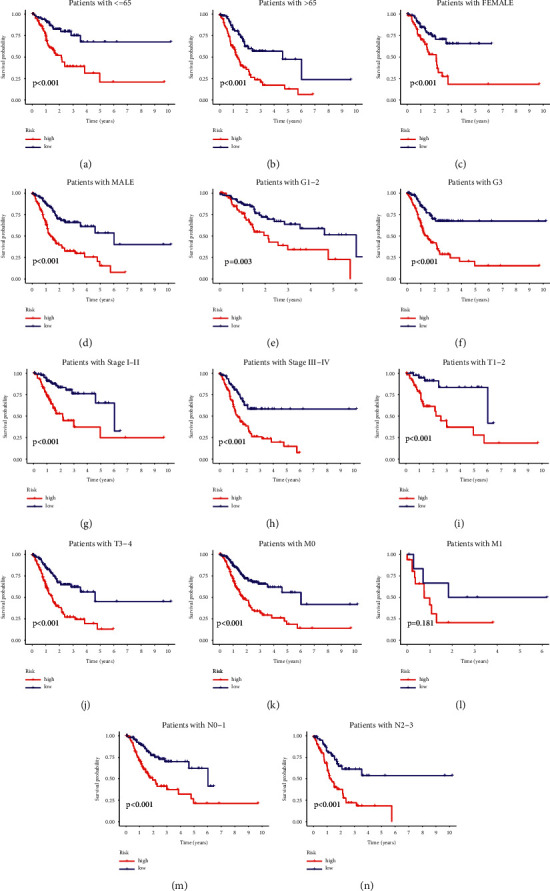
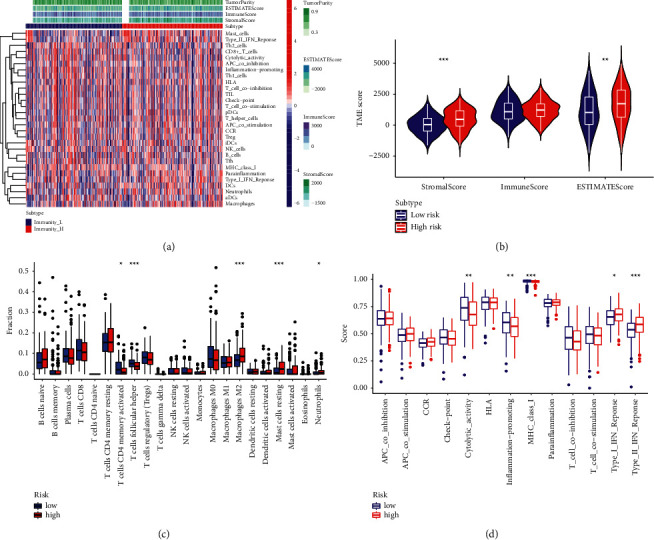
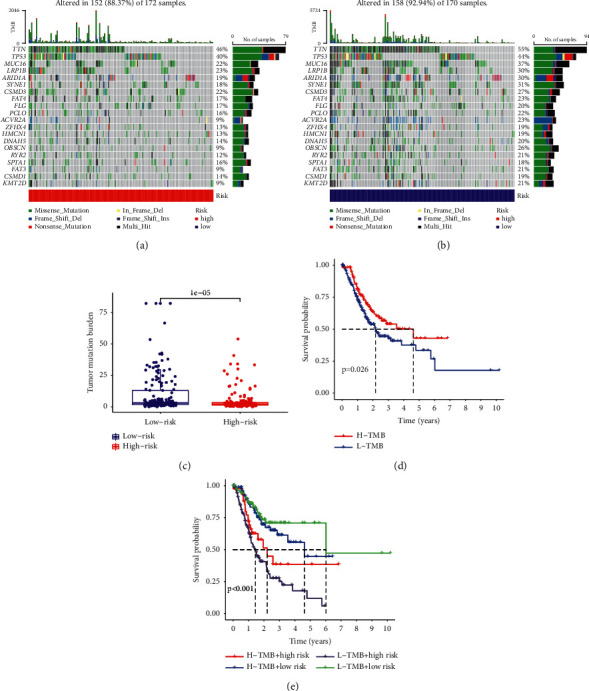
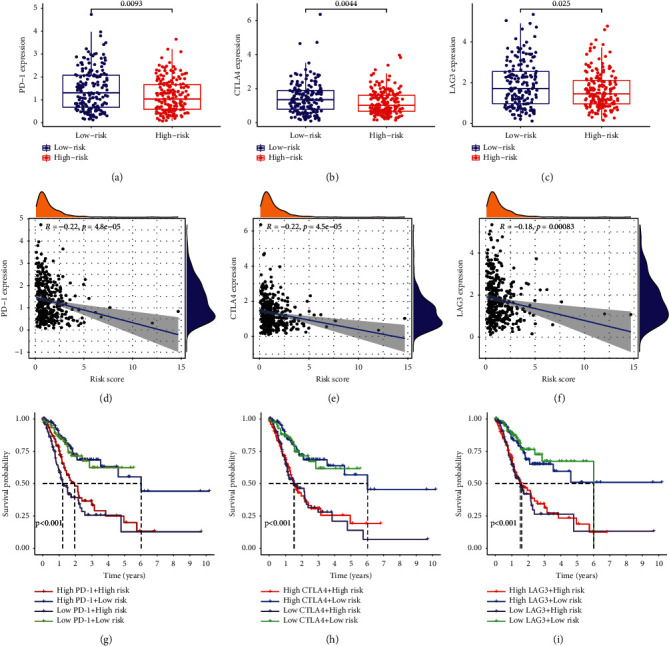
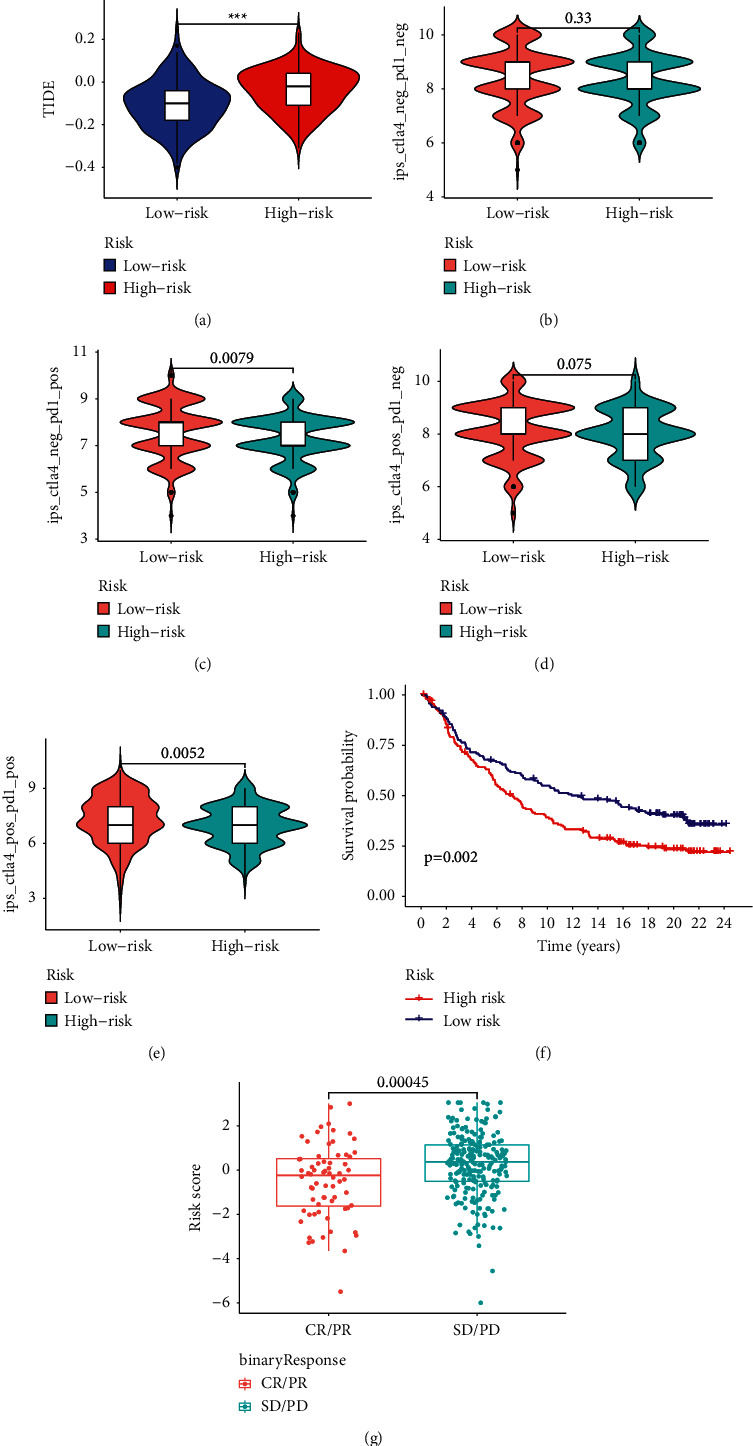
Stomach adenocarcinoma (STAD) is one of the most common malignant digestive tumors. Metabolic reprogramming is an essential feature of tumorigenesis. The roles of metabolic reprogramming in STAD patients were investigated to explore the tumor immune microenvironment (TME) and potential therapeutic strategies. STAD samples' transcriptomic and clinical data were collected from The Cancer Genome Atlas (TCGA) set and the GSE84437 set. The signature based on the metabolism-related genes (MRGs) was built using the Cox regression model to predict prognosis in STAD. Notably, this MRG-based signature (MRGS) accurately predicted STAD patients' clinical survival in multiple datasets and could serve as an indicator independently. STAD patients with high scores on the MRGS were eligible for generating a type I/II interferon (IFN) response, according to a complete examination of the link between the MRGS and TME. Tumor Immune Dysfunction and Exclusion (TIDE) and immunophenoscore (IPS) analyses revealed that STAD patients with different MRGS scores had different reactions to immunotherapy. Consequently, assessing the pattern of these MRGs increases the understanding of TME features in STAD, hence directing the development of successful immunotherapy regimens.


Conflict of interest statement

The authors declare that the research was conducted in the absence of any commercial or financial relationships that could be construed as potential conflicts of interest.

Figures

Figure 1
Figure 1
Establishment of MRGS. (a) Volcano plot regarding MRGS that differentially expressed between STAD samples and normal samples. (b) The intersections of the differentially expressed MRGS and the MRGS with prognostic value for STAD. (c) LASSO Cox regression analysis for STAD samples based on the MRGS in the intersections. (d) Coefficient profiles from the LASSO Cox analysis. (e) Correlation network of the nine candidates MRGS.
Figure 2
Figure 2
Evaluation of MRGS in predicting the survival of STAD samples from different cohorts. Distribution of KM survival (a-d), risk scores and survival status (e-h), hub MRGs' expression levels in different STAD groups (i-l), and time-dependent ROC analyses (m-p) on the TCGA training set (a, e, I, and m), TCGA testing set (b, f, j, and n), entire TCGA cohort (c, g, k, and o), and GSE84437 cohort (d, h, l, and p).
Figure 3
Figure 3
The dependence of the MRGS for prognostic prediction in STAD. (a) Results of the univariate Cox analyses of the MRGS and multiple clinical features in patients from the entire TCGA-STAD set. (b) Results of the further multivariate Cox analyses. (c) Nomogram predicting the OS in the entire TCGA cohort. (d) Calibration curves of nomogram on the consistency. (e) ROC analysis of the constructed clinical nomogram by comparing it with other chosen clinical variables.
Figure 4
Figure 4
Stratified analysis based on the built model and clinical stratifications. (a-m) Longer survival time was obviously observed in STAD patients with low scores in most clinical stratifications, including patients' age (a and b), patients' gender (c and d), tumor grade (e and f), tumor stage (g and h), tumor T stage (I and j), tumor M stage (k and l) and tumor N stage (m and n).
Figure 5
Figure 5
Correlation between MRGS and immune cell infiltration, TME. (a) Correlation between the MRGS and immune cell infiltration. (b) Results of ssGSEA analysis on the immune-related functions between two risk groups. (c) The landscape of the immune characteristics and TME. (d) Correlations between MRGS score and TME score.
Figure 6
Figure 6
Estimation of TME and TMB in the entire TCGA-STAD set. (a) and (b) Genes with high mutation frequencies in different risk STAD groups. (c) Difference of TMB between two STAD groups. (d) Kaplan–Meier analysis based on the TMB. (e) Kaplan–Meier analysis for four groups that were stratified by combining the constructed MRGS and the TMB.
Figure 7
Figure 7
Correlation of checkpoint genes and the MRGS and their impact on clinical outcome. (a-c) Comparison of the PD-1, CTLA-4, or LAG3 expression levels between groups with different risks. (d-f) Correlation between the MRGS score and checkpoint gene (PD-1, CTLA-4, or LAG3) expression level. (g-i) Kaplan–Meier analyses the clinical OS in the four groups grouped by the MRGS and the level of PD-1, CTLA-4, or LAG3.
Figure 8
Figure 8
Predictive potential of the MRGS in immunotherapeutic benefits. (a) The TIDE scores between STAD patients with different MRGS scores. (b-e) The association between the MRGS score and IPS. (f) Kaplan–Meier analysis based on the IMvigor210 cohort. (g) The distribution of MRGS in the binary response.
Figure 9
Figure 9
The relationship between MRGs' expression and drug sensitivity.

Similar articles

Cited by

References

    1. Bray F., Ferlay J., Soerjomataram I., Siegel R. L., Torre L. A., Jemal A. Global cancer statistics 2018: GLOBOCAN estimates of incidence and mortality worldwide for 36 cancers in 185 countries. CA: A Cancer Journal for Clinicians . 2018;68(6):394–424. doi: 10.3322/caac.21492. - DOI - PubMed
    1. Katai H., Ishikawa T., Akazawa K., et al. Five-year survival analysis of surgically resected gastric cancer cases in Japan: a retrospective analysis of more than 100, 000 patients from the nationwide registry of the Japanese Gastric Cancer Association (2001-2007) Gastric Cancer . 2018;21(1):144–154. doi: 10.1007/s10120-017-0716-7. - DOI - PubMed
    1. Wagner A. D., Syn N. L., Moehler M., et al. Chemotherapy for advanced gastric cancer. Cochrane Database of Systematic Reviews . 2017;8 doi: 10.1002/14651858.CD004064.pub4.CD004064 - DOI - PMC - PubMed
    1. Yamamoto M., Inohara H., Nakagawa T. Targeting metabolic pathways for head and neck cancers therapeutics. Cancer and Metastasis Reviews . 2017;36(3):503–514. doi: 10.1007/s10555-017-9691-z. - DOI - PubMed
    1. Li J., Bolyard C., Xin G., Li Z. Targeting metabolic pathways of myeloid cells improves cancer immunotherapy. Frontiers in Cell and Developmental Biology . 2021;9 doi: 10.3389/fcell.2021.747863.747863 - DOI - PMC - PubMed

LinkOut - more resources