. 2022 Sep 21:21:547-565.
doi: 10.1016/j.bioactmat.2022.09.011. eCollection 2023 Mar.

A novel approach for the prevention of ionizing radiation-induced bone loss using a designer multifunctional cerium oxide nanozyme

Affiliations

A novel approach for the prevention of ionizing radiation-induced bone loss using a designer multifunctional cerium oxide nanozyme

Fei Wei et al. Bioact Mater. .

Abstract

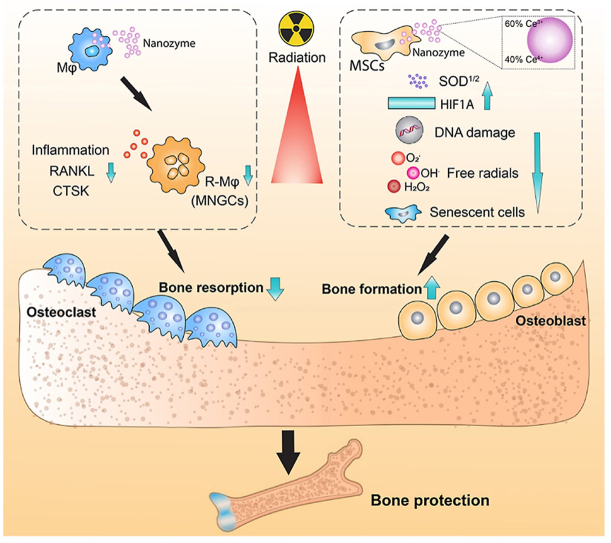
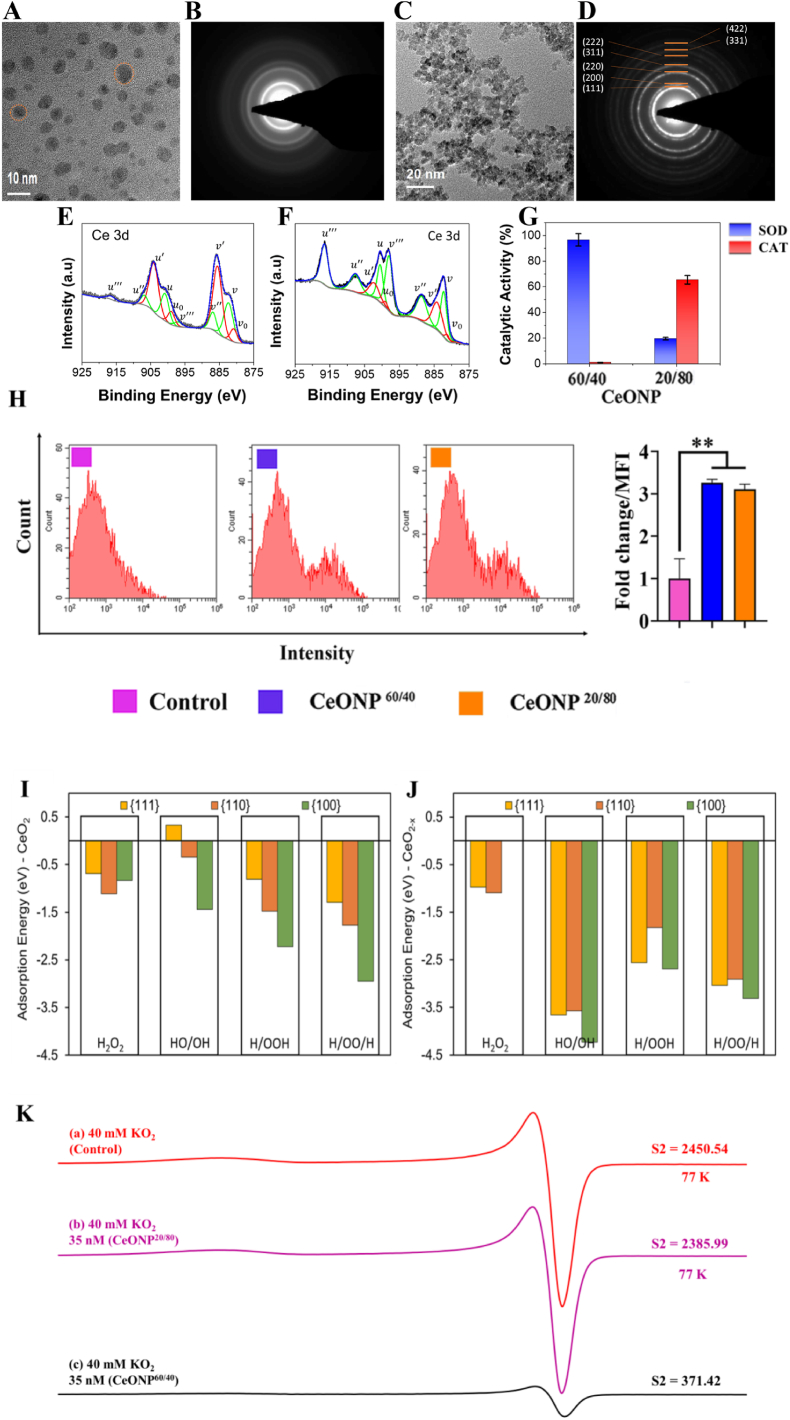
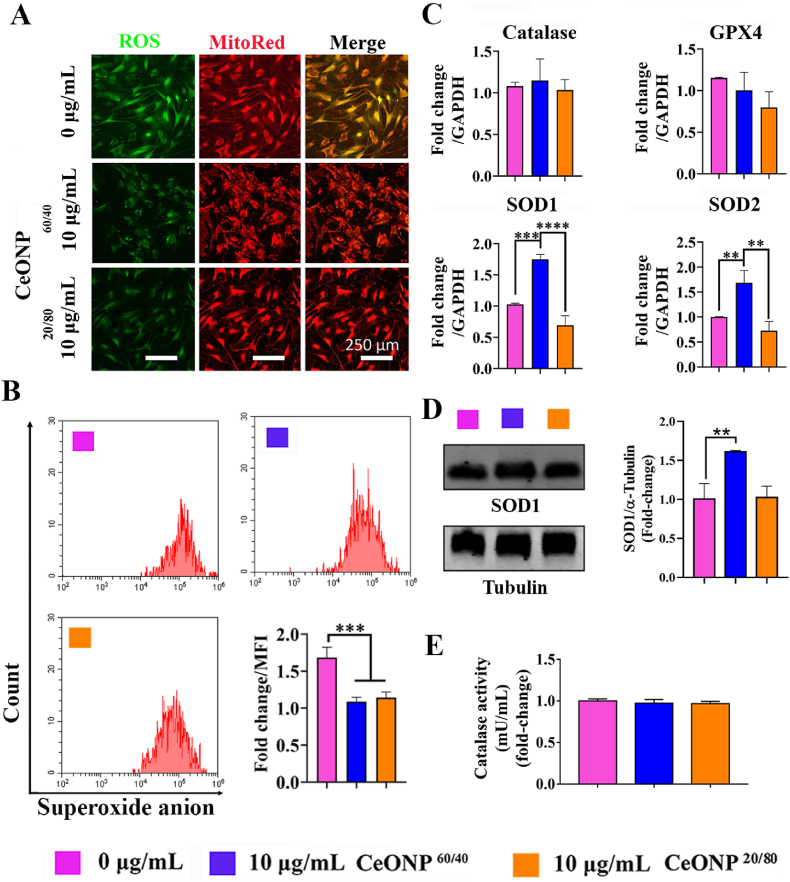
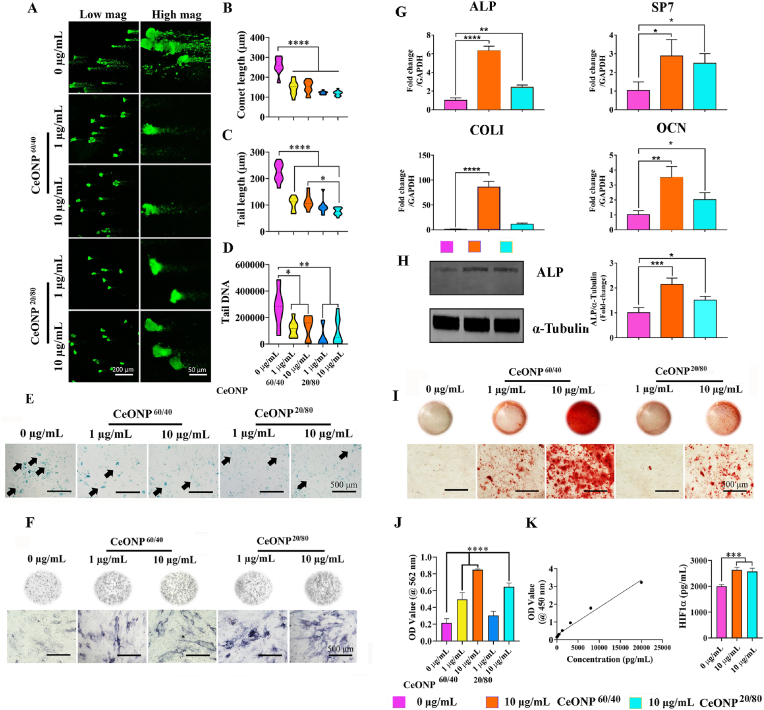
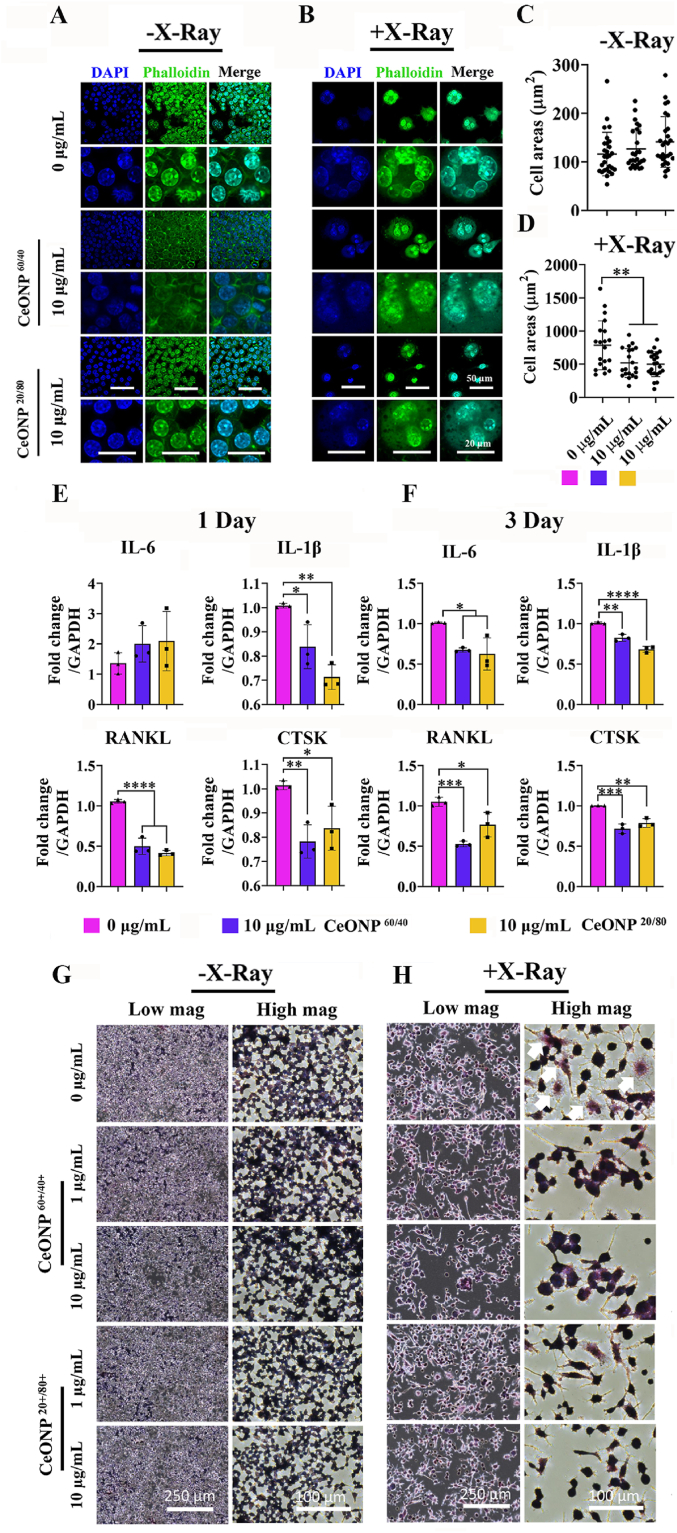
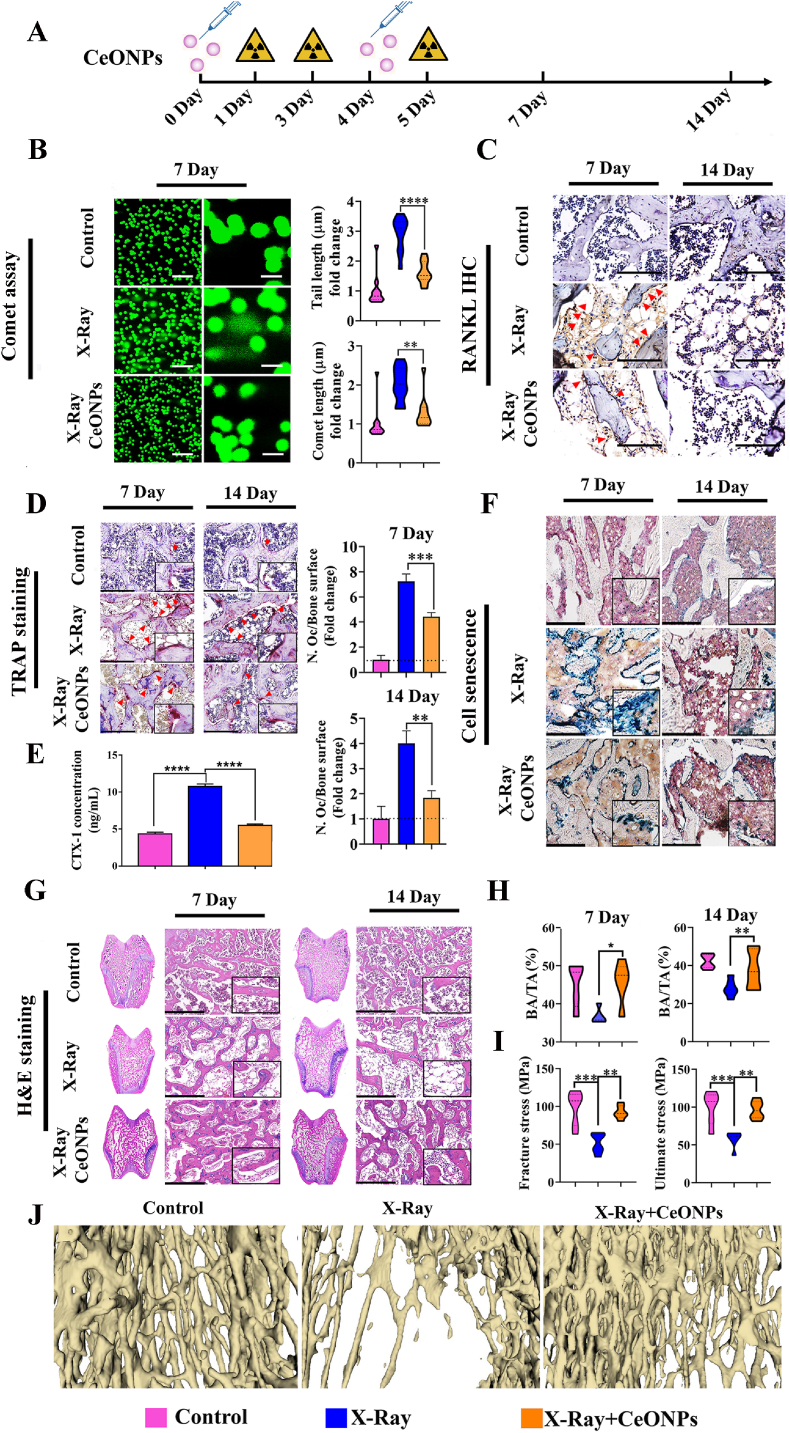
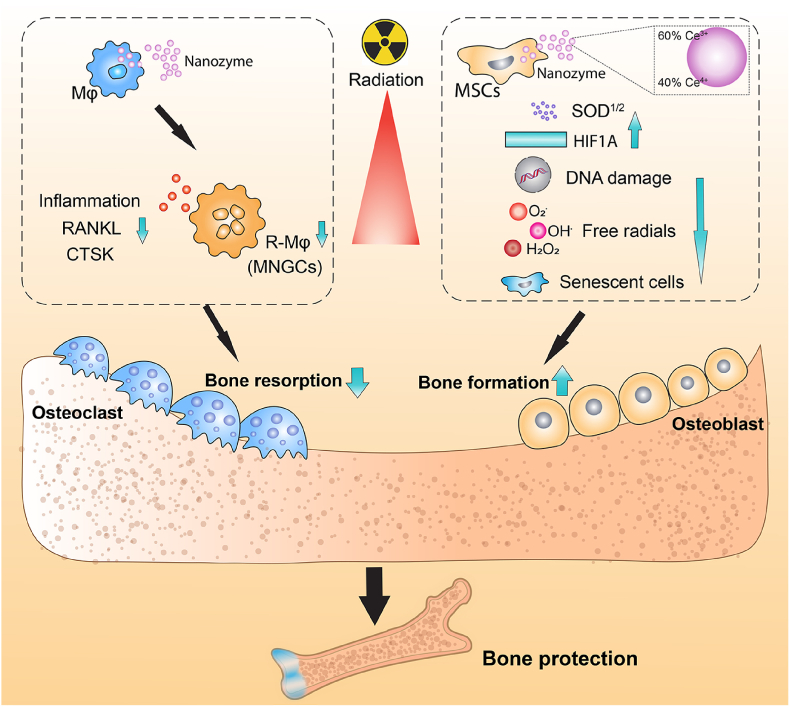
The disability, mortality and costs due to ionizing radiation (IR)-induced osteoporotic bone fractures are substantial and no effective therapy exists. Ionizing radiation increases cellular oxidative damage, causing an imbalance in bone turnover that is primarily driven via heightened activity of the bone-resorbing osteoclast. We demonstrate that rats exposed to sublethal levels of IR develop fragile, osteoporotic bone. At reactive surface sites, cerium ions have the ability to easily undergo redox cycling: drastically adjusting their electronic configurations and versatile catalytic activities. These properties make cerium oxide nanomaterials fascinating. We show that an engineered artificial nanozyme composed of cerium oxide, and designed to possess a higher fraction of trivalent (Ce3+) surface sites, mitigates the IR-induced loss in bone area, bone architecture, and strength. These investigations also demonstrate that our nanozyme furnishes several mechanistic avenues of protection and selectively targets highly damaging reactive oxygen species, protecting the rats against IR-induced DNA damage, cellular senescence, and elevated osteoclastic activity in vitro and in vivo. Further, we reveal that our nanozyme is a previously unreported key regulator of osteoclast formation derived from macrophages while also directly targeting bone progenitor cells, favoring new bone formation despite its exposure to harmful levels of IR in vitro. These findings open a new approach for the specific prevention of IR-induced bone loss using synthesis-mediated designer multifunctional nanomaterials.

Keywords: ALP, Alkaline phosphatase; BMSC, Bone marrow derived mesenchymal stem cells; Bone resorption; Bone strength; CAT, Catalase; COLI, Collagen type I; CTSK, Cathepsin K; CTX-1, Cross-linked C-telopeptide of type I collagen; CeONPs, Cerium oxide nanoparticles; Cerium oxide; DFT, Density functional theory; DNA, Deoxyribonucleic acid; EPR, Electron paramagnetic resonance; FDA, Food and Drug Administration; GPX, Glutathione peroxidase; Gy, Gray; HIF1α, Hypoxia-inducible factor 1 alpha; IL-1β, Interleukin 1 beta; IL-6, Interleukin 6; IR, Ionizing radiation; Ionizing radiation; MNGC, Multinucleated giant cell; Nanozyme; OCN, Osteocalcin; Osteoporosis; RANKL, Receptor activator of nuclear factor kappa-Β ligand; ROS, Reactive oxygen species; SAED, Selected area electron diffraction; SOD, Superoxide dismutase; TRAP, Tartrate-resistant acid phosphatase; XPS, X-ray photoelectron spectroscopy.


Conflict of interest statement

The authors declare that they have no known competing financial interests or personal relationships that could have appeared to influence the work reported in this paper.

Figures

Image 1
Graphical abstract
Fig. 1
Fig. 1
Materials Characterization of CeONP formulations. [A and C] High-resolution transmission electron microscopy (HR-TEM) images of CeONP60/40 (a) and CeONP20/80 (c) demonstrate spherical (truncated octahedral) morphology of particles in each formulation. Particles from CeONP60/40 samples show diameters of 3–5 nm, while those from CeONP20/80 are 5–7 nm [B and D] Selected area electron diffraction (SAED) images confirm particle crystallinity for CeONP60/40 (b) and CeONP20/80 (d) with ring (halo) patterns denoting nanoscale dimensions of primary crystallites and spacing indexed to the cerium oxide crystal structure (observed for both formulations; presented in (d)). [E-F] X-ray photoelectron spectroscopy (XPS) performed over the Ce3d envelope binding energy range allows deconvolution of spin-orbit coupled doublets (3d5/2 and 3d3/2) into multiplet peaks associated with Ce3+ (v0, v’, u0 and u’; red) and Ce4+ (v, v”, v”’, u, u”, and u”’; green) redox states. Integration of redox state-specific fitted peak areas allows quantification of Ce3+/(Ce3++Ce4+) as 20.1% and 61.8% for CeONP20/80 (e) and CeONP40/60 (f), respectively. [G] Superoxide dismutase (SOD; blue) and catalase (CAT; -red) activities for each formulation are presented (g) with CeONP60/40 demonstrating a strong inverse relationship between the tested enzyme-mimetic behavior and CeONP20/80 showing a greater CAT activity over SOD (characteristic of respective formulation Ce3+ fractions). [H] Flow cytometry analysis showing cellular internalization of FITC-labeled CeONPs in hBMSCs at 24 h: **p < 0.01. [I, J]. The energy of adsorption of ROS evaluated using DFT calculations represents the strength of interactions between the material and the adsorbate. Molecular H2O2 and its dissociation products (HO/OH, H/OOH, H/OO/H) interact to a lesser extent with the {111}, {110} and {100} surfaces of stoichiometric CeO2 [I] than with reduced CeO2-x [J]. [K](a) X-band EPR spectrum of O2∸ from a solution of 40 mM KO2 in 1:2:2 water/DMSO/IPA after cooling to 77 K for 45 s after KO2 dissolution. (b) EPR spectrum of a solution formed identically to that described in (a) with 35 nM CeONP20/80. (c) EPR spectrum of a solution formed identically to that described in (a,b) with 35 nM CeONP60/40. All spectra were recorded at 77 K. Double integration results are reported as S2 in arbitrary units. The similar S2s of (a,b) indicate that in the presence of CeONP20/80, little dismutation of O2 occurred in comparison to the drastically reduced S2 in (c) showing significant SOD-mimetic activity from CeONP60/40.
Fig. 2
Fig. 2
CeONP60/40 and CeONP20/80 reduce IR-induced intracellular ROS generation, and increase mitochondrial O2•- scavenging in primary hBMSCs 24h post-irradiation. The CeONP60/40 nanozyme selectively and significantly upregulates SOD1 and SOD2 gene expression. [A] Representative confocal microscope images of intracellular ROS and mitochondrial counter-staining in living hBMSCs. After IR-exposure at a dose of 7 Gy, a 160 kV tube voltage, 4 mA tube current, at a distance of 30 cm between the source and the surface (SC 500 smart controller, KIMTRON, USA), cells were stained with ROS/DCFDA (green), and MitoSpy™ Red CMXRos (red). An IR-induced increase in ROS is observed in the untreated control cell group with less expression identified in both groups following 24h pre-treatment with 10 μg/mL of CeONPs and followed by exposure to 7 Gy of irradiation. [B] Flow cytometry results showing a significant decrease in the fold-change of O2•- levels after 10 μg/mL of CeONP treatment at 24 h. Similar amounts of mitochondrial O2•- scavenging were observed following 10 μg/mL of nanozyme treatment. [C] Expression of antioxidation-related Catalase, GPX, SOD1 and SOD2 genes after 10 μg/mL CeONP treatment and 7 Gy radiation at 24 h and quantified using qRT-PCR. CeONP60/40 selectively and significantly upregulated SOD1 and SOD2 expression when compared with CeONP20/80 and the control, untreated cells. No other significant differences in gene expression were found. Experiments were carried out in triplicate. All values are given as the mean ± SD. **p < 0.01, ***p < 0.001, ****p < 0.0001. [D] Western blot analysis of SOD1. Endogenous α-Tubulin expression was shown as control. **p < 0.01. [E] Catalase activity was measured using an Amplite® Fluorimetric Catalase Assay Kit.
Fig. 3
Fig. 3
CeONP60/40 and CeONP20/80 pre-treatment to primary hBMSCs reduces IR-induced DNA damage and cellular senescence. [A] Representative confocal micrographs showing DNA damage 3 days after irradiation and following analysis using the Comet Assay®. hBMSCs were pre-treated with either 1 μg/mL or 10 μg/mL of CeONPs for 24 h prior to a single X-ray exposure to 7 Gy. A significant reduction in DNA damage is observed following treatment with both nanozymes and at both concentrations when compared with the untreated control hBMSCs. Images were captured using confocal laser scanning microscopy. [B] Quantification of comet length: ****p < 0.0001. [C] Quantification of tail length: *p < 0.05, ****p < 0.0001. [D] Quantification of tail DNA: *p < 0.05, **p < 0.01. All values are given as the mean ± SD. [E] Representative micrographs of SA‐β‐gal staining for senescent cells (green) following exposure to IR and with or without CeONP pre-treatment. Using an inverted phase microscope, results show fewer IR-induced senescent cells following pre-treatment with CeONPs at both 1 μg/mL and 10 μg/mL concentrations, and after 28-days of culture. The CeONPs were replenished in the media following irradiation and experiments were carried out in triplicate. Black arrows indicate senescent cells. [F] Representative micrographs following staining for ALP (dark blue) after 14 days of culture in osteogenic media. Qualitative analysis indicates increased levels of ALP in cells treated with 1 and 10 μg/mL of CeONP60/40 and CeONP20/80 when compared with the untreated control cell group. [G] Expression of osteogenesis-related genes (ALP, SP7, Col I, and OCN) following X-Ray exposure. *p < 0.05, **p < 0.01, ****p < 0.0001. [H] Western blot analysis of ALP. Endogenous α-Tubulin expression was shown as control. *p < 0.05, ***p < 0.001. [I] The deposition of mineral nodules was qualitatively investigated using Alizarin Red Staining. Areas of red indicate regions of mineralization following 28-days of culture. [J] Mineral deposition by cells was quantified following X-Ray exposure in treated and untreated cells. [K] HIF-1α expression. The level of HIF-1α expression was measured in primary hBMSCs 24h following exposure to 7 Gy. Protein levels were determined using a HIF1α human ELISA kit. The CeONPs were replenished in the media following irradiation. Experiments were carried out in triplicate. All values are given as the mean ± SD. *p < 0.05, **p < 0.01, ***p < 0.001, ****p < 0.0001.
Fig. 4
Fig. 4
CeONP60/40 and CeONP20/80 treatment reduces radiation-associated multi-nucleated giant cell formation, pro-inflammatory and pro-osteoclastic gene expression, and osteoclastic activity following X-ray exposure (7 Gy). [A-B] Representative high magnification confocal images of RAW264.7 cells after mock-exposure (A) and X-Ray exposure (B) 3 days post-irradiation and following a dose of 10 μg/mL of CeONPs. [C-D] (results following 1-day exposure are presented in Supplementary Fig. S5). Quantification of cell area (μm2) in each group. [E-F] qRT-PCR showing gene expression of pro-inflammatory, and osteoclast markers at 1-day (E) and 3-day (F) post-irradiation. [G-H] TRAP staining of RAW264.7 after mock-X-ray exposure (G) and X-ray exposure (H) 3 days post-irradiation. RAW264.7 pre-treated with either 0, 1 or 10 μg/mL each nanozyme before mock-exposure (G) or exposure (H) to 7 Gy of irradiation. Cells were fixed and stained to detectTRAP activity. White arrows indicate TRAP-positive cells. Experiments were carried out in triplicate. All values are given as the mean ± SD. *p < 0.05, **p < 0.01, ***p < 0.001, ****p < 0.0001.
Fig. 5
Fig. 5
Analysis of the radioprotective effect of CeONP60/40 (4 mg/kg) following exposure to levels of radiation able to induce bone loss in vivo. [A] Flow chart of the animal experiment. [B] Representative confocal micrographs of DNA damage (Comet Assay®) in bone marrow cells following exposure of the hind limbs to three fractions of 8 Gy (total 24 Gy) on days 1, 3 and 5 (n = 6). Quantification of tail length and comet length. Scale bar denotes 250 μm (left panel) and 50 μm (right panel). [C] Representative images of RANKL immunohistochemical staining (red arrows) in each of the experimental groups. Scale bar denotes 125 μm. [D] Multinucleated and active osteoclasts were identified via TRAP staining. Red arrows indicate TRAP + cells. The number of osteoclasts per unit of bone surface (cells/mm) were quantified by bone histomorphometric analyses (2 images/rat, n = 6). Scale bar denotes 250 μm. [E] Serum levels of CTX-1 in healthy control animals, X-Ray only, and X-Ray + CeONP60/40. ELISA results showed that CTX-1 concentrations were significantly reduced in rats following 4 mg/kg CeONP60/40 treatment. All values are given as the mean ± SD. ****p < 0.0001. [F] Representative micrographs of SA-β-gal staining for senescent cells (stained blue). Scale bar denotes 500 μm. [G] Representative images of H&E staining. Note the extensive osteopenia at 14 days post-irradiation in the X-ray group. Scale bar denotes 500 μm. [H] Quantification of trabecular bone area (BA) to total area (TA). *p < 0.05, **p < 0.01. [I] A 3-point bending test was carried out and each tibia loaded to failure at a displacement rate of 0.02 mm/s. Ultimate stress and fracture stress in the control, X-Ray, and X-Ray + CeONP groups are presented (n = 6). The tibial parameters measured to obtain stress values are presented in Supplementary Table S1. All values are given as the mean ± SD. **p < 0.01, ***p < 0.001. [J] Representative 3D reconstruction images of the proximal tibia via nano-Ct scanning.
Fig. 6
Fig. 6
Schematic diagram highlighting the mechanistic avenues of protection provided by CeONPs against irradiation-induced bone loss. Radiation polarizes macrophages into radiation-associated macrophages (R-Mφ), the formation of multinucleated giant cells (MNGCs), with high expression of osteoclastogenesis- and inflammation-related markers and osteoclast activity. These were all significantly repressed following CeONP treatment in vitro. Further, CeONP treatment neutralized the highly damaging O2•–, H2O2 and OH, decreased DNA damage, increased bone-promoting (and anti-osteoclast) HIF1α protein levels, increased anti-inflammatory, pro-osteogenic and anti-osteoclastogenesis SOD expression, bone mineral deposition and reduced cell senescence thereby liberating osteoblastogenesis in vitro and significantly protecting bone against IR-induced bone fracture in vivo. The nanozyme designed to possess an increased relative fraction of Ce3+ surface sites, provided superior protection in vitro. This may be due to the enhanced SOD-mimetic activity, higher adsorption towards H/OOH and H/OO/H, an increase in interaction with ROS on the predominant {111} surfaces, as well as the selective and significant increase in both cytosol and mitochondrial SOD1 and 2 gene expression.

References

    1. Curi M.M., Cardoso C.L., Lima H. G. de, Kowalski L.P., Martins M.D. Histopathologic and histomorphometric analysis of irradiation injury in bone and the surrounding soft tissues of the jaws. J. Oral Maxillofac. Surg. 2016;74(No. 1):190–199. doi: 10.1016/J.JOMS.2015.07.009. - DOI - PubMed
    1. Kim H.J., Boland P.J., Meredith D.S., Lis E., Zhang Z., Shi W., Yamada Y.J., Goodman K.A. Fractures of the sacrum after chemoradiation for rectal carcinoma: incidence, risk factors, and radiographic evaluation. Int. J. Radiat. Oncol. Biol. Phys. 2012;84(No. 3) doi: 10.1016/j.ijrobp.2012.01.021. - DOI - PubMed
    1. Aoki M., Sato M., Hirose K., Akimoto H., Kawaguchi H., Hatayama Y., Ono S., Takai Y. Radiation-induced rib fracture after stereotactic body radiotherapy with a total dose of 54-56 Gy given in 9-7 fractions for patients with peripheral lung tumor: impact of maximum dose and fraction size. Radiat. Oncol. 2015;10 doi: 10.1186/s13014-015-0406-8. - DOI - PMC - PubMed
    1. Blomlie V., Rofstad E.K., Talle K., Sundfør K., Winderen M., Lien H.H. Incidence of radiation-induced insufficiency fractures of the female pelvis: evaluation with MR imaging. AJR. Am. J. Roentgenol. 1996;167(No. 5) doi: 10.2214/ajr.167.5.8911181. - DOI - PubMed
    1. Oh D., Huh S.J. Insufficiency fracture after radiation therapy. Radiat. Oncol. J. 2014;32(No. 4):213. doi: 10.3857/ROJ.2014.32.4.213. - DOI - PMC - PubMed

LinkOut - more resources