

Identification of Diagnostic Exosomal LncRNA-miRNA-mRNA Biomarkers in Colorectal Cancer Based on the ceRNA Network
- PMID: 36185995
- PMCID: PMC9522904
- DOI: 10.3389/pore.2022.1610493
Identification of Diagnostic Exosomal LncRNA-miRNA-mRNA Biomarkers in Colorectal Cancer Based on the ceRNA Network
Abstract
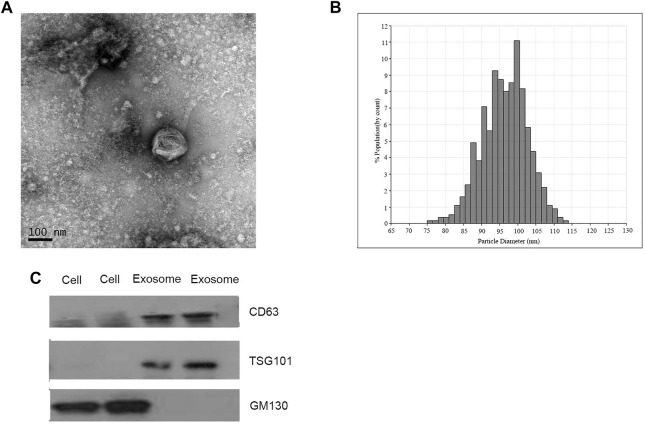
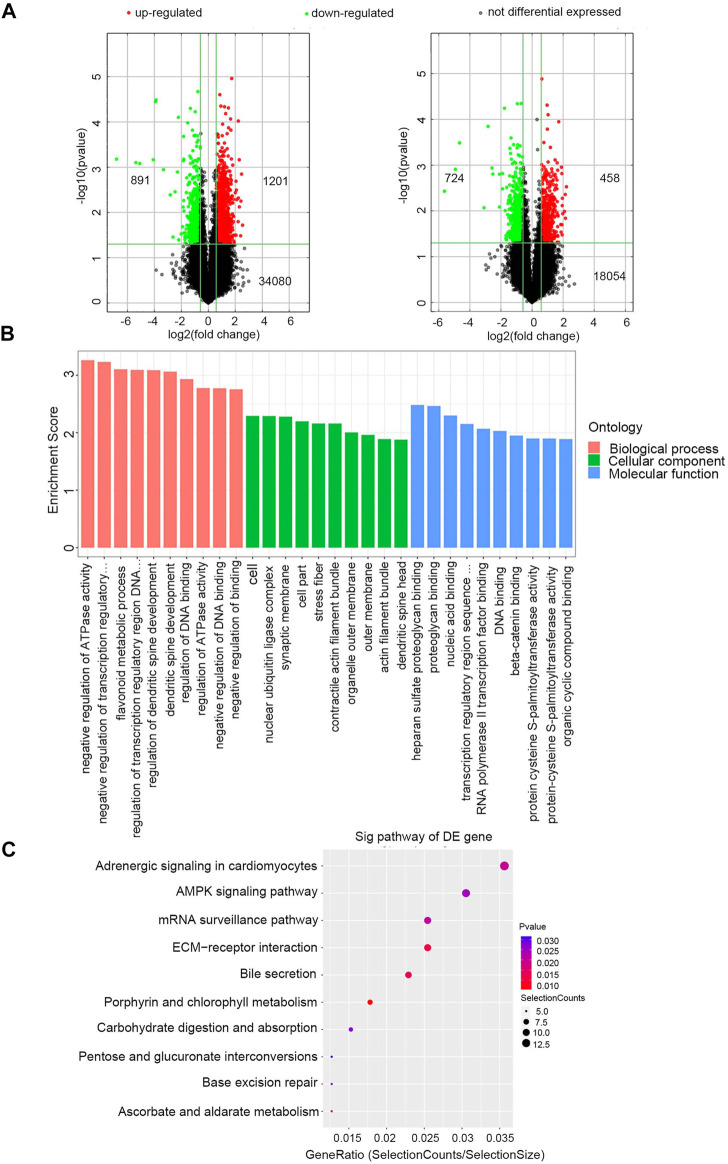
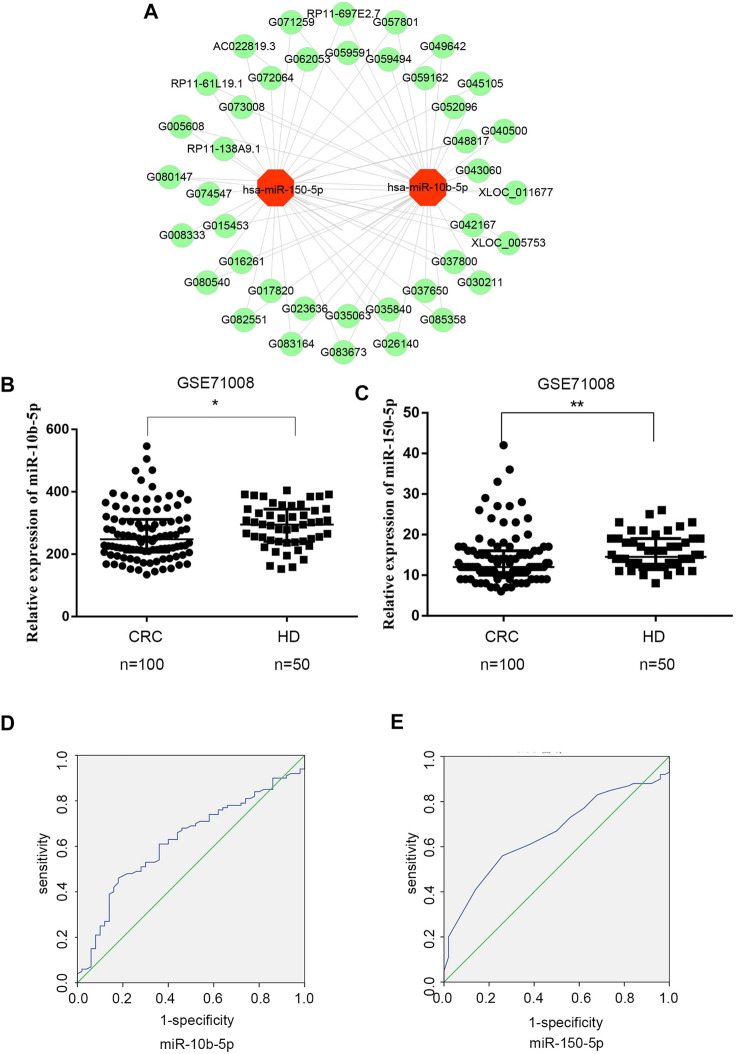
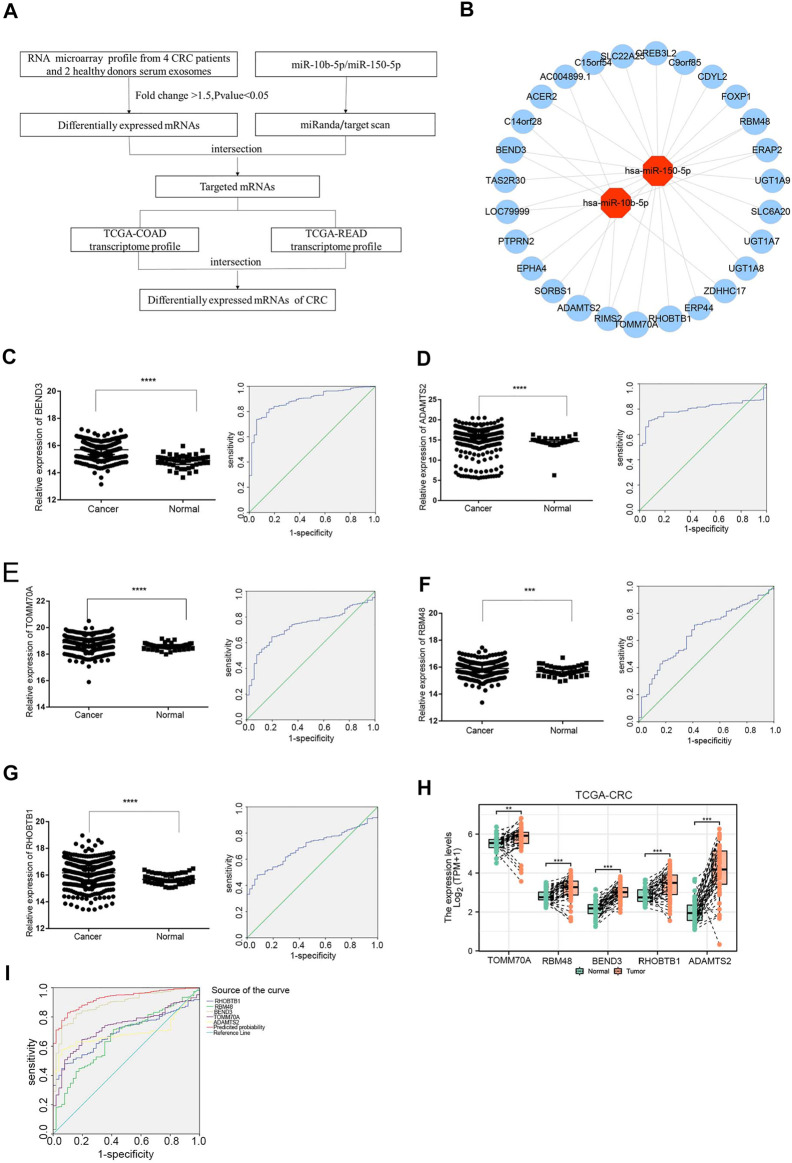
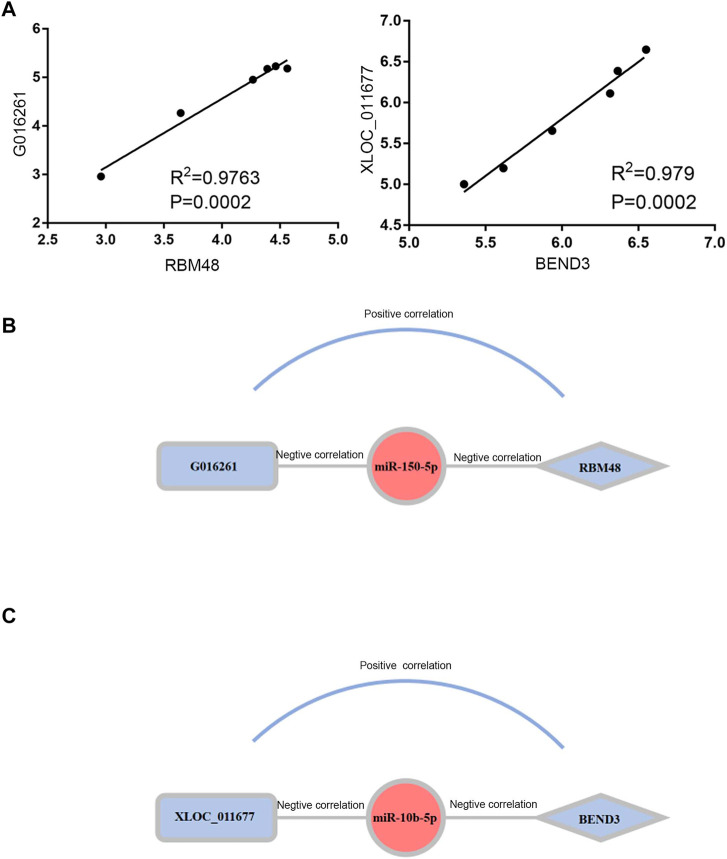
Background: Colorectal cancer (CRC) is currently the fourth most common cancer worldwide. The roles of exosomal competing endogenous RNAs (ceRNAs) in CRC remain unclear. In this study, we constructed an exosomal ceRNA network to identify the core ceRNAs and investigate the diagnostic biomarkers in CRC. Methods and Patients: Serum exosomes were isolated from four CRC patients and two healthy donors by ultracentrifugation, and then subjected to RNA isolation, sequencing and microarray. Kyoto Encyclopedia of Genes and Genomes (KEGG) pathway and Gene Ontology (GO) analyses were performed to identify functional enrichment implications of differentially expressed exosomal mRNAs. TargetScan and miRanda were used for identifying the miRNA-mRNA and miRNA-LncRNA interactions. The predicted lncRNAs and mRNAs were intersected with the differentially expressed genes, for which the screening criterion was fold change >1.5 in the microarray. Differentially expressed exosomal miRNAs were identified in the GSE71008 dataset, and differentially expressed mRNAs (DEmRNAs) were further summarized from The Cancer Genome Atlas (TCGA) database. Results: A total of 1186 exosomal DEmRNAs, 2088 exosomal DElncRNAs and 29 exosomal miRNAs were detected in CRC patients compared to the healthy donors. Functional enrichment analysis suggested that exosomal DEmRNAs might participate in pathways related to carcinogenesis and development of cancer. An exosomal ceRNA regulatory network of CRC was constructed based on 40 lncRNAs, two miRNAs, and five mRNAs. Exosomal miR-150-5p and miR-10b-5p expression levels were increased in healthy donors compared with CRC patients in the GSE71008 dataset, and five DEmRNAs (TOMM70A, RBM48, BEND3, RHOBTB1, and ADAMTS2) were significantly upregulated in TCGA database. Two potential exosomal regulatory axes of lncRNA G016261-miR-150-5p-RBM48 and lncRNA XLOC_011677-miR-10b-5p-BEND3 were identified from the network. Conclusion: The current study revealed potential molecular biological regulation pathways and diagnostic biomarkers through the exosomal ceRNA regulatory network.
Keywords: colorectal cancer; diagnostic biomarker; exosomes; lncRNA; mRNA; miRNA.
Copyright © 2022 Zhao, Song, Song and Xie.
Conflict of interest statement
The authors declare that the research was conducted in the absence of any commercial or financial relationships that could be construed as a potential conflict of interest.
Figures
Similar articles
-
Comprehensive analysis of differentially expressed profiles of lncRNAs, mRNAs, and miRNAs in laryngeal squamous cell carcinoma in order to construct a ceRNA network and identify potential biomarkers.J Cell Biochem. 2019 Oct;120(10):17963-17974. doi: 10.1002/jcb.29063. Epub 2019 May 24. J Cell Biochem. 2019. PMID: 31127661
-
Systematic analysis of lncRNA-miRNA-mRNA competing endogenous RNA network identifies four-lncRNA signature as a prognostic biomarker for breast cancer.J Transl Med. 2018 Sep 27;16(1):264. doi: 10.1186/s12967-018-1640-2. J Transl Med. 2018. PMID: 30261893 Free PMC article.
-
Excavating novel diagnostic and prognostic long non-coding RNAs (lncRNAs) for head and neck squamous cell carcinoma: an integrated bioinformatics analysis of competing endogenous RNAs (ceRNAs) and gene co-expression networks.Bioengineered. 2021 Dec;12(2):12821-12838. doi: 10.1080/21655979.2021.2003925. Bioengineered. 2021. PMID: 34898376 Free PMC article.
-
Reconstruction and Analysis of the Differentially Expressed IncRNA-miRNA-mRNA Network Based on Competitive Endogenous RNA in Hepatocellular Carcinoma.Crit Rev Eukaryot Gene Expr. 2019;29(6):539-549. doi: 10.1615/CritRevEukaryotGeneExpr.2019028740. Crit Rev Eukaryot Gene Expr. 2019. PMID: 32422009 Review.
-
Identification of MFI2-AS1, a Novel Pivotal lncRNA for Prognosis of Stage III/IV Colorectal Cancer.Dig Dis Sci. 2020 Dec;65(12):3538-3550. doi: 10.1007/s10620-020-06064-1. Epub 2020 Jan 20. Dig Dis Sci. 2020. PMID: 31960204 Review.
Cited by
-
Identification and verification of a prognostic signature based on a miRNA-mRNA interaction pattern in colon adenocarcinoma.Front Cell Dev Biol. 2023 Sep 6;11:1161667. doi: 10.3389/fcell.2023.1161667. eCollection 2023. Front Cell Dev Biol. 2023. PMID: 37745305 Free PMC article.
-
Clinical relevance of plasma-derived exosomal long non-coding RNAs (lncRNAs) CCAT1 and XIST in colorectal cancer patients.Mol Biol Res Commun. 2025;14(2):157-166. doi: 10.22099/mbrc.2025.51654.2061. Mol Biol Res Commun. 2025. PMID: 40028475 Free PMC article.
-
Multi-Omics-Based Analysis of the Effect of Longevity Genes on the Immune Relevance of Colorectal Cancer.Biomedicines. 2025 Apr 30;13(5):1085. doi: 10.3390/biomedicines13051085. Biomedicines. 2025. PMID: 40426913 Free PMC article.
-
Long Non-Coding RNAs in Colorectal Cancer: Navigating the Intersections of Immunity, Intercellular Communication, and Therapeutic Potential.Biomedicines. 2023 Aug 28;11(9):2411. doi: 10.3390/biomedicines11092411. Biomedicines. 2023. PMID: 37760852 Free PMC article. Review.
-
Radiogenomics Reveals Correlation between Quantitative Texture Radiomic Features of Biparametric MRI and Hypoxia-Related Gene Expression in Men with Localised Prostate Cancer.J Clin Med. 2023 Mar 30;12(7):2605. doi: 10.3390/jcm12072605. J Clin Med. 2023. PMID: 37048688 Free PMC article.
References
MeSH terms
Substances
LinkOut - more resources
Full Text Sources
Medical
Miscellaneous