. 2022 Sep 14:13:965033.
doi: 10.3389/fgene.2022.965033. eCollection 2022.

Screening and validation of platelet activation-related lncRNAs as potential biomarkers for prognosis and immunotherapy in gastric cancer patients

Affiliations

Screening and validation of platelet activation-related lncRNAs as potential biomarkers for prognosis and immunotherapy in gastric cancer patients

Mingjie Yuan et al. Front Genet. .

Abstract

Background: Platelets (PLT) have a significant effect in promoting cancer progression and hematogenous metastasis. However, the effect of platelet activation-related lncRNAs (PLT-related lncRNAs) in gastric cancer (GC) is still poorly understood. In this study, we screened and validated PLT-related lncRNAs as potential biomarkers for prognosis and immunotherapy in GC patients. Methods: We obtained relevant datasets from the Cancer Genome Atlas (TCGA) and Gene Ontology (GO) Resource Database. Pearson correlation analysis was used to identify PLT-related lncRNAs. By using the univariate, least absolute shrinkage and selection operator (LASSO) Cox regression analyses, we constructed the PLT-related lncRNAs model. Kaplan-Meier survival analysis, univariate, multivariate Cox regression analysis, and nomogram were used to verify the model. The Gene Set Enrichment Analysis (GSEA), drug screening, tumor immune microenvironment analysis, epithelial-mesenchymal transition (EMT), and DNA methylation regulators correlation analysis were performed in the high- and low-risk groups. Patients were regrouped based on the risk model, and candidate compounds and immunotherapeutic responses aimed at GC subgroups were also identified. The expression of seven PLT-related lncRNAs was validated in clinical medical samples using quantitative reverse transcription-polymerase chain reaction (qRT-PCR). Results: In this study, a risk prediction model was established using seven PLT-related lncRNAs -(AL355574.1, LINC01697, AC002401.4, AC129507.1, AL513123.1, LINC01094, and AL356417.2), whose expression were validated in GC patients. Kaplan-Meier survival analysis, the receiver operating characteristic (ROC) curve analysis, univariate, multivariate Cox regression analysis verified the accuracy of the model. We screened multiple targeted drugs for the high-risk patients. Patients in the high-risk group had a poorer prognosis since low infiltration of immune killer cells, activation of immunosuppressive pathways, and poor response to immunotherapy. In addition, we revealed a close relationship between risk scores and EMT and DNA methylation regulators. The nomogram based on risk score suggested a good ability to predict prognosis and high clinical benefits. Conclusion: Our findings provide new insights into how PLT-related lncRNAs biomarkers affect prognosis and immunotherapy. Also, these lncRNAs may become potential biomarkers and therapeutic targets for GC patients.

Keywords: gastric cancer; immunotherapy; lncRNA; platelet; prognosis.


Conflict of interest statement

The authors declare that the research was conducted in the absence of any commercial or financial relationships that could be construed as a potential conflict of interest.

Figures

FIGURE 1
FIGURE 1
The main process of this study.
FIGURE 2
FIGURE 2
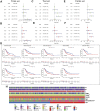
Identification of PLT-related lncRNAs in patients with GC. (A) Univariate Cox regression analysis was used to extract the prognostic lncRNAs. (B) Heatmaps of 18 prognostic lncRNAs expression of patients (***p < 0.001 * *p < 0.01 *p < 0.05). (C) The LASSO coefficient profile of 18 PLT-related lncRNAs. (D) The LASSO coefficient distributions of OS-related lncRNAs and vertical dashed lines were plotted with the values selected for 10x cross-validation. (E) The results of qRT-PCR of PLT-related lncRNAs of 10 pairs GC patients.
FIGURE 3
FIGURE 3
Prognostic value of the risk model of the seven PLT-related lncRNAs in the testing set and training set. (AC) Distribution of PLT-related lncRNAs model presented based on a training set, testing set, and entire set risk scores. (DF) Survival time and survival status of low- and high-risk groups for the training set, testing set and entire set. (GI) Heat-maps of seven LncRNA expressions in the training set, testing set, and entire set. (JL) Kaplan-Meier survival curves of the OS of patients in the training set, testing set, and entire set. (MO) ROC curve of the training set, testing set, and entire set.
FIGURE 4
FIGURE 4
Correlation Analysis between risk score and Clinicopathological Features. (A,B) Univariate- and multivariate-Cox analyses of clinical characteristics and risk score with OS of the training set. (C,D) Univariate- and multivariate-Cox analyses of clinical characteristics and risk score with OS of the testing set. (E,F) Univariate- and multivariate-Cox analyses of clinical characteristics and risk score with OS of the entire set. (G) Kaplan-Meier survival curves of the OS of patients between the risk model and clinical characteristics (age, sex, TNM stage, grade, and survival status). (H) Heat-map of correlation between high- and low-risk and patient clinical characteristics (***p < 0.001 * *p < 0.01 *p < 0.05).
FIGURE 5
FIGURE 5
Pathway Enrichment Analysis. (A) GSEA analysis of the high- and low-risk groups.
FIGURE 6
FIGURE 6
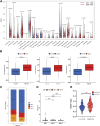
Potential role of the risk model in the TME and immunotherapy. (A) The content of 22 immune cells between the high- and low-risk groups. (B) TME Estimate-Scores, Immunity-Scores, and Stromal-Scores measured between high- and low-risk groups. (C,D) Differences in microsatellite instability (MSI) between patients in the high- and low-risk groups. (E) Differences in immunotherapy scores between high- and low-risk groups.
FIGURE 7
FIGURE 7
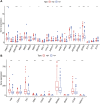
Correlation analysis of PLT-related lncRNAs with methylation and EMT. (A) Differences of 5mC Regulator expression between patients in the high- and low-risk groups. (B) Differences of EMT-related gene expression levels among high- and low-risk groups.
FIGURE 8
FIGURE 8
Construction and Assessment of the Novel Nomogram. (A) The nomogram that predicted 1 -, 2 -, and 3-year survival probabilities. (BD) The calibration curve for 1 -, 2 -, and 3-year OS.

References

    1. Afshar-Kharghan V. (2017). The role of the complement system in cancer. J. Clin. Invest. 127 (3), 780–789. 10.1172/JCI90962 - DOI - PMC - PubMed
    1. Bao Y., Wang L., Shi L., Yun F., Liu X., Chen Y., et al. (2019). Transcriptome profiling revealed multiple genes and ECM-receptor interaction pathways that may be associated with breast cancer. Cell. Mol. Biol. Lett. 24, 38. 10.1186/s11658-019-0162-0 - DOI - PMC - PubMed
    1. Cao M., Li H., Sun D., Chen W. (2020). Cancer burden of major cancers in China: A need for sustainable actions. Cancer Commun. 40 (5), 205–210. 10.1002/cac2.12025 - DOI - PMC - PubMed
    1. Chandra Gupta S., Nandan Tripathi Y. (2017). Potential of long non-coding RNAs in cancer patients: From biomarkers to therapeutic targets. Int. J. Cancer 140 (9), 1955–1967. 10.1002/ijc.30546 - DOI - PubMed
    1. Chen B., Khodadoust M. S., Liu C. L., Newman A. M., Alizadeh A. A. (2018). Profiling tumor infiltrating immune cells with CIBERSORT. Methods Mol. Biol. 1711, 243–259. 10.1007/978-1-4939-7493-1_12 - DOI - PMC - PubMed