. 2022 Sep 26:33:100919.
doi: 10.1016/j.ymgmr.2022.100919. eCollection 2022 Dec.

Dysregulated DNA methylation in the pathogenesis of Fabry disease

Affiliations

Dysregulated DNA methylation in the pathogenesis of Fabry disease

Jin-Song Shen et al. Mol Genet Metab Rep. .

Abstract

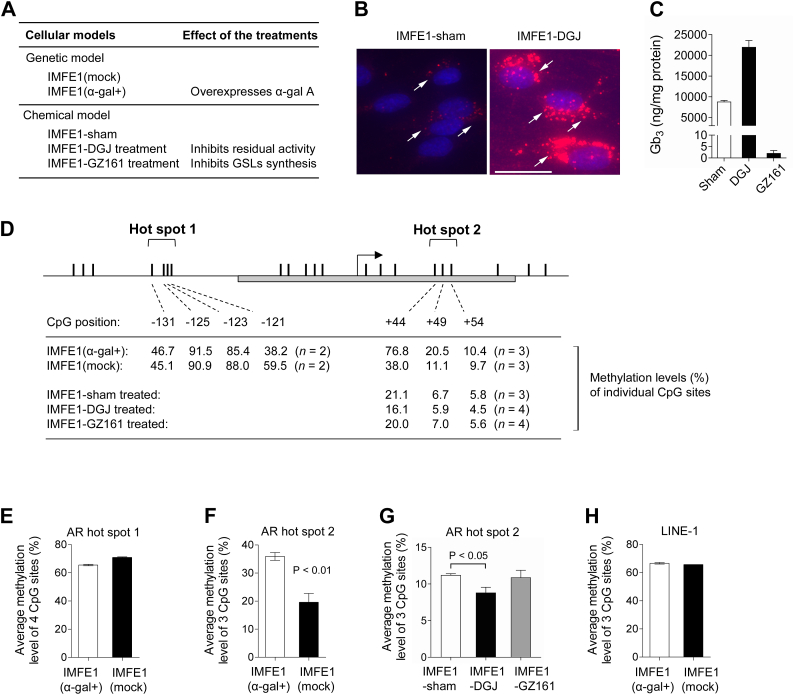
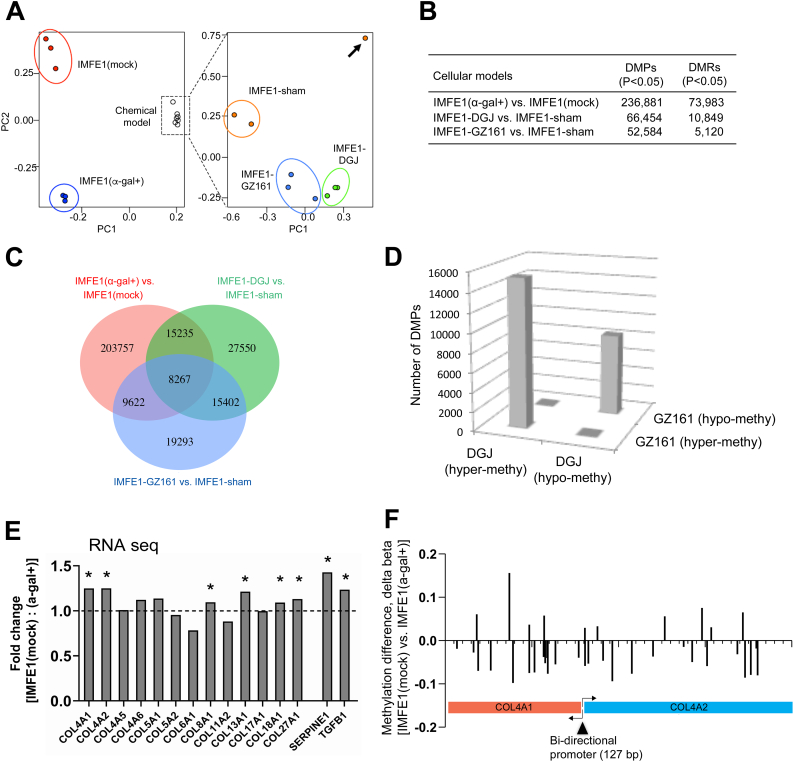
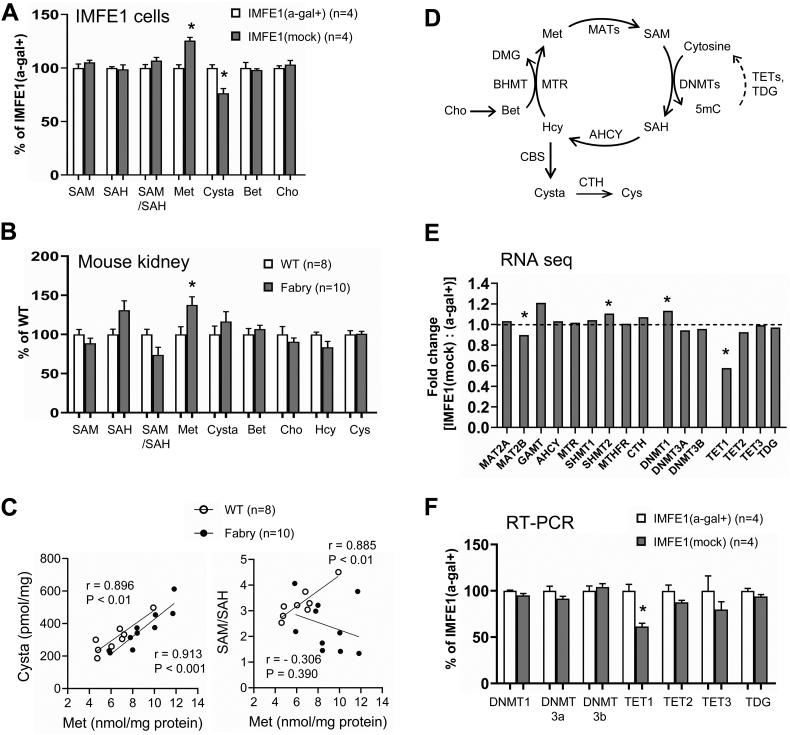
Fabry disease is an X-linked lysosomal storage disorder caused by a deficiency of α-galactosidase A and subsequent accumulation of glycosphingolipids with terminal α-D-galactosyl residues. The molecular process through which this abnormal metabolism of glycosphingolipids causes multisystem dysfunction in Fabry disease is not fully understood. We sought to determine whether dysregulated DNA methylation plays a role in the development of this disease. In the present study, using isogenic cellular models derived from Fabry patient endothelial cells, we tested whether manipulation of α-galactosidase A activity and glycosphingolipid metabolism affects DNA methylation. Bisulfite pyrosequencing revealed that changes in α-galactosidase A activity were associated with significantly altered DNA methylation in the androgen receptor promoter, and this effect was highly CpG loci-specific. Methylation array studies showed that α-galactosidase A activity and glycosphingolipid levels were associated with differential methylation of numerous CpG sites throughout the genome. We identified 15 signaling pathways that may be susceptible to methylation alterations in Fabry disease. By incorporating RNA sequencing data, we identified 21 genes that have both differential mRNA expression and methylation. Upregulated expression of collagen type IV alpha 1 and alpha 2 genes correlated with decreased methylation of these two genes. Methionine levels were elevated in Fabry patient cells and Fabry mouse tissues, suggesting that a perturbed methionine cycle contributes to the observed dysregulated methylation patterns. In conclusion, this study provides evidence that α-galactosidase A deficiency and glycosphingolipid storage may affect DNA methylation homeostasis and highlights the importance of epigenetics in the pathogenesis of Fabry disease and, possibly, of other lysosomal storage disorders.

Keywords: DNA methylation; Deoxygalactonojirimycin; Fabry disease; Globotriaosylceramide; Substrate reduction therapy; α-Galactosidase A.


Conflict of interest statement

None.

Figures

Fig. 1
Fig. 1
Cell models and the effect of α-gal A deficiency in methylation of specific CpG sites in AR gene promoter. (A) Summary of ‘genetic’ and ‘chemical’ cellular models used in this study. (B) Gb3 immunofluorescence staining demonstrating markedly increased lysosomal Gb3 storage in DGJ-treated IMFE1 cells compared to sham-treated control. Arrows indicate some of the Gb3 positive signals (red color). Scale bar, 25 μm. (C) Gb3 levels in sham-, DGJ-, or GZ161-treated IMFE1 cells measured by LC-MS/MS (n = 3). (D) Top: Map of 5′ region of human AR gene containing two ‘hot spot’ CpG regions. Each CpG is indicated by a vertical line. CpG nucleotide positions relative to transcription start site (indicated by right angle arrow), and the core-promoter region with a length of 150 bp that contains the elements essential for promoter activity (indicated by grey bar) are shown. Bottom: Methylation level (%) of individual CpG sites in two ‘hot spots' measured by pyrosequencing. Data are means of biological replicates (n = 2–4). (E) Average methylation level of 4 CpG sites in AR hot spot 1 (n = 2). (F, G) Average methylation level of 3 CpG sites in AR hot spot 2 (n = 3–4). (H) Average methylation level of 3 CpG sites in LINE-1 (n = 2).
Fig. 2
Fig. 2
DNA methylation array and RNA sequencing. (A) Principal component analysis plot. Samples in each group (n = 3 per group) were clustered together, except a sham control from chemical model (arrow) that was excluded from the subsequent analysis. (B) Summary of numbers of DMPs and DMRs in each treatment group. (C) Venn diagram showing high proportion of common DMPs between different treatment groups. Numbers of DMPs were shown. (D) Majority of common DMPs between DGJ- and GZ161-treatment groups had the same direction of changes (hyper- or hypo-methylation) in both treatments. (E) RNA-seq results for collagen genes and profibrotic genes. Data were presented as fold-change [IMFE1(mock): IMFE1(α-gal+)]. *FDR < 0.05. (F) Map of DMPs (vertical lines) in COL4A1 and COL4A2 genes. Two arrows indicate transcription from a shared bi-directional promoter (shown as a triangle). Data were presented as methylation difference [delta beta values, IMFE1(mock) vs. IMFE1(α-gal+)]. Most DMPs in these two genes (13/17 and 14/20 probes, respectively) exhibited hypomethylation in IMFE1(mock).
Fig. 3
Fig. 3
Methionine cycle metabolism and DNA methylation. (A, B) Methionine cycle metabolites in IMFE1 cells (A) and 6-month-old male mouse kidneys (B). *P < 0.05. Data were presented as % of levels in normal controls. Met, methionine; SAM, S-adenosylmethionine; SAH, S-adenosylhomocysteine; Cysta, cystathionine, Bet, betaine; Cho, choline; Hcy, homocysteine (total); Cys, cysteine (total). (C) Correlations between methionine levels and cystathionine (left), and SAM/SAH ratio (right) in mouse kidneys. (D) Schema of methionine cycle and DNA methylation/demethylation reactions. The major enzymes involved in these reactions were shown. MAT, methionine adenosyltransferase; GAMT, guanidinoacetate methyltransferase; GNMT, glycine N-methyltransferase; AHCY, s-adenosylhomocysteine hydrolase; BHMT, betaine-homocysteine methyltransferase; MTR, methionine synthase; SHMT, serine hydroxymethyltransferase; MTHFR, methylenetetrahydrofolate reductase; CBS, cystathionine β-synthase; CTH, cystathionine γ-lyase; GATM, L-arginine/glycine amidinotransferase; DNMT, DNA methyltransferase; TET, ten-eleven translocation, TDG, thymine-DNA glycosylase; DMG, dimethylglycine; 5mC, 5-methylcytosine. (E) Transcription levels (RNA-Seq data) of major enzymes that are involved in methionine cycle and DNA methylation/demethylation reactions. Data were presented as fold-change [IMFE1(mock): IMFE1(α-gal+)]. *FDR < 0.05. (F) mRNA levels of DNA methylation/demethylation related genes measured by quantitative RT-PCR. *P < 0.05.

References

    1. Brady R., Gal A.E., Bradley R.M., Martensson E., Warshaw A.L., Laster L. Enzymatic defect in Fabry disease: ceramide trihexosidase deficiency. N. Engl. J. Med. 1967;276:1163–1167. - PubMed
    1. Desnick R.J., Ioannou Y.A., Eng C.M. In: In The Metabolic and Molecular Bases of Inherited Disease. Scriver C.R., Beaudet A.L., Sly W.S., Valle D., editors. McGraw-Hill; New York: 2001. pp. 3733–3774.
    1. Schiffmann R. Fabry disease. Pharmacol. Ther. 2009;122:65–77. - PubMed
    1. Moore D.F., Gelderman M.P., Ferreira P.A., Fuhrmann S.R., Yi H., Elkahloun A., Lix L.M., Brady R.O., Schiffmann R., Goldin E. Genomic abnormalities of the murine model of Fabry disease after disease-related perturbation, a systems biology approach. Proc. Natl. Acad. Sci. U. S. A. 2007;104:8065–8070. - PMC - PubMed
    1. Moore D.F., Krokhin O.V., Beavis R.C., Ries M., Robinson C., Goldin E., Brady R.O., Wilkins J.A., Schiffmann R. Proteomics of specific treatment-related alterations in Fabry disease: a strategy to identify biological abnormalities. Proc. Natl. Acad. Sci. U. S. A. 2007;104:2873–2878. - PMC - PubMed

LinkOut - more resources