Identification of key monocytes/macrophages related gene set of the early-stage abdominal aortic aneurysm by integrated bioinformatics analysis and experimental validation
- PMID: 36186997
- PMCID: PMC9515382
- DOI: 10.3389/fcvm.2022.950961
Identification of key monocytes/macrophages related gene set of the early-stage abdominal aortic aneurysm by integrated bioinformatics analysis and experimental validation
Abstract
Objective: Abdominal aortic aneurysm (AAA) is a lethal peripheral vascular disease. Inflammatory immune cell infiltration is a central part of the pathogenesis of AAA. It's critical to investigate the molecular mechanisms underlying immune infiltration in early-stage AAA and look for a viable AAA marker.
Methods: In this study, we download several mRNA expression datasets and scRNA-seq datasets of the early-stage AAA models from the NCBI-GEO database. mMCP-counter and CIBERSORT were used to assess immune infiltration in early-stage experimental AAA. The scRNA-seq datasets were then utilized to analyze AAA-related gene modules of monocytes/macrophages infiltrated into the early-stage AAA by Weighted Correlation Network analysis (WGCNA). After that, Gene Ontology (GO) and Kyoto Encyclopedia of Genes and Genomes (KEGG) functional enrichment analysis for the module genes was performed by ClusterProfiler. The STRING database was used to create the protein-protein interaction (PPI) network. The Differentially Expressed Genes (DEGs) of the monocytes/macrophages were explored by Limma-Voom and the key gene set were identified. Then We further examined the expression of key genes in the human AAA dataset and built a logistic diagnostic model for distinguishing AAA patients and healthy people. Finally, real-time quantitative polymerase chain reaction (RT-qPCR) and Enzyme Linked Immunosorbent Assay (ELISA) were performed to validate the gene expression and serum protein level between the AAA and healthy donor samples in our cohort.
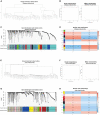
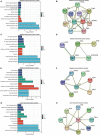
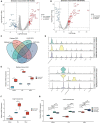
Results: Monocytes/macrophages were identified as the major immune cells infiltrating the early-stage experimental AAA. After pseudocell construction of monocytes/macrophages from scRNA-seq datasets and WGCNA analysis, four gene modules from two datasets were identified positively related to AAA, mainly enriched in Myeloid Leukocyte Migration, Collagen-Containing Extracellular matrix, and PI3K-Akt signaling pathway by functional enrichment analysis. Thbs1, Clec4e, and Il1b were identified as key genes among the hub genes in the modules, and the high expression of Clec4e, Il1b, and Thbs1 was confirmed in the other datasets. Then, in human AAA transcriptome datasets, the high expression of CLEC4E, IL1B was confirmed and a logistic regression model based on the two gene expressions was built, with an AUC of 0.9 in the train set and 0.79 in the validated set. Additionally, in our cohort, we confirmed the increased serum protein levels of IL-1β and CLEC4E in AAA patients as well as the increased expression of these two genes in AAA aorta samples.
Conclusion: This study identified monocytes/macrophages as the main immune cells infiltrated into the early-stage AAA and constructed a logistic regression model based on monocytes/macrophages related gene set. This study could aid in the early diagnostic of AAA.
Keywords: WGCNA; abdominal aortic aneurysm; bioinformatics; macrophage; single-cell RNA sequencing.
Copyright © 2022 Cheng, Liu, Jing, Jiang, Wang, Chu, Jia and Xin.
Conflict of interest statement
The authors declare that the research was conducted in the absence of any commercial or financial relationships that could be construed as a potential conflict of interest.
Figures


Similar articles
-
Interleukin 2 receptor subunit beta as a novel hub gene plays a potential role in the immune microenvironment of abdominal aortic aneurysms.Gene. 2022 Jun 15;827:146472. doi: 10.1016/j.gene.2022.146472. Epub 2022 Apr 4. Gene. 2022. PMID: 35381314
-
Construction of the miRNA/Pyroptosis-Related Molecular Regulatory Axis in Abdominal Aortic Aneurysm: Evidence From Transcriptome Data Combined With Multiple Machine Learning Approaches Followed by Experiment Validation.J Immunol Res. 2024 Oct 30;2024:1429510. doi: 10.1155/2024/1429510. eCollection 2024. J Immunol Res. 2024. PMID: 39512836 Free PMC article.
-
Single-cell RNA and transcriptome sequencing profiles identify immune-associated key genes in the development of diabetic kidney disease.Front Immunol. 2023 Mar 29;14:1030198. doi: 10.3389/fimmu.2023.1030198. eCollection 2023. Front Immunol. 2023. PMID: 37063851 Free PMC article.
-
Integrated identification of key immune related genes and patterns of immune infiltration in calcified aortic valvular disease: A network based meta-analysis.Front Genet. 2022 Sep 21;13:971808. doi: 10.3389/fgene.2022.971808. eCollection 2022. Front Genet. 2022. PMID: 36212153 Free PMC article.
-
Exploring the role of mitochondrial-associated and peripheral neuropathy genes in the pathogenesis of diabetic peripheral neuropathy.BMC Neurol. 2024 Mar 13;24(1):95. doi: 10.1186/s12883-024-03589-0. BMC Neurol. 2024. PMID: 38481183 Free PMC article. Review.
Cited by
-
Assessing the causal relationship between circulating immune cells and abdominal aortic aneurysm by bi-directional Mendelian randomization analysis.Sci Rep. 2024 Jun 14;14(1):13733. doi: 10.1038/s41598-024-64789-9. Sci Rep. 2024. PMID: 38877212 Free PMC article.
-
Cromolyn prevents cerebral vasospasm and dementia by targeting WDR43.Front Aging Neurosci. 2023 Apr 13;15:1132733. doi: 10.3389/fnagi.2023.1132733. eCollection 2023. Front Aging Neurosci. 2023. PMID: 37122373 Free PMC article.
-
CD74 facilitates immunotherapy response by shaping the tumor microenvironment of hepatocellular carcinoma.Mol Med. 2024 Aug 8;30(1):116. doi: 10.1186/s10020-024-00884-x. Mol Med. 2024. PMID: 39118044 Free PMC article.
-
Single-cell RNA sequencing provides novel insights to pathologic pathways in abdominal aortic aneurysm.Front Cardiovasc Med. 2023 May 23;10:1172080. doi: 10.3389/fcvm.2023.1172080. eCollection 2023. Front Cardiovasc Med. 2023. PMID: 37288252 Free PMC article. Review.
-
Abdominal aortic aneurysm and cardiometabolic traits share strong genetic susceptibility to lipid metabolism and inflammation.Nat Commun. 2024 Jul 5;15(1):5652. doi: 10.1038/s41467-024-49921-7. Nat Commun. 2024. PMID: 38969659 Free PMC article.
References
-
- Golledge J, Muller J, Daugherty A, Norman P. Abdominal aortic aneurysm: pathogenesis and implications for management. Arterioscler Thromb Vasc Biol. (2006) 26:2605–13. - PubMed
LinkOut - more resources
Full Text Sources
Miscellaneous

