. 2022 Sep 17:9:101859.
doi: 10.1016/j.mex.2022.101859. eCollection 2022.

Three highly variable genome regions of the four dengue virus serotypes can accurately recapitulate the CDS phylogeny

Affiliations

Three highly variable genome regions of the four dengue virus serotypes can accurately recapitulate the CDS phylogeny

Eduardo D Rodríguez-Aguilar et al. MethodsX. .

Abstract

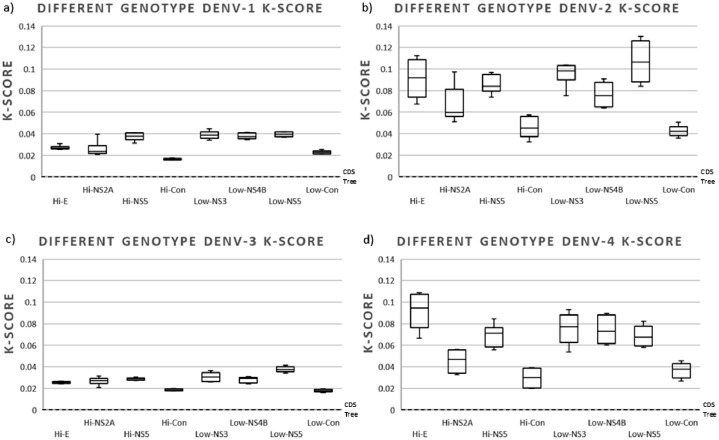
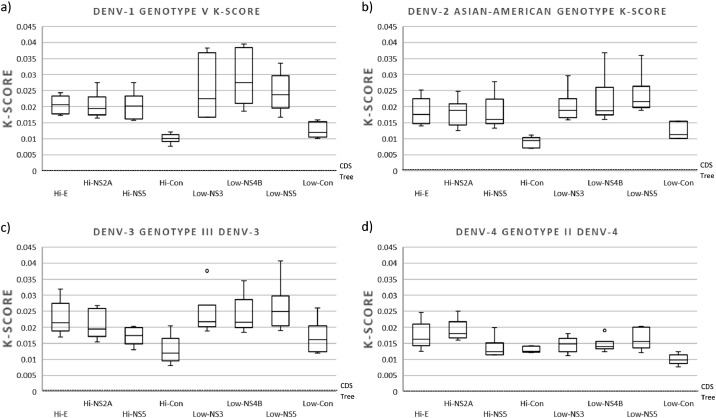
The circulation of the four-dengue virus (DENV) serotypes has significantly increased in recent years, accompanied by an increase in viral genetic diversity. In order to conduct disease surveillance and understand DENV evolution and its effects on virus transmission and disease, efficient and accurate methods for phylogenetic classification are required. Phylogenetic analysis of different viral genes sequences is the most used method, the envelope gene (E) being the most frequently selected target. We explored the genetic variability of the four DENV serotypes throughout their complete coding sequence (CDS) of sequences available in GenBank and used genomic regions of different variability rate to recapitulate the phylogeny obtained with the DENV CDS. Our results indicate that the use of high or low variable regions accurately recapitulate the phylogeny obtained with CDS of sequences from different DENV genotypes. However, when analyzing the phylogeny of a single genotype, highly variable regions performed better in recapitulating the distance branch length, topology, and support of the CDS phylogeny. The use of three concatenated highly variable regions was not statistically different in distance branch length and support to that obtained in CDS phylogeny.•This study demonstrated the ability of highly variable regions of the DENV genome to recapitulate the phylogeny obtained with the full coding sequence (CDS).•The use of genomic regions of high or low variability did not affect the performance in recapitulating the phylogeny obtained with CDS from different genotypes. However, when phylogeny was analyzed for sequences from a single genotype, highly variable regions performed better in recapitulating the distance branch length, topology, and support of the CDS phylogeny.•The use of concatenated highly variable genome regions represent a useful option for recapitulating genome-wide phylogenies in analyses of sequences belonging to the same DENV genotype.

Keywords: Bayesian inference; Dengue virus; Genotyping; Highly variable regions; Lineages; Phylogeny.


Figures

Image, graphical abstract
Graphical abstract
Fig 1
Fig. 1
Genome-wide analysis of hypervariable sites for individual DENV serotypes (a. DENV1, b. DENV2, c. DENV3 and d DENV4). Mutation profile of nucleotides, Synonymous and non-synonymous mutation rate. The “x” axis represents the position in the DENV CDS and “y” axis represents the variability score, where 100 indicate the highest rate variability.
Fig 2
Fig. 2
Genome-wide analysis of hypervariable sites from the four DENV serotypes together. Mutation profile of nucleotides, Synonymous and non-synonymous mutation rate. The “x” axis represents the position in the DENV CDS and “y” axis represents the variability score, where 100 indicate the highest rate variability.
Fig 3
Fig. 3
Box plot of the relative branch length of the trees constructed with sequences of different genotypes of (a) DENV-1, (b) DENV-2, (c) DENV-3, and (d) DENV-4. The trees constructed with the different regions (Hi- and Low-variables) were compared with the one constructed with their respective CDS to obtain the scaling factor. For each column, the box represents the second (Q2) and third (Q3) quartiles of the data distribution, the line within the box marks the median, and whiskers denote the most extreme data (that are not outliers).
Fig 4
Fig. 4
Box plot of the relative branch length of the trees constructed with sequences of a single genotype of (a) DENV-1 (genotype V), (b) DENV-2 (genotype Asian-American), (c) DENV-3 (Genotype III), and (d) DENV-4 (genotype II). The trees constructed with the different regions (Hi- and Low-variables) were compared with the one constructed with their respective CDS to obtain the scaling factor. For each column, the box represents the second (Q2) and third (Q3) quartiles of the data distribution, the line within the box marks the median, whiskers denote the most extreme data (that are not outliers), and circles indicate outliers.
Fig 5
Fig. 5
Box plot of the topological incongruence of the trees constructed with sequences of different genotypes of (a) DENV-1, (b) DENV-2, (c) DENV-3, and (d) DENV-4. The trees constructed with the different regions (Hi- and Low-variables) were compared with the one constructed with their respective CDS to obtain the K-Score. For each column, the box represents the second (Q2) and third (Q3) quartiles of the data distribution, the line within the box marks the median, and whiskers denote the most extreme data (that are not outliers).
Fig 6
Fig. 6
Box plot of the topological incongruence of the trees constructed with sequences of a single genotype of (a) DENV-1 (genotype V), (b) DENV-2 (genotype Asian-American), (c) DENV-3 (Genotype III), and (d) DENV-4 (genotype II). The trees constructed with the different regions (Hi- and Low-variables) were compared with the one constructed with their respective CDS to obtain the K-Score. For each column, the box represents the second (Q2) and third (Q3) quartiles of the data distribution, the line within the box marks the median, whiskers denote the most extreme data (that are not outliers), and circles indicate outliers.
Fig 7
Fig. 7
Box plot of the confidence of the trees constructed with sequences of different genotypes of (a) DENV-1, (b) DENV-2, (c) DENV-3, and (d) DENV-4. The tree confidence was calculated as mean posterior probability (mean PP) estimated by adding the posterior probability of all the nodes obtained in each comparison tree and dividing by the number of nodes obtained in the corresponding reference tree. For each column, the box represents the second (Q2) and third (Q3) quartiles of the data distribution, the line within the box marks the median, and whiskers denote the most extreme data (that are not outliers).
Fig 8
Fig. 8
Box plot of the confidence of the trees constructed with sequences of a single genotype of (a) DENV-1 (genotype V), (b) DENV-2 (genotype Asian-American), (c) DENV-3 (Genotype III), and (d) DENV-4 (genotype II). The tree confidence was calculated as mean posterior probability (mean PP) estimated by adding the posterior probability of all the nodes obtained in each comparison tree and dividing by the number of nodes obtained in the corresponding reference tree. For each column, the box represents the second (Q2) and third (Q3) quartiles of the data distribution, the line within the box marks the median, and whiskers denote the most extreme data (that are not outliers).

References

    1. Chen R., Vasilakis N. Dengue — quo tu et quo vadis? Viruses. 2011;3:1562–1608. doi: 10.3390/v3091562. - DOI - PMC - PubMed
    1. Parameswaran P., Charlebois P., Tellez Y., Nunez A., Ryan E.M., Malboeuf C.M., Levin J.Z., Lennon N.J., Balmaseda A., Harris E., Henn M.R. Genome-wide patterns of intrahuman dengue virus diversity reveal associations with viral phylogenetic clade and interhost diversity. J Virol. 2012;86:8546–8558. doi: 10.1128/JVI.00736-12. - DOI - PMC - PubMed
    1. Sim S., Hibberd M.L. Genomic approaches for understanding dengue: insights from the virus, vector, and host. Genome Biol. 2016;17 doi: 10.1186/s13059-016-0907-2. - DOI - PMC - PubMed
    1. Rico-Hesse R. Microevolution and virulence of dengue viruses. Adv Virus Res. 2003;59:315–341. - PMC - PubMed
    1. Holmes E.C., Twiddy S.S. The origin, emergence and evolutionary genetics of dengue virus. Infect Genet Evol. 2003;3:19–28. - PubMed

LinkOut - more resources