. 2022 Aug 30;13(9):5015-5034.
doi: 10.1364/BOE.464547. eCollection 2022 Sep 1.

Automated assessment of breast margins in deep ultraviolet fluorescence images using texture analysis

Affiliations

Automated assessment of breast margins in deep ultraviolet fluorescence images using texture analysis

Tongtong Lu et al. Biomed Opt Express. .

Abstract

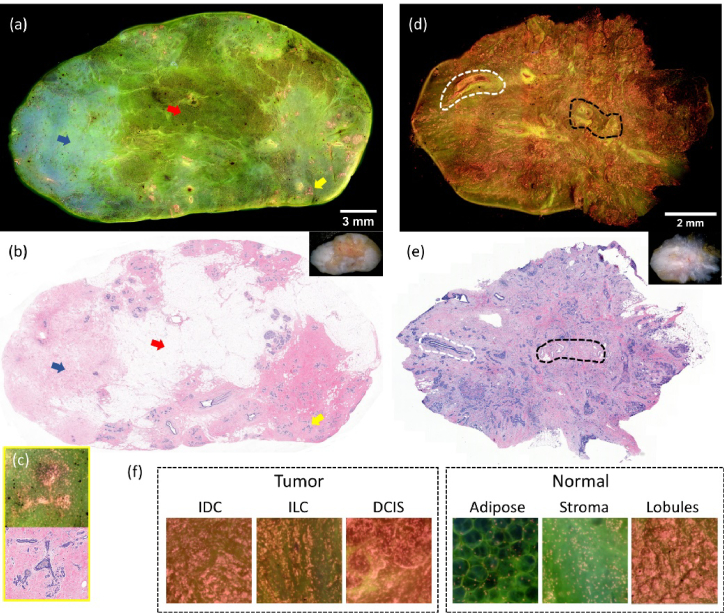
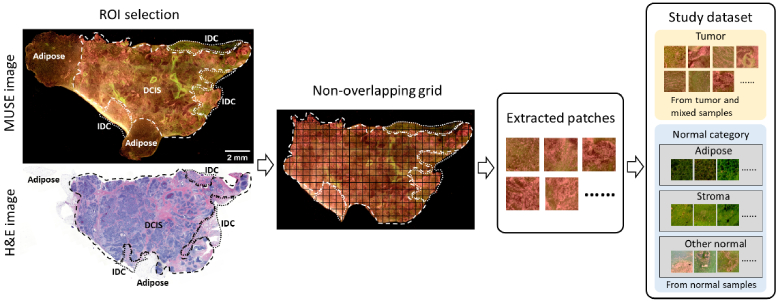
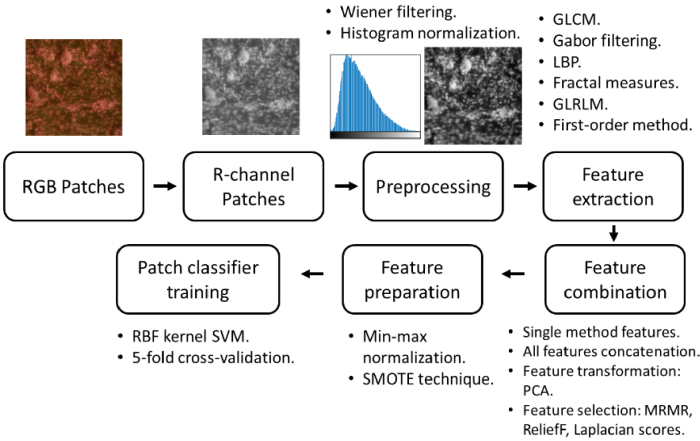
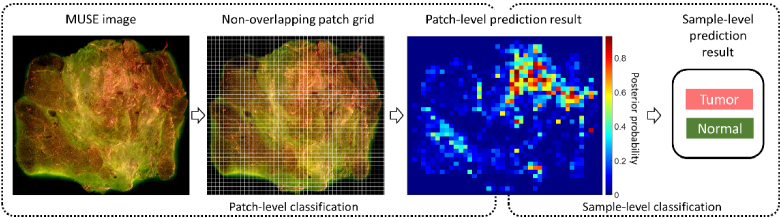
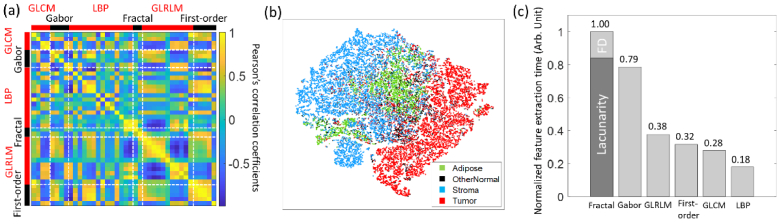
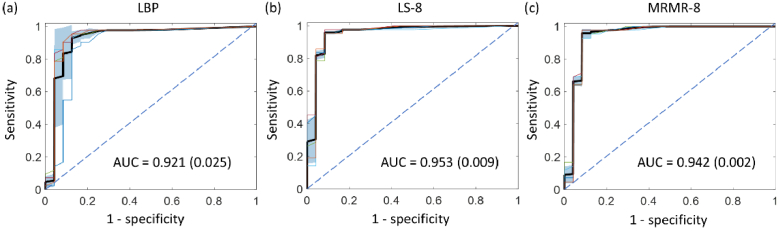
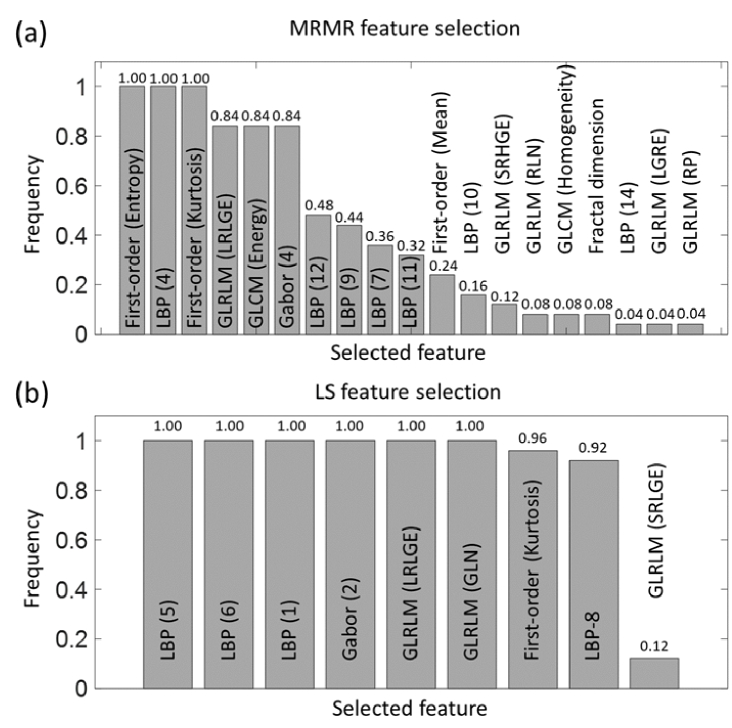
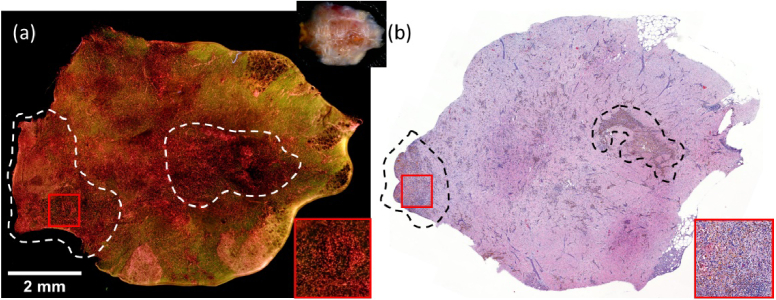
Microscopy with ultraviolet surface excitation (MUSE) is increasingly studied for intraoperative assessment of tumor margins during breast-conserving surgery to reduce the re-excision rate. Here we report a two-step classification approach using texture analysis of MUSE images to automate the margin detection. A study dataset consisting of MUSE images from 66 human breast tissues was constructed for model training and validation. Features extracted using six texture analysis methods were investigated for tissue characterization, and a support vector machine was trained for binary classification of image patches within a full image based on selected feature subsets. A weighted majority voting strategy classified a sample as tumor or normal. Using the eight most predictive features ranked by the maximum relevance minimum redundancy and Laplacian scores methods has achieved a sample classification accuracy of 92.4% and 93.0%, respectively. Local binary pattern alone has achieved an accuracy of 90.3%.


Conflict of interest statement

The authors have no conflicts of interest to claim.

Figures

Fig. 1.
Fig. 1.
Two representative examples and fluorescence image patches of typical breast tissue types. The MUSE image (a) and H&E image (b) of a normal (tumor-free) sample (∼31 × 15 mm2 size). Fibrous stroma indicated by blue arrows, adipose indicated by red arrows, and lobules indicated by yellow arrows match in the two images. Zoomed-in images of lobules pointed by the yellow arrows are shown at the lower left corner (c). The MUSE image (d) and H&E image (e) of a tumor sample (∼12 × 9 mm2 size) from an IDC grade 2, ER/PR+, HER2- case. Tumor cells appear with variable cellularity in fibrosis tissue and interspersed benign elements, such as the blood vessels highlighted by the black dashed line and ducts enclosed by the white dashed line. (f) Typical image patches of different tissue types cropped from various specimens.
Fig. 2.
Fig. 2.
The workflow for construction of the MUSE image patch dataset illustrated using a mixed malignant specimen with mostly DCIS and some IDC on the edge. The H&E image is used as the ground truth guiding the selection of regions-of-interest (ROIs) in the MUSE image. DCIS is enclosed by dashed lines and IDC is enclosed by dot lines. All normal regions from malignant samples are excluded for analysis. A non-overlapping grid with 400 × 400 pixels (or 0.51 × 0.51 mm2 on the tissue surface) is used for patch extraction. Selected patches are labeled as tumor, adipose, stroma, or other normal.
Fig. 3.
Fig. 3.
The workflow for quantitative feature extraction and patch classifier training. The red (R) channel of an RGB color patch is used for feature extraction. Preprocessing operations, including Wiener filtering for noise reduction and histogram normalization, are performed prior to the feature extraction. Gray-level TA methods, including GLCM, Gabor filtering, LBP, fractal measures (fractal dimension and lacunarity), GLRLM, and first-order method, are used to obtain features for patch texture characterization. Several different feature subsets are tested. Then, min-max normalization is applied to rescale the selected features and the SMOTE technique is applied for minor class synthesis in the feature space to handle the data imbalance issue. Finally, the Radial Basis Function (RBF) kernel support vector machine (SVM) is trained as the patch classifier. 5-fold cross-validation is used during the process.
Fig. 4.
Fig. 4.
The process for margin-level binary prediction (tumor vs. normal). A MUSE image of a full tissue surface is divided into many patches of 400 × 400 pixels in size by a non-overlapping gird. A trained patch classifier predicts the class of each patch with posterior probabilities as the confidence scores. Based on patch-level classification results, a decision fusion method decides the binary label of tumor or normal for the full margin.
Fig. 5.
Fig. 5.
Results of texture feature analysis. (a) Pearson’s linear correlation between extracted features. High intra-method correlations are observed among the GLRLM and first-order method features. LBP shows moderate-to-low level of intra-method correlations. Overall, LBP and fractal measures have of the lowest inter-method correlations with other methods. (b) Visualization of all patches in the study dataset in a 2-dimensional space via the t-SNE algorithm. Most normal patches (adipose and stroma) cluster together and show a clear boundary to tumor patches. Some other normal patches intersperse among the tumor cluster. (c) Normalized texture feature extraction time. FD denotes fractal dimension. LBP is the most time-efficient method among the six TA techniques included in this study.
Fig. 6.
Fig. 6.
ROC curves of sample-level classification using LBP (a), LS-8 (b), and MRMR-8 (c) features. Each thin colored curve is the ROC curve of one individual sample partition. Thick black curves represent the ROC curves averaged over the 5 sample partitions. Areas denoting standard deviations are in light blue shadows. The means and standard deviations (in parentheses) of the AUC are also presented.
Fig. 7.
Fig. 7.
The frequencies of features being selected by MRMR method (a) and LS method (b). Eight features were selected in each training/test round. Because five different sample partitions were tested and a 5-fold cross validation was used on each partition, a total of 25 rounds were performed. List of acronyms of statistics obtained by GLRLM method: LRLGE (long run low gray-level emphasis), SRHGE (short run high gray-level emphasis), RLN (run length nonuniformity), LGRE (low gray-level run emphasis), RP (run percentage), GLN (gray-level nonuniformity), SRLGE (short run low gray-level emphasis).
Fig. 8.
Fig. 8.
Examples of two false-negatively misclassified samples. The first sample (20 × 11 mm2) is from a grade 2, ER/PR+, HER2- IDC case. A picture of the specimen is shown at the center. (a) The MUSE image and (b) H&E image of the sample. A small portion of tissue indicated by the dashed line on the right side in (a) was lost during the formalin-fixed paraffin-embedded (FFPE) process. Therefore, this area is not reflected on the H&E image in (b). The patient had received neoadjuvant therapy and a tumor cellularity of 5% following therapy was reported. (c) Zoomed-in area enclosed by blue boxes shows sparse cell nuclei in dense fibrosis tissue. (d) Zoomed-in area enclosed by black boxes shows slightly higher nuclei density. The second sample (12.5 × 12 mm2) is from a grade 2, ER/PR+, HER2- ILC case. A picture of the specimen is shown at the lower right corner. (e) The MUSE image and (f) H&E image of the sample.
Fig. 9.
Fig. 9.
A false positively misclassified sample (∼10 × 7 mm2 size). The MUSE image in (a) and the H&E image in (b) exhibit much hemosiderin and fibrosis, which usually exists in the track of a biopsy. A picture of the specimen is shown at the upper right position of (a). Areas with the highest concentration of hemosiderin are enclosed by dashed lines in both (a) and (b). Zoomed-in details of the region highlighted by the red boxes are displayed at the lower right corner in the two images. The histopathology diagnosis on (b) did not find any tumor cell.

References

    1. Siegel R. L., Miller K. D., Fuchs H. E., Jemal A., “Cancer statistics, 2022,” CA: Cancer J. Clin. 72, 72–77 (2022).10.3322/caac.21708. - DOI - PubMed
    1. Nash R., Goodman M., Lin C. C., Freedman R. A., Dominici L. S., Ward K., Jemal A., “State variation in the receipt of a contralateral prophylactic mastectomy among women who received a diagnosis of invasive unilateral early-stage breast cancer in the United States, 2004-2012,” JAMA Surg. 152(7), 648–657 (2017).10.1001/jamasurg.2017.0115 - DOI - PMC - PubMed
    1. Wong S. M., Freedman R. A., Sagara Y., Aydogan F., Barry W. T., Golshan M., “growing use of contralateral prophylactic mastectomy despite no improvement in long-term survival for invasive breast cancer,” Ann. Surg. 265(3), 581–589 (2017).10.1097/SLA.0000000000001698 - DOI - PubMed
    1. Kummerow K. L., Du L., Penson D. F., Shyr Y., Hooks M. A., “Nationwide trends in mastectomy for early-stage breast cancer,” JAMA Surg. 150(1), 9–16 (2015).10.1001/jamasurg.2014.2895 - DOI - PubMed
    1. Kantor O., Pesce C., Kopkash K., Barrera E., Winchester D. J., Kuchta K., Yao K., “Impact of the Society of Surgical Oncology-American Society for Radiation Oncology margin guidelines on breast-conserving surgery and mastectomy trends,” J Am. Coll. Surg. 229(1), 104–114 (2019).10.1016/j.jamcollsurg.2019.02.051 - DOI - PubMed

LinkOut - more resources