. 2022 Aug 25;13(9):4954-4969.
doi: 10.1364/BOE.462493. eCollection 2022 Sep 1.

Combined optical fluorescence microscopy and X-ray tomography reveals substructures in cell nuclei in 3D

Affiliations

Combined optical fluorescence microscopy and X-ray tomography reveals substructures in cell nuclei in 3D

Andrew Wittmeier et al. Biomed Opt Express. .

Abstract

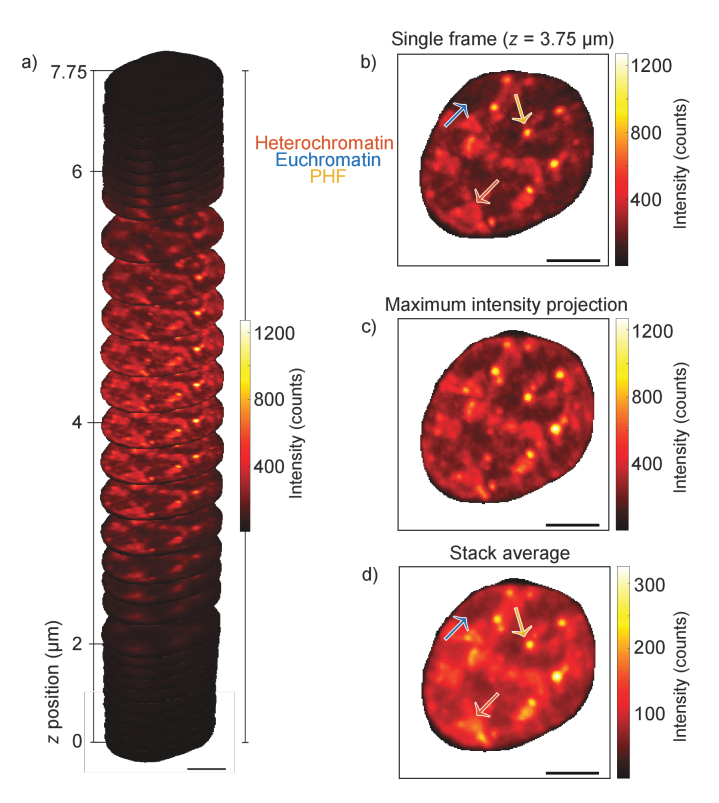
The function of a biological cell is fundamentally defined by the structural architecture of packaged DNA in the nucleus. Elucidating information about the packaged DNA is facilitated by high-resolution imaging. Here, we combine and correlate hard X-ray propagation-based phase contrast tomography and visible light confocal microscopy in three dimensions to probe DNA in whole cell nuclei of NIH-3T3 fibroblasts. In this way, unlabeled and fluorescently labeled substructures within the cell are visualized in a complementary manner. Our approach enables the quantification of the electron density, volume and optical fluorescence intensity of nuclear material. By joining all of this information, we are able to spatially localize and physically characterize both active and inactive heterochromatin, euchromatin, pericentric heterochromatin foci and nucleoli.


Conflict of interest statement

The authors declare no conflicts of interest.

Figures

Fig. 1.
Fig. 1.
Schematic of the experimental setup for X-ray propagation-based phase contrast tomography measurements. The X-rays are generated by an undulator and are subsequently monochromatized. The beam is focused by a set of KB mirrors prior to being coupled into the waveguide. The sample is mounted on a fully motorized stage and placed at a series of defocused positions z1 with respect to the focus position at z0 . Projections are recorded at a sample-to-detector distance of z2 . b) Reconstructed tomographic slice of a cell. The cell nucleus is bound by the dotted square. c) Zoom-in of the bound region from subfigure b). All scale bars are 5 µm.
Fig. 2.
Fig. 2.
a) Confocal z -stack of a lyophilized, whole cell nucleus. All individual micrographs composing the stack have the same colorscale. b) A single micrograph from the confocal stack shown in a). A PHF is indicated by the yellow arrow, and examples of the surrounding heterochromatin and euchromatin are indicated by the orange and blue arrows, respectively. c) The maximum intensity projection of the stack shown in a). d) The average projection of the stack shown in a). Note that the color scale of the average projection differs from those of a)-c). All scale bars are 5 µm.
Fig. 3.
Fig. 3.
a) The center confocal micrograph of nucleus 1. The yellow arrow indicates the location of a PHF. Examples of heterochromatin and euchromatin are indicated by the orange and blue arrows, respectively. b) Logic mask corresponding to the confocal micrograph shown in subfigure a). The spatial distributions of euchromatin, heterochromatin and PHFs are shown in blue, orange and yellow, respectively. For each micrograph of the confocal stack a unique logic mask is created using the same threshold values used to create subfigure b). c) For every micrograph of the confocal stack the percentage of intensity stemming from heterochromatin is calculated. All scale bars are 5 µm.
Fig. 4.
Fig. 4.
Electron density of the lyophilized nucleus shown throughout Fig. 2. a) Stack of reconstructed tomogram slices each with a voxel size of 100 × 100 × 260.4 nm3 . b) A single slice from the reconstructed tomogram show in a). Examples of nucleoli are indicated by black arrows. This slice corresponds to the same plane as shown in Fig. 2(b). c) The maximum projection of the stack show in subfigure a). d) The average projection of the stack shown in subfigure a). Note that the color scale of the average projection differs from those of a)-c). All scale bars are 5μm .
Fig. 5.
Fig. 5.
a) The center tomographic slice of nucleus 1. Note that this is the same plane as shown in Fig. 3(a). Examples of nucleoli are indicated by the black arrows. b) Logic mask corresponding to the reconstructed slice shown in a). The spatial distribution of nucleoli and the surrounding nuclear material are shown in purple and cyan, respectively. For every slice of the tomographic stack a unique logic mask is created using the same threshold used to segment subfigure a). Subfigures a), b), are also shown in Fig. S3f) and h), respectively, in Supplement 1. c) For every tomographic slice the percentage of its total electron density stemming from nucleoli is calculated. All scale bars are 5 µm.
Fig. 6.
Fig. 6.
a)-c) Three examples (slices) of logic masks for nucleus 1 showing the spatial distribution of nucleoli (purple), heterochromatin (orange), PHFs (yellow) and inactive heterochromatin (green). Euchromatin occupies all regions not occupied by heterochromatin, PHFs or nucleoli and is shown in white. White arrows indicate regions where inactive heterochromatin is completely surrounded by heterochromatin. Black arrows indicate regions where PHFs are completely surrounded by heterochromatin. d) For every slice the percentage of heterochromatin that is inactive is calculated. e) 3D visualization of the nucleoli and PHFs belonging to nucleus 1 (voxel size: 100 × 100 × 260.4 nm3 ). All scale bars are 5 µm

References

    1. Watson J., Crick F., “Molecular structure of nucleic acids,” Nature 171(4356), 737–738 (1953).10.1038/171737a0 - DOI - PubMed
    1. Maeshima K., Hihara S., Eltsov M., “Chromatin structure: Does the 30-nm fibre exist in vivo?” Curr. Opin. Cell Biol. 22(3), 291–297 (2010).10.1016/j.ceb.2010.03.001 - DOI - PubMed
    1. Kirz J., Jacobsen C., Howells M., “Soft x-ray microscopes and their biological applications,” Q. Rev. Biophys. 28(1), 33–130 (1995).10.1017/S0033583500003139 - DOI - PubMed
    1. Sahl S., Hell S., Jakobs S., “Fluorescence nanoscopy in cell biology,” Nat. Rev. Mol. Cell Biol. 18(11), 685–701 (2017).10.1038/nrm.2017.71 - DOI - PubMed
    1. Pereiro E., “Correlative cryo-soft x-ray tomography of cells,” Biophys. Rev. 11(4), 529–530 (2019).10.1007/s12551-019-00560-z - DOI - PMC - PubMed

LinkOut - more resources