. 2022 Sep 15:10:1007775.
doi: 10.3389/fcell.2022.1007775. eCollection 2022.

Live imaging of echinoderm embryos to illuminate evo-devo

Affiliations

Live imaging of echinoderm embryos to illuminate evo-devo

Vanessa Barone et al. Front Cell Dev Biol. .

Abstract

Echinoderm embryos have been model systems for cell and developmental biology for over 150 years, in good part because of their optical clarity. Discoveries that shaped our understanding of fertilization, cell division and cell differentiation were only possible because of the transparency of sea urchin eggs and embryos, which allowed direct observations of intracellular structures. More recently, live imaging of sea urchin embryos, coupled with fluorescence microscopy, has proven pivotal to uncovering mechanisms of epithelial to mesenchymal transition, cell migration and gastrulation. However, live imaging has mainly been performed on sea urchin embryos, while echinoderms include numerous experimentally tractable species that present interesting variation in key aspects of morphogenesis, including differences in embryo compaction and mechanisms of blastula formation. The study of such variation would allow us not only to understand how tissues are formed in echinoderms, but also to identify which changes in cell shape, cell-matrix and cell-cell contact formation are more likely to result in evolution of new embryonic shapes. Here we argue that adapting live imaging techniques to more echinoderm species will be fundamental to exploit such an evolutionary approach to the study of morphogenesis, as it will allow measuring differences in dynamic cellular behaviors - such as changes in cell shape and cell adhesion - between species. We briefly review existing methods for live imaging of echinoderm embryos and describe in detail how we adapted those methods to allow long-term live imaging of several species, namely the sea urchin Lytechinus pictus and the sea stars Patiria miniata and Patiriella regularis. We outline procedures to successfully label, mount and image early embryos for 10-16 h, from cleavage stages to early blastula. We show that data obtained with these methods allows 3D segmentation and tracking of individual cells over time, the first step to analyze how cell shape and cell contact differ among species. The methods presented here can be easily adopted by most cell and developmental biology laboratories and adapted to successfully image early embryos of additional species, therefore broadening our understanding of the evolution of morphogenesis.

Keywords: echinoderm; live image; morphogenesis; sea star; sea urchin.


Conflict of interest statement

The authors declare that the research was conducted in the absence of any commercial or financial relationships that could be construed as a potential conflict of interest.

Figures

FIGURE 1
FIGURE 1
Echinoderm embryos as evo-devo models for epithelial compaction (A) Schematic evolutionary tree for the major echinoderm groups. Species with transparent embryos, ideal for imaging epithelial morphogenesis, have been described among the echinoidea, holothuroidea and asteroidea. (B) Schematic representation of the varied mechanisms of epithelial compaction observed among echinoderms. In sea urchins the early embryo has an outer layer of extracellular matrix - the hyalin layer (Hy, drawn in orange)—and the blastomeres are compact, adhering strongly to one another with the embryo sitting in the middle of the fertilization envelope (Fe), and extracellular fluid (blue) is excluded from the embryo. At later stages, fluid accumulates inside the embryo and forms the blastocoel (bc, teal). In sea star species, the blastomeres are less compact and the shape of the embryo is determined mainly by the size of the fertilization envelope. In some cases, as described for A. scopus, blastomeres do not adhere to each other but rather to the fertilization envelope itself. The sea star blastula is formed by blastomeres lining up along the fertilization envelope during subsequent rounds of cell division: eventually the embryonic cells undergo compaction and form a monolayered epithelium that seals the blastocoel.
FIGURE 2
FIGURE 2
Sea urchin embryo stained with the vital plasma membrane dye FM4-64. Zygotes were mounted on a MatTek dish chamber (see Methods) in 0.5 μg/ml FM4-64 in FSW and imaged on an inverted confocal microscope. While the signal to noise ratio is sufficient to visualize embryonic cells it does not allow 3D segmentation (see Figure 5 for comparison). Scale bar 20 μm.
FIGURE 3
FIGURE 3
Echinoderm injection setup (A) Injection set up composed of a Narishige IM-400 microinjector operated via a Narishige micromanipulator mounted on a Leica Dmi8 transmitted light inverted cell culture microscope. (B) Injection chamber for sea star oocytes and embryos, built by applying electrical tape onto a glass slide and positioning a coverslip on top. (C) Sea star injection chamber and needle positioned for injection. (D) Brightfield image of a sea star oocyte being injected inside a chamber formed by a glass slide and a coverslip separated by the electrical tape. (E) Mattek glass bottom dish prepared for sea urchin injection by scraping a line in the plastic next to the glass bottom and coating the glass with 1% protamine sulfate solution. (F) Sea urchin injection dish and needle position for injection. (G) Brightfield image of a sea urchin zygote being injected inside a protamine coated glass bottom dish. Scale bars: 100 μm.
FIGURE 4
FIGURE 4
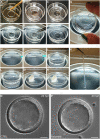
Mounting echinoderm embryos for live imaging (A–G) Mounting on glass bottom dish for imaging with inverted microscopes. A MatTek dish chamber is prepared by brushing a thin layer of vaseline on the plastic portion of the MatTek dish (A,B) and adding 250 μl of PS-FSW (C). Embryos are then transferred to the center of the dish (D) and a coverslip is gently placed on top of the PS-FSW drop containing the embryos (E). The coverslip is pressed down slowly so that excess water is pushed out of the chamber while the embryos remain centered in the dish (F). At this point the chamber is sealed and capillarity keeps the embryos from moving (G) (H–K) Mounting in FEP tube for imaging on vertical light-sheet microscope. The FEP tube is connected to a syringe (H,I), rinsed and filled with PS-FSW (J). The embryos are aspirated inside the tube (L), which is sealed by aspirating some vaseline (M). The tube is then disconnected from the syringe and the second side is sealed with vaseline too (N). At this point the embryos are mounted within a completely sealed FEP tube and capillarity keeps them from moving (K). Representative DIC images of sea star embryos cultured in a Petri dish (O) or mounted for imaging in a MatTek chamber (P). Scale bar: 50 μm.
FIGURE 5
FIGURE 5
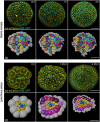
Representative stills from live imaging time-lapses of sea star (Patiria miniata) and sea urchin (Lytechinus pictus) embryos. Embryos were injected, mounted and imaged on an inverted confocal microscope (see Methods). The high image quality allowed cells to be fully segmented in three dimensions and tracked using the Fiji plug-in Limeseg (shown in the 3D rows for both sea star and sea urchin). Color coding in the 3D reconstruction shows clonal relationships between the cells. Scale bars: 50 μm.

References

    1. Arnone M. I., Byrne M., Martinez P. (2015). Echinodermata. Evol. Dev. Biol. Invertebr. 6, 1–58. 10.1007/978-3-7091-1856-6_1 - DOI
    1. Barone V., Byrne M., Lyons D. C. (2022). Lineage tracing shows that cell size asymmetries predict the dorsoventral axis in the sea star embryo. BMC Biol. 20, 179. 10.1186/s12915-022-01359-3 - DOI - PMC - PubMed
    1. Barone V., Lang M., Krens S. F. G., Pradhan S. J., Shamipour S., Sako K., et al. (2017). An effective feedback loop between cell-cell contact duration and morphogen signaling determines cell fate. Dev. Cell 43, 198–211. 10.1016/j.devcel.2017.09.014 - DOI - PubMed
    1. Barrantes F. J. (2021). Fluorescence sensors for imaging membrane lipid domains and cholesterol. Curr. Top. Membr. 88, 257–314. 10.1016/bs.ctm.2021.09.004 - DOI - PubMed
    1. Barsi J. C., Tu Q., Davidson E. H. (2014). General approach for in vivo recovery of cell type-specific effector gene sets. Genome Res. 24, 860–868. 10.1101/gr.167668.113 - DOI - PMC - PubMed

LinkOut - more resources