. 2022 Sep 15:13:958693.
doi: 10.3389/fmicb.2022.958693. eCollection 2022.

Novel CRISPR-based detection of Leishmania species

Affiliations

Novel CRISPR-based detection of Leishmania species

Eva Dueñas et al. Front Microbiol. .

Abstract

Tegumentary leishmaniasis, a disease caused by protozoan parasites of the genus Leishmania, is a major public health problem in many regions of Latin America. Its diagnosis is difficult given other conditions resembling leishmaniasis lesions and co-occurring in the same endemic areas. A combination of parasitological and molecular methods leads to accurate diagnosis, with the latter being traditionally performed in centralized reference and research laboratories as they require specialized infrastructure and operators. Clustered regularly interspaced short palindromic repeats/CRISPR-associated protein (CRISPR/Cas) systems have recently driven innovative tools for nucleic acid detection that combine high specificity, sensitivity and speed and are readily adaptable for point-of-care testing. Here, we harnessed the CRISPR-Cas12a system for molecular detection of Leishmania spp., emphasizing medically relevant parasite species circulating in Peru and other endemic areas in Latin America, with Leishmania (Viannia) braziliensis being the main etiologic agent of cutaneous and mucosal leishmaniasis. We developed two assays targeting multi-copy targets commonly used in the molecular diagnosis of leishmaniasis: the 18S ribosomal RNA gene (18S rDNA), highly conserved across Leishmania species, and a region of kinetoplast DNA (kDNA) minicircles conserved in the L. (Viannia) subgenus. Our CRISPR-based assays were capable of detecting down to 5 × 10⁻² (kDNA) or 5 × 100 (18S rDNA) parasite genome equivalents/reaction with PCR preamplification. The 18S PCR/CRISPR assay achieved pan-Leishmania detection, whereas the kDNA PCR/CRISPR assay was specific for L. (Viannia) detection. No cross-reaction was observed with Trypanosoma cruzi strain Y or human DNA. We evaluated the performance of the assays using 49 clinical samples compared to a kDNA real-time PCR assay as the reference test. The kDNA PCR/CRISPR assay performed equally well as the reference test, with positive and negative percent agreement of 100%. The 18S PCR/CRISPR assay had high positive and negative percent agreement of 82.1% and 100%, respectively. The findings support the potential applicability of the newly developed CRISPR-based molecular tools for first-line diagnosis of Leishmania infections at the genus and L. (Viannia) subgenus levels.

Keywords: 18S rDNA; CRISPR-Cas; Leishmania; invasive and non-invasive clinical specimens; kDNA; molecular diagnostics; nucleic acid detection; tegumentary leishmaniasis.


Conflict of interest statement

The authors declare that the research was conducted in the absence of any commercial or financial relationships that could be construed as a potential conflict of interest.

Figures

Figure 1
Figure 1
Schematic of the PCR coupled CRISPR-Cas12a-based assay workflow for detection of Leishmania spp. in clinical samples. (1) Skin lesion specimens suggestive of CL are processed for gDNA extraction. (2) The isolated DNA is subjected to PCR preamplification using primers targeting Leishmania kDNA minicircles or 18S rDNA, or the sample control, human RNase P gene. (3) The PCR amplicon is then used as input DNA for Cas12a-based detection guided by a target-specific CRISPR RNA (crRNA). A ternary complex is formed if the target DNA is present in the reaction mixture. Cas12a recognizes a 5′-TTTV-3′ PAM in the target DNA, which results in base pairing between the crRNA guide (spacer) segment and the complementary target DNA. Upon specific target DNA recognition by Cas12a, the activated Cas12a enzyme generates non-sequence-specific cleavage of a single-stranded DNA (ssDNA) reporter probe, thereby producing a fluorescence signal that can be recorded by a fluorescence plate reader. (4) Normalized fluorescence readings (test sample/NTC), expressed as a fluorescence ratio, are used to interpret the assay results. As an illustrative example, data shown correspond to the kDNA target and are represented as mean ± standard deviation (SD; n = 2 independent amplification and detection runs). Standardized conditions consisted of ~ 90-min amplification (45 PCR cycles) and fluorescence signal (LbCas12a detection assay) at 20-min time point for kDNA and at 10-min time point for both 18S rDNA and RNase P. AU, arbitrary units; NTC, no-template control of the Cas12a reaction; HC, human PBMC gDNA from a healthy donor (negative control); PC, L. (V.) braziliensis M2904 gDNA (positive control); Samples S1–S3, DNA from clinical samples. Figure created with BioRender.com.
Figure 2
Figure 2
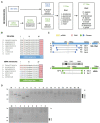
Bioinformatics analysis for crRNA and primer sets design. (A) Bioinformatics workflow for crRNA filtered selection for Leishmania kDNA minicircle and 18S rDNA biomarkers (see “Materials and Methods” for details). (B) Alignments of the target DNA sequence (that is complementary to the crRNA guide sequence) and flanking PAM from seven strains representative of different Leishmania species for the two targets and the Trypanosoma cruzi Y strain for the 18S rDNA target (the kDNA alignment including T. cruzi Y strain resulted in a 21 bp gap in the crRNA). Aligned sequences of the 18S rDNA gene concerned the strains: L. (V.) braziliensis MHOM/BR/75/M2904 2019 (TriTrypDB ID code: LbrM.27.2.208560), L. (V.) guyanensis MHOM/BR/1975/M4147 (GenBank accession number: X53913), L. (V.) panamensis MHOM/PA/94/PSC-1 (TriTrypDB ID code: LPMP_27rRNA1), L. (L.) amazonensis MHOM/BR/1973/M2269 (TriTrypDB ID code: LAMA_000552800), L. (L.) donovani MHOM/ET/67/HU3 (isolate LV9, TriTrypDB ID code: LdLV9.00.2.200020), L. (L.) major MHOM/IL/80/Friedlin (TriTrypDB ID code: LmjF.27.rRNA.06), L. (L.) infantum MCAN/ES/98/LLM-877 (strain JPCM5, TriTrypDB ID code: LINF_270031400), and T. cruzi Y (GenBank accession number: AF301912). The alignment of the nucleotide sequences of the kDNA minicircle target shown here included the strains (GenBank accession numbers are indicated between brackets): L. (V.) braziliensis MHOM/BR/75/M2904 (KY698821), L. (V.) guyanensis MHOM/BR/78/M5378 (KY699068), L. (V.) panamensis MHOM/PA/75/M4037 (AF118474), L. (L.) amazonensis RAT/BR/72/LV78 (KY698896), L. (L.) donovani MHOM/IN/80/DD8 (AF167712), L. (L.) major MHOM/IL/67/LV563 (KM555295), L. (L.) infantum MHOM/FR/91/LEM-2298 (AF190883). Nucleotide positions differing among aligned sequences are highlighted. The 18S rDNA target sequence shows conservation at the Leishmania genus level, whereas the selected kDNA minicircle target region is conserved among L. (Viannia) species. See Supplementary File S1 for all alignments. (C) Locations of PCR primer sets that flank the crRNA target site and PAM sequence in the target genomic regions (nucleotide positions are based on the L. (V.) braziliensis M2904 strain). For the kDNA minicircle target, we used PCR primers located within conserved sites CSB1 and CSB3 (see Supplementary Figure S1). (D) Agarose gel electrophoresis of PCR products generated with primer sets shown in (C). M, molecular size marker (100 bp; GeneRuler, Thermo Scientific). The PCR amplicons (6 μl) were mixed with 2 μl 6X TriTrack DNA loading dye (Thermo Scientific) plus SYBR Gold solution, loaded onto a 2% agarose gel FIGURE 2 (Continued)(18S rDNA) or 3% agarose gel (kDNA), and run in 1X TBE buffer for 1 h at 100 V. Upper gel: PCR products obtained using the 18S primer set 1 (lanes 1, 5, 9, 13), set 2 (lanes 2, 6, 10, 14), set 3 (lanes 3, 7, 11, 15), and set 4 (lanes 4, 8, 12, 16). Lanes 1–4: L. (V.) braziliensis M2904 gDNA (5 × 10⁴ parasite genome equivalents per reaction; positive control). The size of the expected product is 517 bp for 18S primer set 1 (lane 1), 435 bp for 18S primer set 2 (lane 2), 252 bp for 18S primer set 3 (lane 3), and 357 bp for 18S primer set 4 (lane 4). Lanes 5–8: no-template control (NTC1). Lanes 9–12: human PBMC gDNA (HC, negative control). The non-specific bands seen in the HC reaction with the 18S primer set 3 (lane 11) did not interfere with the Cas12a assay (see Figures 3B and 4B). Lanes 13–16: NTC2. Bottom gel: PCR products obtained using the kDNA primer set 1 (lanes 1, 3, 5, 7) and set 2 (lanes 2, 4, 6, 8). Lanes 1 and 2, L. (V.) braziliensis M2904 gDNA (5 × 10⁴ parasite genome equivalents per reaction; positive control). The size of the expected product is 116 bp for kDNA primer set 1 (lane 1) and 138 bp for kDNA primer set 2 (lane 2). Lanes 3 and 4, NTC1. Lanes 5 and 6, HC. The non-specific band seen in the HC reaction with the kDNA primer set 2 (lane 6) did not interfere with the Cas12a assay (see Supplementary Figures S2A–D). Lanes 7 and 8, NTC2. Processing of the gel images was performed using the ImageJ software (http://imagej.nih.gov/ij/).
Figure 3
Figure 3
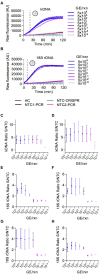
Analytical sensitivity of Cas12a-based detection of L. (V.) braziliensis M2904 DNA. Eight serial dilutions of L. (V.) braziliensis M2904 gDNA were subjected to PCR amplification followed by Cas12a-based detection for kDNA and 18S rDNA targets, for determination of the lowest amount of parasite genome equivalents (GE) per reaction that can be consistently detected. Different primer sets (shown in Figure 2C) were evaluated to determine those with the best performance. (A,B) FIGURE 3 (Continued) Raw fluorescence signal from the Cas12a reaction over 2 h on the amplicon generated with the kDNA primer set 1 (A) or 18S primer set 3 (B). Data from one experiment are shown, with fluorescence measurements taken on the Synergy H1 plate reader. (C,D) Data points depict the fluorescence ratio (fluorescence signal obtained at 20-min time point in the test sample relative to the NTC) from Cas12a reactions on the amplicon generated with the kDNA primer set 1 (C) or set 2 (D). Data are represented as mean ± SD (n = 3 independent amplification and detection runs). The X-axis has a logarithmic scale. (E–H) Data points depict the fluorescence ratio (fluorescence signal obtained at 10-min time point in the test sample relative to the NTC) from Cas12a reactions on the amplicon generated with the 18S primer set 1 (E), set 2 (F), set 3 (G), or set 4 (H). Data are represented as mean ± SD (n = 3 independent amplification and detection runs). The X-axis has a logarithmic scale. In (C,D,F), fluorescence measurements of Cas12a detection runs were taken on the Synergy H1 plate reader (2 runs) and on the Cytation 5 plate reader (one run). In (E,G), one detection run was performed on the Synergy H1 plate reader and 2 detection runs were made on the Cytation 5 plate reader. In (H), all 3 detection runs were conducted on the Cytation 5 plate reader.
Figure 4
Figure 4
Analytical specificity of Cas12a-based detection of Leishmania spp. using reference strains. (A) The specificity of the kDNA PCR/CRISPR assay was evaluated using gDNA (preamplified with kDNA primer set 1) from 11 Leishmania strains (7 of subgenus Viannia and 4 of subgenus Leishmania) and the T. cruzi Y strain. (B) The same DNA samples from reference strains as in (A) were tested in the specificity assessment of the 18S PCR/CRISPR assay using the 18S primer set 3 in the preamplification step. Bar graphs depict the fluorescence ratio from Cas12a reactions. Data are represented as mean ± SD (n = 2 independent amplification and detection runs). Statistical comparisons between groups were conducted using an unpaired t-test (two-tailed p values are shown; non-significant p values are indicated by ns). Negative controls included human PBMC gDNA and NTC controls of PCR and CRISPR reactions. Fluorescence measurements of Cas12a detection runs were taken on the Synergy H1 plate reader. See Supplementary Figure S3 for the full time course data.
Figure 5
Figure 5
Performance evaluation of PCR/CRISPR assays for detection of Leishmania DNA targets in clinical samples. (A) Sample analysis workflow including molecular analyses (kDNA cPCR, kDNA qPCR, and PCR/CRISPR targeting Leishmania kDNA and 18S rDNA or human RNase P gene) and data analysis (see Materials and Methods for more details). Figure created with BioRender.com. (B,C) Extracted DNA from 49 clinical samples was subjected to PCR amplification using primers specific to kDNA (B) and 18S rDNA (C) of Leishmania, followed by Cas12a-based detection. Fluorescence measurements were made on the Synergy H1 plate reader. Data shown represent the fluorescence ratio from Cas12a reactions. The dashed lines indicate the positive threshold cutoff value (mean of the fluorescence ratio of negative clinical samples +3SD; n = 10) for detection of Leishmania targets (cutoff value = 1.151 for kDNA and 1.171 for 18S rDNA). +, positive control (L. (V.) braziliensis M2904 gDNA; n = 6); −, negative control (human PBMC gDNA; n = 6). A subset of clinical samples was retested (black symbols). Full time course data for a group of clinical samples are provided in Supplementary Figure S4. (D) Heat maps displaying qPCR and PCR/CRISPR data from clinical samples. Left panel, the color scale represents quantification cycle (Cq) values determined by kDNA qPCR. The X mark inside the box symbol indicates that no Cq value was obtained. Second-fourth panels, the color scale represents fluorescence ratio values from Cas12a reactions for Leishmania kDNA and 18S rDNA targets and the sample control, human RNase P (RP) gene, respectively. The X mark inside the box symbol in the RP gene heatmap indicates not applicable. The detection threshold of the Cas12a assay on the Leishmania targets was set as the mean of the fluorescence ratio of negative clinical samples (n = 10) + 3SD. The positive threshold for the RP gene was set as a fluorescence signal of 5-fold above background (i.e., fluorescence ratio > 5; Khan et al., 2021). The test results (+, detected; −, not detected) are indicated on the right side of the heat maps. Samples are coded as 1–49. PC, positive control (L. (V.) braziliensis M2904 gDNA for the PCR/CRISPR assays; DNA from a biopsy specimen positive for Leishmania by kDNA cPCR used for the qPCR assay). HC, human PBMC gDNA. See Supplementary File S2 for the complete dataset of this study.
Figure 6
Figure 6
Performance evaluation of PCR/CRISPR assays across the range of parasite load levels in clinical samples. (A,B) Scatter plot showing the fluorescence ratio from Cas12a reactions for Leishmania targets in clinical samples (data shown in Figures 5B,C) versus Cq values determined by kDNA qPCR (A) or the parasite load (B). The dashed lines shown indicate the positive threshold cutoff value (mean of the fluorescence ratio of negative clinical samples + 3SD; n = 10) for detection of Leishmania targets (cutoff value = 1.151 for kDNA and 1.171 for 18S rDNA). (C) Scatter plot showing the inverse correlation between Cq values (determined by kDNA qPCR) and the parasite load in clinical samples. The parasite load is expressed as the number of Leishmania parasites/106 human cells.
Figure 7
Figure 7
Statistical analysis of Cas12a assay results. (A–C) Raw fluorescence data of the Cas12a detection assay on the kDNA target using DNA from clinical samples were expressed as percentage positivity (PP) relative to a positive control, which was run in each plate. (A) The predictor variable (PP) predicts the outcome variable Y (qPCR result) perfectly since PP > 29.9% corresponds to Y = 1 (positive) and PP ≤ 29.9% corresponds to Y = 0 (negative). (B) Plot representing the PP of positive (n = 39) and negative (n = 10) results obtained by the kDNA PCR/CRISPR assay in clinical samples. (C) ROC curve for the kDNA PCR/CRISPR test, ratio of true positive rate (sensitivity) vs. false positive rate (1-specificity) with area under the ROC curve of 1. (D–F) Raw fluorescence data of the Cas12a detection assay on the 18S rDNA target gene using DNA from clinical samples were expressed as PP relative to a positive control, which was run in each plate. (D) Sensitivity/specificity analysis vs. predicted probability (i.e., probability cutoff). The probability cutoff point determines the sensitivity (85%) and specificity (100%) of the 18S PCR/CRISPR assay. (E) Plot representing the PP (cutoff: 18.251%) of positive (n = 33) and negative (n = 16) results obtained by the 18S PCR/CRISPR assay in clinical samples. (F) ROC curve for the 18S PCR/CRISPR test, ratio of true positive rate (sensitivity) vs. false positive rate (1-specificity) with area under the ROC curve of 0.8795.
Figure 8
Figure 8
Assessment of PCR/CRISPR assay precision for detection of Leishmania targets. Measurements in independent experiments of the positive and negative controls (included alongside test samples) allowed to assess the intermediate precision (within-laboratory reproducibility) across PCR amplification and Cas12a-based detection runs. Fluorescence measurements taken on the Synergy H1 plate reader were considered for this analysis. The assays were performed by the same operator over a period of 5 months; two reagent batches of in vitro transcribed crRNAs were used. The positive control (PC) consisted of gDNA from L. (V.) braziliensis M2904 (5 × 10⁴ parasite genome equivalents/reaction used as input DNA). The human negative control (HC) consisted of gDNA from PBMC of a healthy donor (40 ng of input DNA). Two NTC reactions were included in PCR runs to monitor for contamination: NTC1, kept closed without water addition [this control served for normalization of raw fluorescence values of the Cas12a reaction, expressed as a fluorescence ratio], and NTC2, made with water instead of the template. NTC-CRISPR, no-template control of the Cas12a reaction. (A) Raw fluorescence signal from the Cas12a reaction over 1 h for the kDNA target. Mean raw fluorescence values (arbitrary units, AU) ± SD are plotted as lines with error bars (n = 12). (B) The data in (A) were normalized to the fluorescence of the NTC1 (PCR blank) and expressed as a fluorescence ratio. (C) The normalized data in (B) were used for detection analysis at the 20-min time point. (D) Raw fluorescence signal from the Cas12a reaction over 1 h for the 18S rDNA target. Mean raw fluorescence values (arbitrary units, AU) ± SD are plotted as lines with error bars (n = 9). (E) The data in (D) were normalized to the fluorescence of the NTC1 (PCR blank) and expressed as a fluorescence ratio. (F) The normalized data in (E) were used for detection analysis at the 10-min time point. For (C,F), pairwise comparisons to the NTC2 (PCR blank) were done using an unpaired t-test. Two-tailed p values are shown; non-significant p values (p > 0.05) are indicated by ns.

References

    1. Adams E. R., Gomez M. A., Scheske L., Rios R., Marquez R., Cossio A., et al. . (2014). Sensitive diagnosis of cutaneous leishmaniasis by lesion swab sampling coupled to qPCR. Parasitology 141, 1891–1897. doi: 10.1017/S0031182014001280, PMID: - DOI - PMC - PubMed
    1. Adams E. R., Schoone G. J., Ageed A. F., Safi S. E., Schallig H. D. F. H. (2010). Development of a reverse transcriptase loop-mediated isothermal amplification (LAMP) assay for the sensitive detection of Leishmania parasites in clinical samples. Am. J. Trop. Med. Hyg. 82, 591–596. doi: 10.4269/ajtmh.2010.09-0369, PMID: - DOI - PMC - PubMed
    1. Adams E. R., Schoone G., Versteeg I., Gomez M. A., Diro E., Mori Y., et al. . (2018). Development and evaluation of a novel loop-mediated isothermal amplification assay for diagnosis of cutaneous and visceral Leishmaniasis. J. Clin. Microbiol. 56, e00386–18. doi: 10.1128/JCM.00386-18, PMID: - DOI - PMC - PubMed
    1. Adaui V., Lye L.-F., Akopyants N. S., Zimic M., Llanos-Cuentas A., Garcia L., et al. . (2016). Association of the endobiont double-stranded RNA virus LRV1 with treatment failure for human Leishmaniasis caused by Leishmania braziliensis in Peru and Bolivia. J. Infect. Dis. 213, 112–121. doi: 10.1093/infdis/jiv354, PMID: - DOI - PMC - PubMed
    1. Ai J.-W., Zhou X., Xu T., Yang M., Chen Y., He G.-Q., et al. . (2019). CRISPR-based rapid and ultra-sensitive diagnostic test for Mycobacterium tuberculosis. Emerg. Microbes Infect. 8, 1361–1369. doi: 10.1080/22221751.2019.1664939, PMID: - DOI - PMC - PubMed