. 2022 Sep 14:13:935378.
doi: 10.3389/fmicb.2022.935378. eCollection 2022.

Bacterioplankton seasonality in deep high-mountain lakes

Affiliations

Bacterioplankton seasonality in deep high-mountain lakes

Aitziber Zufiaurre et al. Front Microbiol. .

Abstract

Due to global warming, shorter ice cover duration might drastically affect the ecology of lakes currently undergoing seasonal surface freezing. High-mountain lakes show snow-rich ice covers that determine contrasting conditions between ice-off and ice-on periods. We characterized the bacterioplankton seasonality in a deep high-mountain lake ice-covered for half a year. The lake shows a rich core bacterioplankton community consisting of three components: (i) an assemblage stable throughout the year, dominated by Actinobacteria, resistant to all environmental conditions; (ii) an ice-on-resilient assemblage dominating during the ice-covered period, which is more diverse than the other components and includes a high abundance of Verrucomicrobia; the deep hypolimnion constitutes a refuge for many of the typical under-ice taxa, many of which recover quickly during autumn mixing; and (iii) an ice-off-resilient assemblage, which members peak in summer in epilimnetic waters when the rest decline, characterized by a dominance of Flavobacterium, and Limnohabitans. The rich core community and low random elements compared to other relatively small cold lakes can be attributed to its simple hydrological network in a poorly-vegetated catchment, the long water-residence time (ca. 4 years), and the long ice-cover duration; features common to many headwater deep high-mountain lakes.

Keywords: Actinobacteria hgcl_clade; Flavobacterium; Limnohabitans; Verrucomicrobia; bacteria coexistence; core community; microbial ecology; under-ice ecology.


Conflict of interest statement

The authors declare that the research was conducted in the absence of any commercial or financial relationships that could be construed as a potential conflict of interest.

Figures

Figure 1
Figure 1
Seasonal changes in Lake Redon, Pyrenees. (A) Illustration of the snow and ice cover melting period. Photographs: Marc Sala-Faig. (B) Seasonal and depth variation of chlorophyll-a and (C) oxygen. Black circles indicate sampling points and dashed lines the isotherms (°C). The line above each graph indicates the snow and ice-cover thickness in arbitrary units.
Figure 2
Figure 2
Seasonal fluctuations of bacterioplankton number of 16S rRNA gene copies (A) and OTU richness (B) at different depths. Thick black lines at the top of each graph indicate periods of ice cover.
Figure 3
Figure 3
Seasonal difference in bacterioplankton community composition. (A) PCA analyses using Hellinger distance of the bacterioplankton OTUs. Numbers refer to OTUs listed in Supplementary Table S4. There is a seasonal trajectory for the upper layers (2, 10, 20-m depth), whereas variation is lower in the deeper layers (35, 60-m depth). (B) Temporal depth distribution of the bacterioplankton groups was obtained using k-means clustering with Hellinger distance. Dashed lines denote isotherms. Circles indicate sampling points, and the color corresponds to each of the six clusters: UI (under-ice), TH (thaw and hypolimnion), ES (early stratification), EP (epilimnion), OE (overturn and early under-ice), and DL (deep layers). The line above the graph indicates the snow and ice-cover thickness in arbitrary units. (C) The best number of k-means groups was assessed by maximizing the total indicative value (IndVal) of the significant OTUs at each partition.
Figure 4
Figure 4
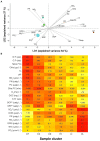
Characteristics of the bacterial seasonal clusters’ environment. (A) Bacterioplankton clusters in a discriminant environmental space. Clusters: UI (under-ice), TH (thaw and hypolimnion), ES (early stratification), EP (epilimnion), OE (overturn and early under-ice), and DL (deep layer). The symbol size of each cluster is proportional to the number of samples included. (B) Heat map indicating the average environmental conditions for each bacterioplankton seasonal cluster. The average cluster values clusters indicated within the boxes, and colors indicate the relative rank among clusters, from the highest (red) to the lowest (pale yellow). The variables are sorted according to their loading in the first axis of the discriminant analysis (A), with the lowest p-values at both extremes and the less relevant variables in the middle. The asterisk (*) indicates no significance in the discriminant analysis.
Figure 5
Figure 5
Indicator taxa of seasonal clusters. OTUs are ranked according to their significant indicator values. Colors indicate the taxonomic class. The number of indicator OTUs and classes (parenthesis) are indicated below the x-axis.
Figure 6
Figure 6
Patterns of occurrence and seasonality in the bacterioplankton community. (A) OTUs ranked by occurrence in the samples. Colors specify cluster indicators: UI (under-ice), TH (thaw and hypolimnion), ES (early stratification), EP (epilimnion), OE (overturn and early under-ice), and DL (deep layer). (B) Comparison of the OTU indicator values with the OTU’s mean and maximum abundance ratio in the samples. A larger ratio indicates flatter seasonal OTU profiles, that is, lower occasional blooming. The symbol size is proportional to OTU occurrence. The inserted plots show examples of the OTU abundance’s time series at each sampling depth (line colors as in Figure 2). Arrows indicate the corresponding OTU in the larger plot.

References

    1. Achberger A. M., Christner B. C., Michaud A. B., Priscu J. C., Skidmore M. L., Vick-Majors T. J., et al. (2019). rworldmap: a new R package for mapping global data. Front. Microbiol. 3:417. doi: 10.3389/fmicb.2012.00417, PMID: - DOI - PMC - PubMed
    1. Aguilar P., Sommaruga R. (2020). The balance between deterministic and stochastic processes in structuring lake bacterioplankton community over time. Mol. Ecol. 29, 3117–3130. doi: 10.1111/mec.15538, PMID: - DOI - PMC - PubMed
    1. Allison S. D., Martiny J. B. H. (2008). Resistance, resilience, and redundancy in microbial communities. Proc. Natl. Acad. Sci. U. S. A. 105, 11512–11519. doi: 10.1073/pnas.0801925105, PMID: - DOI - PMC - PubMed
    1. Alonso-Sáez L., Gasol J. M., Lefort T., Hofer J., Sommaruga R. (2006). Effect of natural sunlight on bacterial activity and differential sensitivity of natural bacterioplankton groups in northwestern Mediterranean coastal waters. Appl. Environ. Microbiol. 72, 5806–5813. doi: 10.1128/AEM.00597-06, PMID: - DOI - PMC - PubMed
    1. Ballen-Segura M., Felip M., Catalan J. (2017). Some mixotrophic flagellate species selectively graze on Archaea. Appl. Environ. Microbiol. 83, e02317–e02316. doi: 10.1128/AEM.02317-16, PMID: - DOI - PMC - PubMed

LinkOut - more resources