

A cuproptosis-related lncRNA signature identified prognosis and tumour immune microenvironment in kidney renal clear cell carcinoma
- PMID: 36188220
- PMCID: PMC9515514
- DOI: 10.3389/fmolb.2022.974722
A cuproptosis-related lncRNA signature identified prognosis and tumour immune microenvironment in kidney renal clear cell carcinoma
Abstract
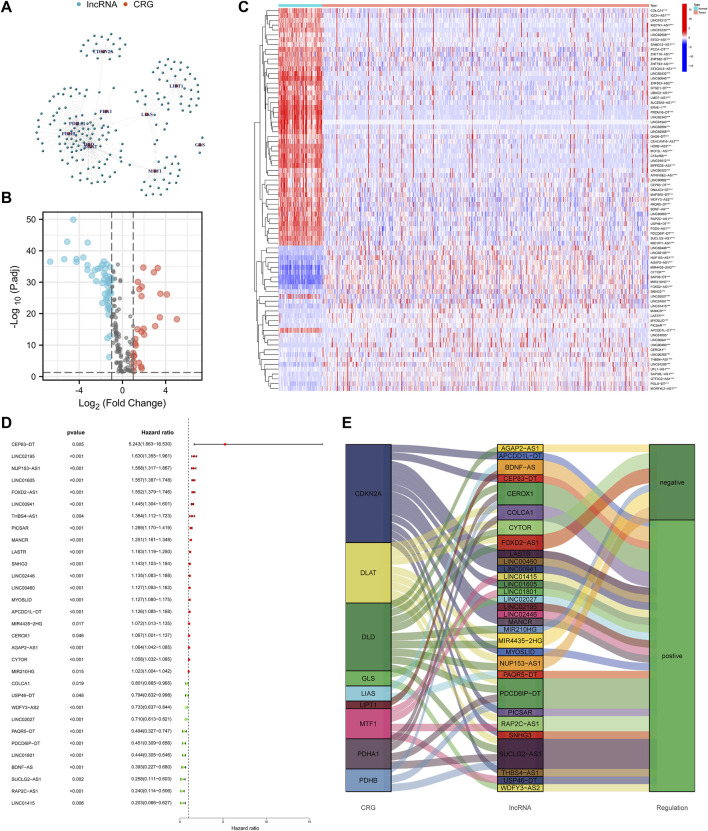
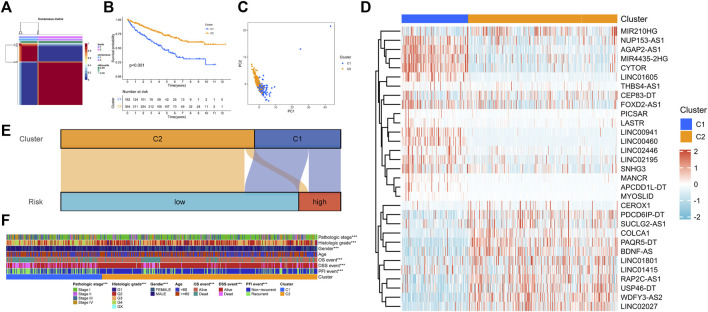
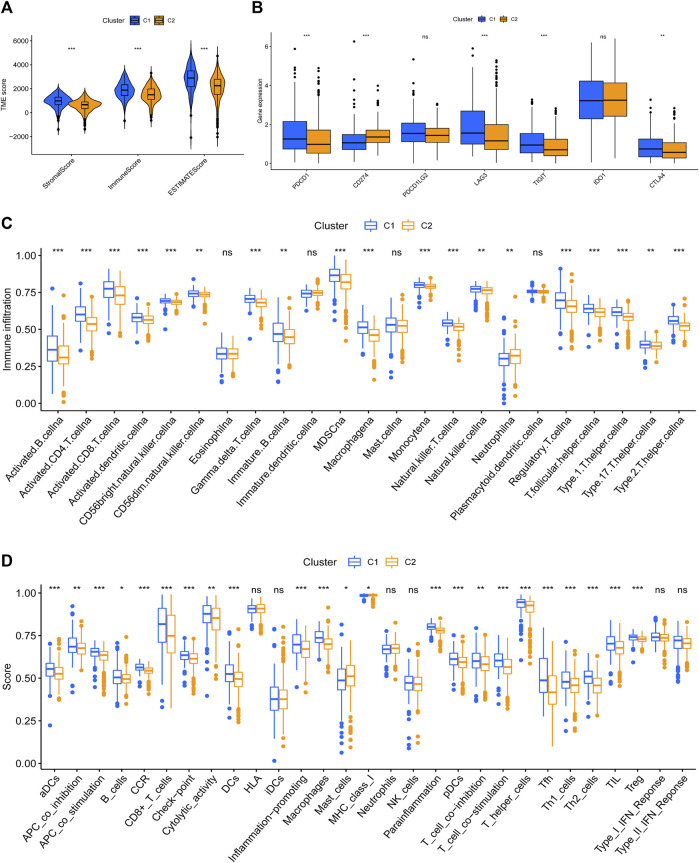
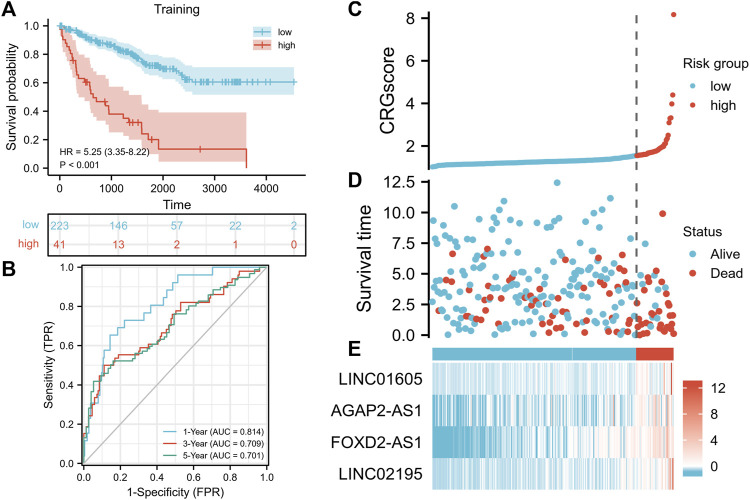
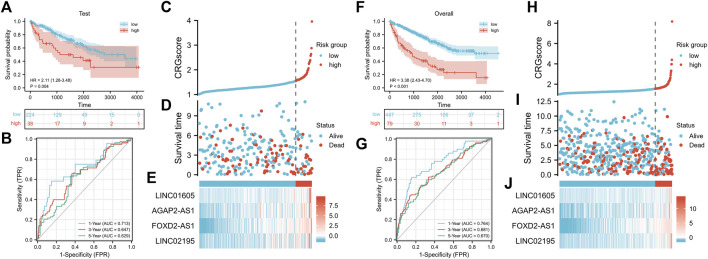
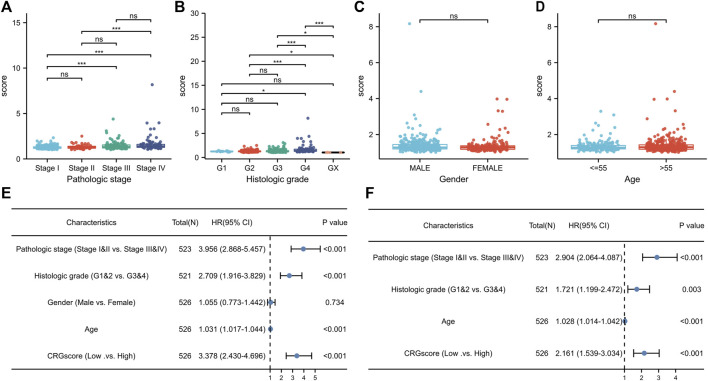
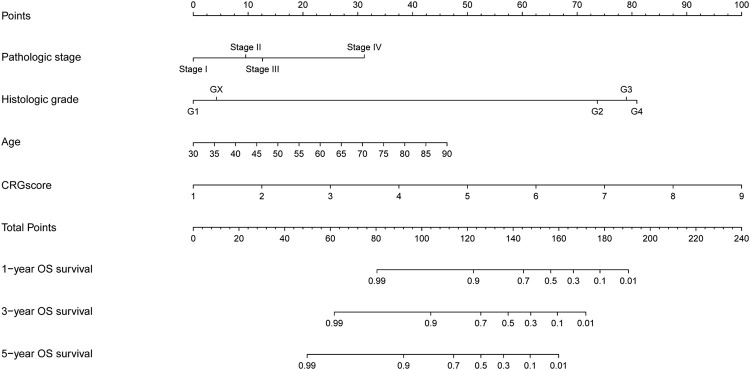
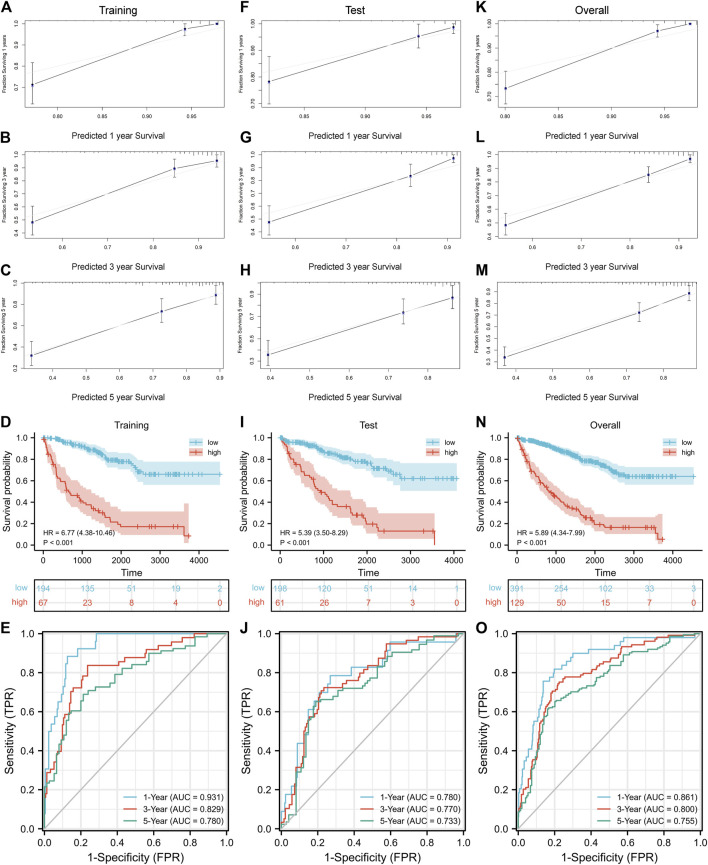
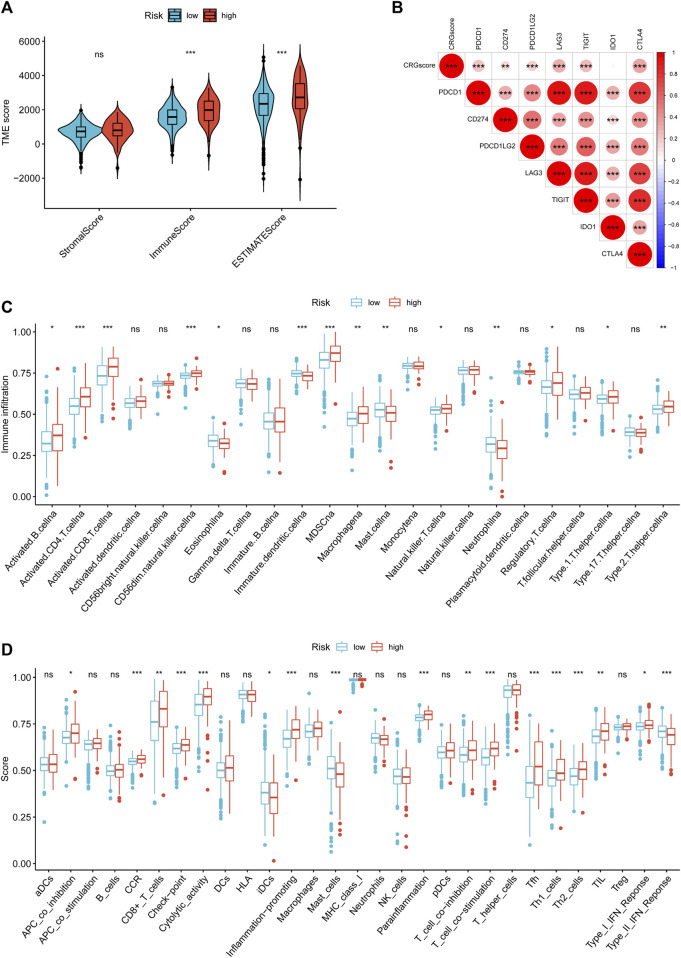
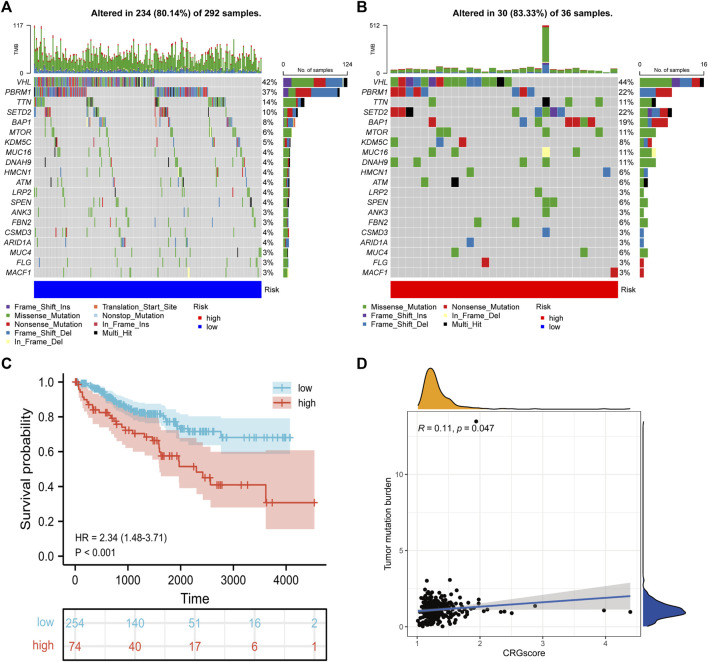
Kidney renal clear cell carcinoma (KIRC) is a heterogeneous malignant tumor with high incidence, metastasis, and mortality. The imbalance of copper homeostasis can produce cytotoxicity and cause cell damage. At the same time, copper can also induce tumor cell death and inhibit tumor transformation. The latest research found that this copper-induced cell death is different from the known cell death pathway, so it is defined as cuproptosis. We included 539 KIRC samples and 72 normal tissues from the Cancer Genome Atlas (TCGA) in our study. After identifying long non-coding RNAs (lncRNAs) significantly associated with cuproptosis, we clustered 526 KIRC samples based on the prognostic lncRNAs and obtained two different patterns (Cuproptosis.C1 and C2). C1 indicated an obviously worse prognostic outcome and possessed a higher immune score and immune cell infiltration level. Moreover, a prognosis signature (CRGscore) was constructed to effectively and accurately evaluate the overall survival (OS) of KIRC patients. There were significant differences in tumor immune microenvironment (TIME) and tumor mutation burden (TMB) between CRGscore-defined groups. CRGscore also has the potential to predict medicine efficacy.
Keywords: cuproptosis; kidney renal clear cell carcinoma; lncRNAs; prognostic signature; tumor immune microenvironment.
Copyright © 2022 Xin, Mao, Cui, Li, Chen, Li, Tu, Liu, Wang, Wang, Liu, Song and Song.
Conflict of interest statement
The authors declare that the research was conducted in the absence of any commercial or financial relationships that could be construed as a potential conflict of interest.
Figures


Similar articles
-
Clinical significance and immune landscape of cuproptosis-related lncRNAs in kidney renal clear cell carcinoma: a bioinformatical analysis.Ann Transl Med. 2022 Nov;10(22):1235. doi: 10.21037/atm-22-5204. Ann Transl Med. 2022. PMID: 36544675 Free PMC article.
-
Prognostic value and immunological characteristics of a novel cuproptosis-related long noncoding RNAs risk signature in kidney renal clear cell carcinoma.Front Genet. 2022 Nov 3;13:1009555. doi: 10.3389/fgene.2022.1009555. eCollection 2022. Front Genet. 2022. PMID: 36406128 Free PMC article.
-
Novel cuproptosis-related long non-coding RNA signature to predict prognosis in prostate carcinoma.BMC Cancer. 2023 Jan 30;23(1):105. doi: 10.1186/s12885-023-10584-0. BMC Cancer. 2023. PMID: 36717792 Free PMC article. Clinical Trial.
-
Identification and Validation of Cuproptosis-Related LncRNA Signatures in the Prognosis and Immunotherapy of Clear Cell Renal Cell Carcinoma Using Machine Learning.Biomolecules. 2022 Dec 16;12(12):1890. doi: 10.3390/biom12121890. Biomolecules. 2022. PMID: 36551318 Free PMC article.
-
The potential of targeting cuproptosis in the treatment of kidney renal clear cell carcinoma.Biomed Pharmacother. 2023 Nov;167:115522. doi: 10.1016/j.biopha.2023.115522. Epub 2023 Sep 25. Biomed Pharmacother. 2023. PMID: 37757497 Review.
Cited by
-
Cuproptosis-Related MiR-21-5p/FDX1 Axis in Clear Cell Renal Cell Carcinoma and Its Potential Impact on Tumor Microenvironment.Cells. 2022 Dec 31;12(1):173. doi: 10.3390/cells12010173. Cells. 2022. PMID: 36611966 Free PMC article.
-
Comprehensive analysis of the role of cuproptosis-related genes in the prognosis and immune infiltration of adrenocortical Carcinoma.Heliyon. 2023 Dec 14;10(1):e23661. doi: 10.1016/j.heliyon.2023.e23661. eCollection 2024 Jan 15. Heliyon. 2023. PMID: 38187219 Free PMC article.
-
Bioinformatics analysis and experimental validation of m6A and cuproptosis-related lncRNA NFE4 in clear cell renal cell carcinoma.Discov Oncol. 2024 May 26;15(1):187. doi: 10.1007/s12672-024-01023-y. Discov Oncol. 2024. PMID: 38797784 Free PMC article.
-
Non-coding transcriptome profiles in clear-cell renal cell carcinoma.Nat Rev Urol. 2025 Mar;22(3):151-174. doi: 10.1038/s41585-024-00926-3. Epub 2024 Sep 6. Nat Rev Urol. 2025. PMID: 39242964 Review.
-
A novel signature of cuproptosis-related lncRNAs predicts prognosis in glioma: Evidence from bioinformatic analysis and experiments.Front Pharmacol. 2023 Apr 10;14:1158723. doi: 10.3389/fphar.2023.1158723. eCollection 2023. Front Pharmacol. 2023. PMID: 37101543 Free PMC article.
References
LinkOut - more resources
Full Text Sources
Miscellaneous