

Activated Glassy Carbon Electrode as an Electrochemical Sensing Platform for the Determination of 4-Nitrophenol and Dopamine in Real Samples
- PMID: 36188318
- PMCID: PMC9520556
- DOI: 10.1021/acsomega.2c03427
Activated Glassy Carbon Electrode as an Electrochemical Sensing Platform for the Determination of 4-Nitrophenol and Dopamine in Real Samples
Abstract
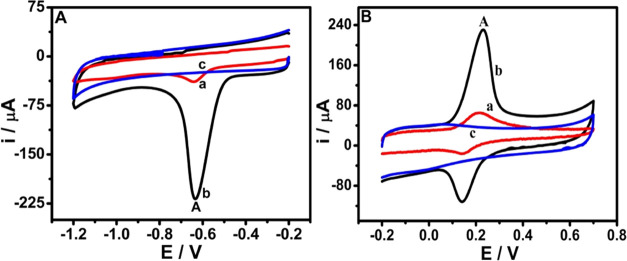
Glassy carbon electrode (GCE) was electrochemically activated using a repetitive cyclic voltammetric technique to develop an activated glassy carbon electrode (AGCE). The developed AGCE was optimized and utilized for the electrochemical assay of 4-nitrophenol (4-NP) and dopamine (DA). Cyclic voltammetry (CV) was employed to investigate the electrochemical behavior of the AGCE. Compared to the bare GCE, the developed AGCE exhibits a significant increase in redox peak currents of 4-NP and DA, which indicates that the AGCE significantly improves the electrocatalytic reduction of 4-NP and oxidation of DA. The electrochemical signature of the activation process could be directly associated with the formation of oxygen-containing surface functional groups (OxSFGs), which are the main reason for the improved electron transfer ability and the enhancement of the electrocatalytic activity of the AGCE. The effects of various parameters on the voltammetric responses of the AGCE toward 4-NP and DA were studied and optimized, including the pH, scan rate, and accumulation time. Differential pulse voltammetry (DPV) was also utilized to investigate the analytical performance of the AGCE sensing platform. The optimized AGCE exhibited linear responses over the concentration ranges of 0.04-65 μM and 65-370 μM toward 4-NP with a lower limit of detection (LOD) of 0.02 μM (S/N = 3). Additionally, the AGCE exhibited a linear responses over the concentration ranges of 0.02-1.0 and 1.0-100 μM toward DA with a lower limit of detection (LOD) of 0.01 μM (S/N = 3). Moreover, the developed AGCE-based 4-NP and DA sensors are distinguished by their high sensitivity, excellent selectivity, and repeatability. The developed sensors were successfully applied for the determination of 4-NP and DA in real samples with satisfactory recovery results.
© 2022 The Authors. Published by American Chemical Society.
Conflict of interest statement
The authors declare no competing financial interest.
Figures


References
-
- Craievich A. On the structure of glassy carbon. Mater. Res. Bull. 1976, 11, 1249–1255. 10.1016/0025-5408(76)90029-5. - DOI
-
- Fagan D. T.; Hu I. F.; Kuwana T. Vacuum heat-treatment for activation of glassy carbon electrodes. Anal. Chem. 1985, 57, 2759–2763. 10.1021/ac00291a006. - DOI
-
- Bowling R. J.; Packard R. T.; McCreery R. L. Activation of highly ordered pyrolytic graphite for heterogeneous electron transfer: relationship between electrochemical performance and carbon microstructure. J. Am. Chem. Soc. 1989, 111, 1217–1223. 10.1021/ja00186a008. - DOI
LinkOut - more resources
Full Text Sources
Miscellaneous
