. 2022 Sep 15:13:926446.
doi: 10.3389/fimmu.2022.926446. eCollection 2022.

The role of mucosal-associated invariant T cells in visceral leishmaniasis

Affiliations

The role of mucosal-associated invariant T cells in visceral leishmaniasis

Marcela de Lima Moreira et al. Front Immunol. .

Abstract

Mucosal-associated invariant T (MAIT) cells are restricted by MR1 and are known to protect against bacterial and viral infections. Our understanding of the role of MAIT cells in parasitic infections, such as visceral leishmaniasis (VL) caused by protozoan parasites of Leishmania donovani, is limited. This study showed that in response to L. infantum, human peripheral blood MAIT cells from children with leishmaniasis produced TNF and IFN-γ in an MR1-dependent manner. The overall frequency of MAIT cells was inversely correlated with alanine aminotransferase levels, a specific marker of liver damage strongly associated with severe hepatic involvement in VL. In addition, there was a positive correlation between total protein levels and the frequency of IL-17A+ CD8+ MAIT cells, whereby reduced total protein levels are a marker of liver and kidney damage. Furthermore, the frequencies of IFN-γ+ and IL-10+ MAIT cells were inversely correlated with hemoglobin levels, a marker of severe anemia. In asymptomatic individuals and VL patients after treatment, MAIT cells also produced IL-17A, a cytokine signature associated with resistance to visceral leishmaniasis, suggesting that MAIT cells play important role in protecting against VL. In summary, these results broaden our understanding of MAIT-cell immunity to include protection against parasitic infections, with implications for MAIT-cell-based therapeutics and vaccines. At last, this study paves the way for the investigation of putative MAIT cell antigens that could exist in the context of Leishmania infection.

Keywords: IFN-γ+ MAIT; IL-17+MAIT; Leishmania; MAIT; MR1; TNF+MAIT; anti-parasitic activity.


Conflict of interest statement

JM, ZC, and SE are inventor of patents describing MR1 antigens and MR1 tetramers. The remaining authors declare that the research was conducted in the absence of any commercial or financial relationships that could be construed as a potential conflict of interest.

Figures

Figure 1
Figure 1
Frequency and profile of MAIT cell subsets in samples from children with visceral leishmaniasis. Multicolor flow cytometric analyses of TRAV1-2+CD161high T-cells in peripheral whole blood samples of children with visceral leishmaniasis (VL = 14), asymptomatic carriers (AS = 18), and endemic non-infected controls (NI = 15). (A) Representative flow cytometric pseudocolor plots of NI, AS, and VL samples showing the gating strategy to identify TRAV1-2+CD161high T-cells (referred to here as MAIT cells) and contour plots of CD8+ versus CD8- TRAV1-2+CD161high T-cells. (B) Scatter plot distribution of individual values with the median lines of the frequencies (%) of total CD3+ cells – MAIT cells (TRAV1-2+CD161high), and CD8α-, and CD8α+ MAIT-cell subsets in NI, Leish (AS+VL), AS, and VL samples. Significant differences amongst groups (p < 0.05) based on the Mann-Whitney test for comparing two groups are indicated by connecting lines and asterisks (*p ≤ 0.05). (C) Pie charts displaying the mean proportions of MAIT cells (black), non-MAIT (TRAV1-2- CD161low/-) CD8- T-cells (light grey), non-MAIT CD8+ T-cells (dark grey), and other CD161+ T-cells (mid-grey) in peripheral blood amongst VL, AS, and NI samples. (D) Linear regression analyses for MAIT cell frequency according to the age group for VL (continuous line), AS (dashed line), and NI (dotted line), assessing the impact of age on the percentage of circulating TRAV1-2+ CD161high T-cell subsets.
Figure 2
Figure 2
In vitro stimulation of MAIT cells from samples of children with asymptomatic and active visceral leishmaniasis. Plasma-depleted peripheral whole-blood samples of children with visceral leishmaniasis (VL = 14), asymptomatic carriers (AS = 18), and endemic non-infected controls (NI = 15), as in Figure 1 , were short-term incubated with promastigotes with (Li+αMR1) or without (Li) MR1 blocking antibody and the expression of intracellular cytokine, as well as a surface activation marker, were evaluated. Significant differences amongst groups (p<0.05) based on the Mann-Whitney test for comparing two groups are indicated by connecting lines and asterisks (*p ≤ 0.05; **p ≤ 0.01). (A) Representative flow cytometry pseudocolor dot plots (large dots) showing gating of cytokine+ MAIT cells after in vitro culture – control (CC), Li and Li + αMR1. (B) Scattering distribution of individual values with the median lines showing the proportion of MAIT cells expressing TNF, IFN-γ, IL-17A, and IL-10 and CD69 expression (geometric mean fluorescence intensity-gMFI) as a marker of activation in all samples pooled together (NI, AS and VL) in CC, Li, and Li+αMR1 cultures. (C) Scattering distribution of individual values with the median lines showing the proportion of MAIT cells expressing TNF, IFN-γ, IL-17A and IL-10 in NI, AS, and VL samples for CC, Li and Li + αMR1 cultures. The number samples included in the Li + αMR1 condition for asymptomatic carriers and endemic non-infected controls groups was AS = 5 and NI = 7. (D) Scattering distribution of individual values with the median lines of CD69 expression (gMFI) ex vivo by MAIT cells, CD8α- and CD8α+ MAIT cells in NI, Leish, AS, and VL samples for control cultures (CC). (E) Representative flow cytometry histograms of CD69 expression in NI, AS, and VL samples, and box and whiskers plot with quartiles, median, and min to max values of the CD69 expression (gMFI) by MAIT cells in NI, AS, and VL samples after in vitro cultures CC, Li, and Li+αMR1.
Figure 3
Figure 3
Aspects of the MAIT cell profile are associated with biochemical and clinical findings related to the severity of visceral leishmaniasis. (A) Scattering distribution of individual values over box plots underscoring the median values, interquartile ranges along with min to max values of each biochemical liver biomarker (evaluated using standard clinical testing) in VL patients compared to reference values (light grey bars). Biochemical markers include aspartate transaminase-AST, alanine transaminase-ALT, alkaline phosphatase-AP, gamma-glutamyl transferase-GGT, total and direct bilirubin, total protein, albumin, creatinine, and hemoglobin-Hb. (B) Heatmap chart displaying the correlation between the phenotype/function of various MAIT cell subsets obtained by fold-changes of Leishmania-infected cultures and the respective control culture (Li/CC) and the biochemical liver biomarkers evaluated for each VL patient. Colors express the intensity of correlation (-1 < R < 1) as defined by the indicated color key. Black bordered squares highlight statistically significant correlations (p < 0.05). (C) Linear regression analysis of the biochemical liver biomarkers according to MAIT cell biomarkers. (D) Scattering distribution of individual values with the median lines of MAIT cell frequency amongst T-cells and CD69 expression (gMFI) in VL patients grouped based on the absence (-) and presence (+) of hepatosplenomegaly. (E) Fold-changes in cytokine expressing MAIT cells. Fold changes were calculated using results of Leishmania-infected cultures and the respective control culture (Li/CC) from VL patients grouped based on the absence (-) and presence (+) of hepatosplenomegaly. Significant differences amongst groups (p<0.05) based on Mann-Whitney test are indicated by connecting lines and asterisks (**p ≤ 0.01).
Figure 4
Figure 4
L. infantum-induced production of proinflammatory cytokines by non-MAIT T-cells. (A) Representative flow cytometry pseudocolor plots showing gating of cytokine+ CD8α- and CD8α+ non- MAIT cells after in vitro culture – CC, Li, and Li+αMR1. (B) Scattering distribution of individual values with the median lines of frequencies (%) of intracellular cytokine-producing non-MAIT CD8- and CD8+ T-cells in all samples (NI, AS and VL), as part of the same experiment displayed in Figure 2B . Significant differences amongst groups (p<0.05) based on the Mann-Whitney test for comparing two groups are indicated by connecting lines and asterisks (*p ≤ 0.05).
Figure 5
Figure 5
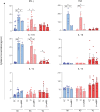
MR1-dependent abrogation of soluble cytokine secretion after short-term in vitro culture with L. infantum. Scattering distribution of individual values over bar charts with a median and interquartile range of TNF, IFN-γ, IL-17A, IL-10, IL-12, and IL-15 after in vitro culture – control (CC), Li, and Li + αMR1. Significant differences amongst groups (p < 0.05) based on the Mann-Whitney test for comparing two groups are indicated by connecting lines and asterisks (*p ≤ 0.05; **p ≤ 0.01).
Figure 6
Figure 6
Impact of leishmanicidal therapy in MAIT cell activation in response to Leishmania. Multicolor flow cytometric analyses of TRAV1-2+CD161high T-cells in peripheral whole blood samples of children with visceral leishmaniasis before (VL-BT) and after (VL-AT) treatment with Glucantime® or Amphotericin B. (A) Representative flow cytometry pseudocolor dot plots showing gating of cytokine+ MAIT cells after in vitro culture in (A) it's Ctr in the panel, Li, and Li + αMR1. (B) Box and whisker plots with quartiles, median, and min to max values showing the proportion of MAIT cells expressing TNF, IFN-γ, IL-17A, and IL-10 in samples from VL-AT children in CC, Li, and Li + αMR1 cultures. (C) Scattering distribution of individual values with the median lines of the frequencies (%) for total CD3+ cells – MAIT cells (TRAV1-2+CD161high) and counts of MAIT cells and non-MAIT cells (TRAV1-2-CD161-), calculated based on lymphocyte differential counts from complete blood counts. (D) Scattering distribution of individual values with the median lines showing the proportion of MAIT cells expressing TNF, IFN-γ, IL-17A, and IL-10 in VL-BT and VL-AT in CC, Li and Li + αMR1 cultures. Significant differences amongst groups (p<0.05) based on the Mann-Whitney test for comparing two groups are indicated by connecting lines and asterisks (*p ≤ 0.05).
Figure 7
Figure 7
MAIT cell activation following in vitro Leishmania infection is dependent on MR1, infection time and dose. (A) Connecting line XY-graph showing the median with range (min and max) of surface-expressed CD69 (gMFI) on TRAV1-2+CD161high (MAIT) cells after in vitro stimulation with L. infantum, according to the time of infection and MOI before 4h incubation with brefeldin. MAIT cells were analyzed using plots similar to the ones shown in Figure 1 . (B) Bar graphs representing the median with range (min and max) of surface CD69 expression (gMFI) and percentage of intracellular TNF-producing MAIT cells in plasma depleted whole-blood samples (healthy donors, n = 5) following in vitro L. infantum stimulation using the conditions highlighted with dashed rectangles in panel A, in the presence or absence of anti-MR1 blocking antibody (clone 26.5). The shaded grey represents the 95% confidence interval from control culture. (C) Flow cytometric dot plots of control (non-infected) and Leishmania-infected THP-1, THP-1.MR1 and THP-1.MR1.K0 cells. (D, E) Representative flow cytometric dot plots showing the gating strategy to identify MAIT cells amongst CD3+ T cells in peripheral blood mononuclear cells from healthy donors after in vitro stimulation with L. donovani based on TRAV1-2+CD161high (D) and 5-OP-RU-MR1 tetramer back-gated for TRAV1-2+ CD161high and CD161low expression before the selection of TNF-producing MAIT cells (E). (F) Bar graph displaying median with range (min and max) of the frequency of intracellular TNF-producing MAIT cells in conditions as indicated, using Leishmania donovani for infection of THP-1 cell lines, co-incubated with PBMCs samples (5 healthy donors). Significant differences (p<0.05), based on the Mann-Whitney test for comparing two groups, are highlighted by connecting lines and asterisks (*p ≤ 0.05; **p ≤ 0.01).

Similar articles

Cited by

References

    1. Martin E, Treiner E, Duban L, Guerri L, Laude H, Toly C, et al. . Stepwise development of MAIT cells in mouse and human. PloS Biol (2009) 7:525–36. doi: 10.1371/journal.pbio.1000054 - DOI - PMC - PubMed
    1. Dusseaux M, Martin E, Serriari N, Péguillet I, Premel V, Louis D, et al. . Human MAIT cells are xenobiotic-resistant, tissue-targeted, CD161hi IL-17–secreting T cells. Blood (2011) 117:1250–9. doi: 10.1182/blood-2010-08-303339 - DOI - PubMed
    1. Porcelli S, Yockey CE, Brenner MB, Balk SP. Analysis of T cell antigen receptor (TCR) expression by human peripheral blood CD4-8- alpha/beta T cells demonstrates preferential use of several V beta genes and an invariant TCR alpha chain. J Exp Med (1993) 178:1–16. doi: 10.1084/jem.178.1.1 - DOI - PMC - PubMed
    1. Tilloy F, Treiner E, Park S-H, Garcia C, Lemonnier F, de la Salle H, et al. . An invariant T cell receptor α chain defines a novel TAP-independent major histocompatibility complex class ib–restricted α/β T cell subpopulation in mammals. J Exp Med (1999) 189:1907–21. doi: 10.1084/jem.189.12.1907 - DOI - PMC - PubMed
    1. Reantragoon R, Corbett AJ, Sakala IG, Gherardin NA, Furness JB, Chen Z, et al. . Antigen-loaded MR1 tetramers define T cell receptor heterogeneity in mucosal-associated invariant T cells. J Exp Med (2013) 210:2305–20. doi: 10.1084/jem.20130958 - DOI - PMC - PubMed

Publication types