

m6A methylation regulators as predictors for treatment of advanced urothelial carcinoma with anti-PDL1 agent
- PMID: 36189296
- PMCID: PMC9521425
- DOI: 10.3389/fimmu.2022.1014861
m6A methylation regulators as predictors for treatment of advanced urothelial carcinoma with anti-PDL1 agent
Abstract
Purpose: Immune checkpoint blockade agents were shown to provide a survival advantage in urothelial carcinoma, while some patients got minimal benefit or side effects. Therefore, we aimed to investigate the prognostic value of m6A methylation regulators, and developed a nomogram for predicting the response to atezolizumab in urothelial carcinoma patients.
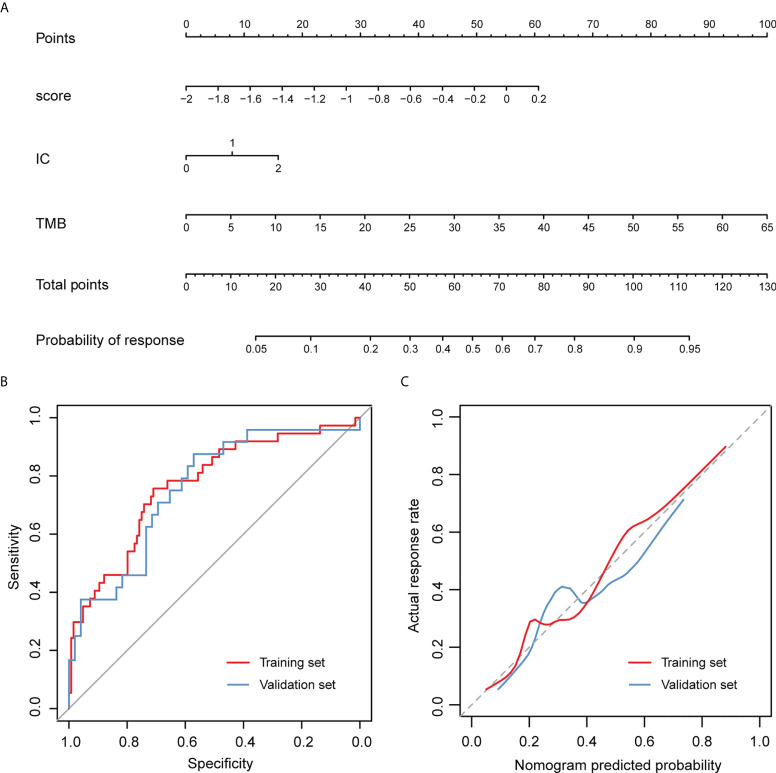
Methods: A total of 298 advanced urothelial carcinoma patients with response data in the IMvigor210 cohort were included. Differential expressions of 23 m6A methylation regulators in different treatment outcomes were conducted. Subsequently, a gene signature was developed in the training set using the least absolute shrinkage and selection operator (LASSO) regression. Based on the multivariable logistic regression, a nomogram was constructed by incorporating the gene signature and independent clinicopathological predictors. The performance of the nomogram was assessed by its discrimination, calibration, and clinical utility with internal validation.
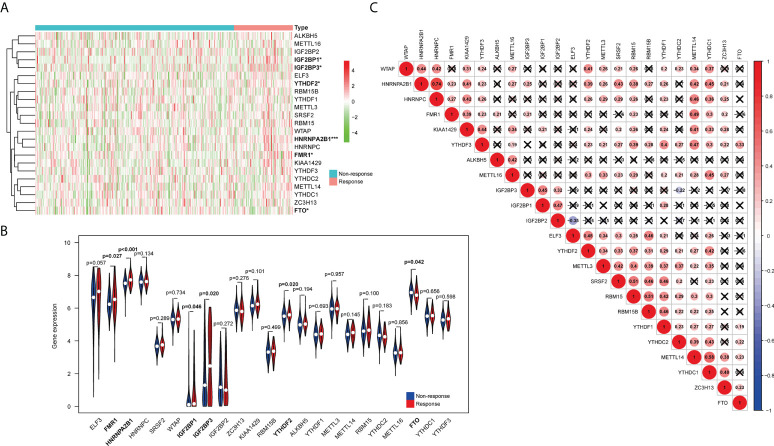
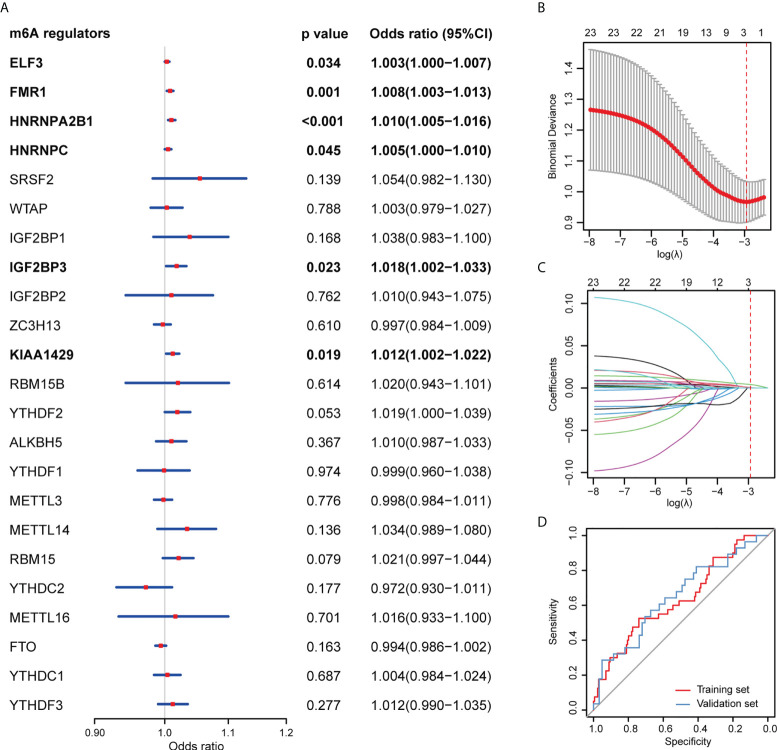
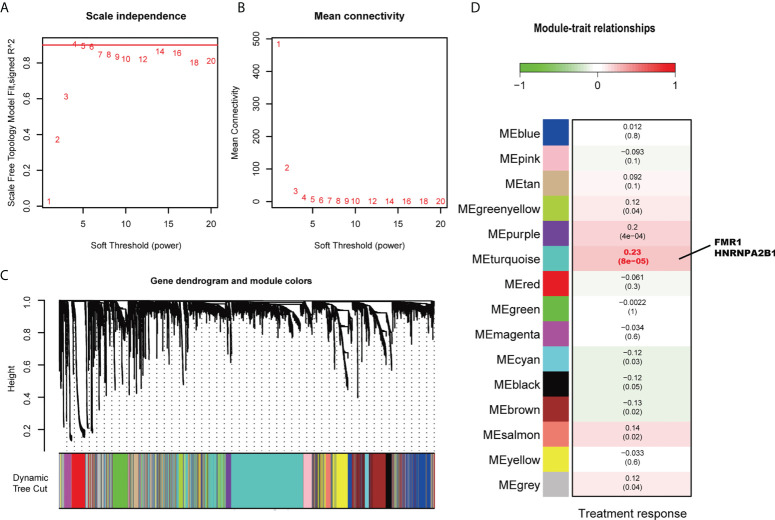
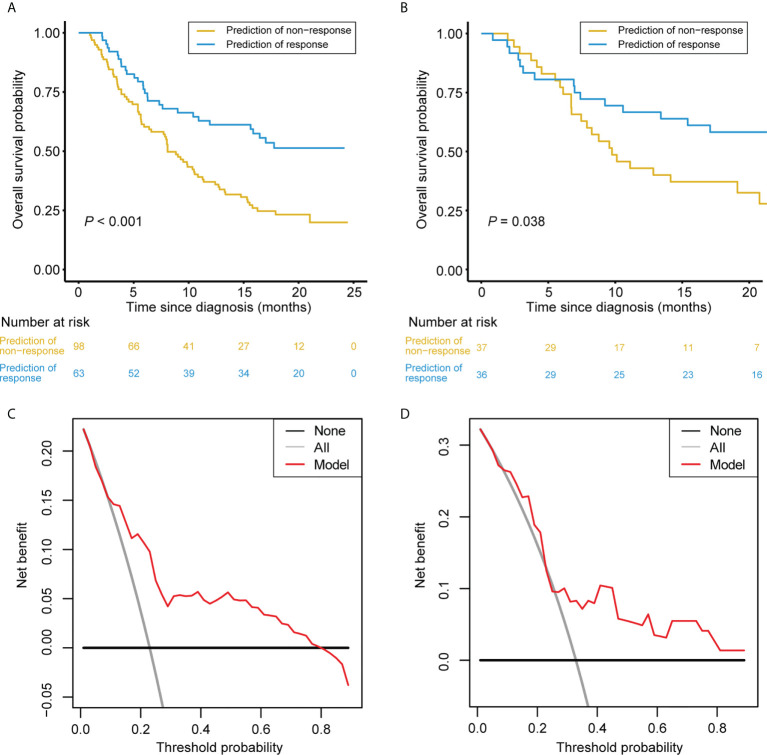
Results: Six m6A methylation regulators, including IGF2BP1, IGF2BP3, YTHDF2, HNRNPA2B1, FMR1, and FTO, were significantly differentially expressed between the responders and non-responders. These six regulators were also significantly correlated with the treatment outcomes. Based on the LASSO regression analysis, the gene signature consisting of two selected m6A methylation regulators (FMR1 and HNRNPA2B1) was constructed and showed favorable discrimination. The nomogram integrating the gene signature, TMB, and PD-L1 expression on immune cells, showed favorable calibration and discrimination in the training set (AUC 0.768), which was confirmed in the validation set (AUC 0.755). Decision curve analysis confirmed the potential clinical usefulness of the nomogram.
Conclusions: This study confirmed the prognostic value of FMR1 and HNRNPA2B1, and constructed a nomogram for individualized prediction of the response to atezolizumab in patients with urothelial carcinoma, which may aid in making treatment strategies.
Keywords: PD1/PDL1; m6A methylation regulators; outcome; prediction; urothelial carcinoma.
Copyright © 2022 Kong, Lu, Zhang, Yao, Zhang, Shen, Luo, Liu, Zheng and Lin.
Conflict of interest statement
The authors declare that the research was conducted in the absence of any commercial or financial relationships that could be construed as a potential conflict of interest.
Figures
Similar articles
-
Comprehensive Analysis of PD-L1 Expression, Immune Infiltrates, and m6A RNA Methylation Regulators in Esophageal Squamous Cell Carcinoma.Front Immunol. 2021 May 12;12:669750. doi: 10.3389/fimmu.2021.669750. eCollection 2021. Front Immunol. 2021. PMID: 34054840 Free PMC article.
-
A new m6A methylation-related gene signature for prognostic value in patient with urothelial carcinoma of the bladder.Biosci Rep. 2021 Apr 30;41(4):BSR20204456. doi: 10.1042/BSR20204456. Biosci Rep. 2021. PMID: 33779704 Free PMC article.
-
Comprehensive Analysis of N6-Methyladenosine RNA Methylation Regulators in the Diagnosis and Subtype Classification of Acute Myocardial Infarction.J Immunol Res. 2022 Aug 24;2022:5173761. doi: 10.1155/2022/5173761. eCollection 2022. J Immunol Res. 2022. PMID: 36061306 Free PMC article.
-
Molecular predictors of response to PD-1/PD-L1 inhibition in urothelial cancer.World J Urol. 2019 Sep;37(9):1773-1784. doi: 10.1007/s00345-018-2538-6. Epub 2018 Oct 29. World J Urol. 2019. PMID: 30374610 Review.
-
[Atezolizumab (Tecentriq®): Activity, indication and modality of use in advanced or metastatic urinary bladder carcinoma].Bull Cancer. 2018 Feb;105(2):140-145. doi: 10.1016/j.bulcan.2017.10.030. Epub 2017 Dec 28. Bull Cancer. 2018. PMID: 29290331 Review. French.
Cited by
-
The Potential Impact of HNRNPA2B1 on Human Cancers Prognosis and Immune Microenvironment.J Immunol Res. 2024 Sep 5;2024:5515307. doi: 10.1155/2024/5515307. eCollection 2024. J Immunol Res. 2024. PMID: 39268079 Free PMC article.
-
The role of RNA binding proteins in cancer biology: A focus on FMRP.Genes Dis. 2024 Dec 21;12(4):101493. doi: 10.1016/j.gendis.2024.101493. eCollection 2025 Jul. Genes Dis. 2024. PMID: 40271197 Free PMC article. Review.
-
The prognostic significance of FMR1 expression and its immunomodulatory implications in esophageal carcinoma.Am J Clin Exp Immunol. 2025 Feb 25;14(1):14-22. doi: 10.62347/XVFP6530. eCollection 2025. Am J Clin Exp Immunol. 2025. PMID: 40134827 Free PMC article.
-
RNA modifications in cancer.MedComm (2020). 2025 Jan 10;6(1):e70042. doi: 10.1002/mco2.70042. eCollection 2025 Jan. MedComm (2020). 2025. PMID: 39802639 Free PMC article. Review.
-
Bladder Cancer Growth is Inhibited by Upregulating CircFUT8 through the METTL14/FMR1 Signaling Pathway.Cell Biochem Biophys. 2025 Jun 10. doi: 10.1007/s12013-025-01794-3. Online ahead of print. Cell Biochem Biophys. 2025. PMID: 40493341
References
Publication types
MeSH terms
Substances
LinkOut - more resources
Full Text Sources
Medical
Research Materials
Miscellaneous