. 2022 Oct 3;132(19):e159229.
doi: 10.1172/JCI159229.

Reprogramming alveolar macrophage responses to TGF-β reveals CCR2+ monocyte activity that promotes bronchiolitis obliterans syndrome

Affiliations

Reprogramming alveolar macrophage responses to TGF-β reveals CCR2+ monocyte activity that promotes bronchiolitis obliterans syndrome

Zhiyi Liu et al. J Clin Invest. .

Abstract

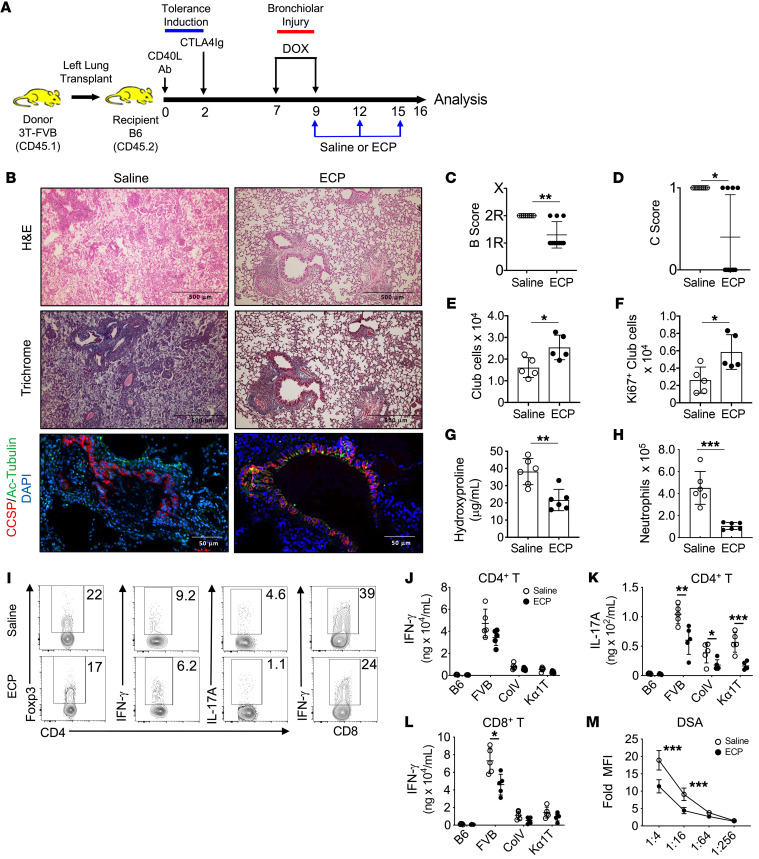
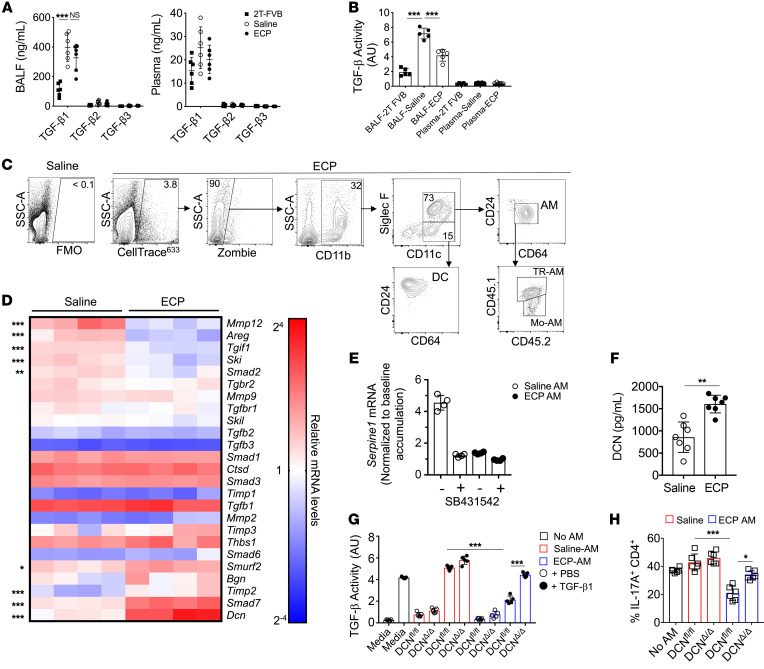
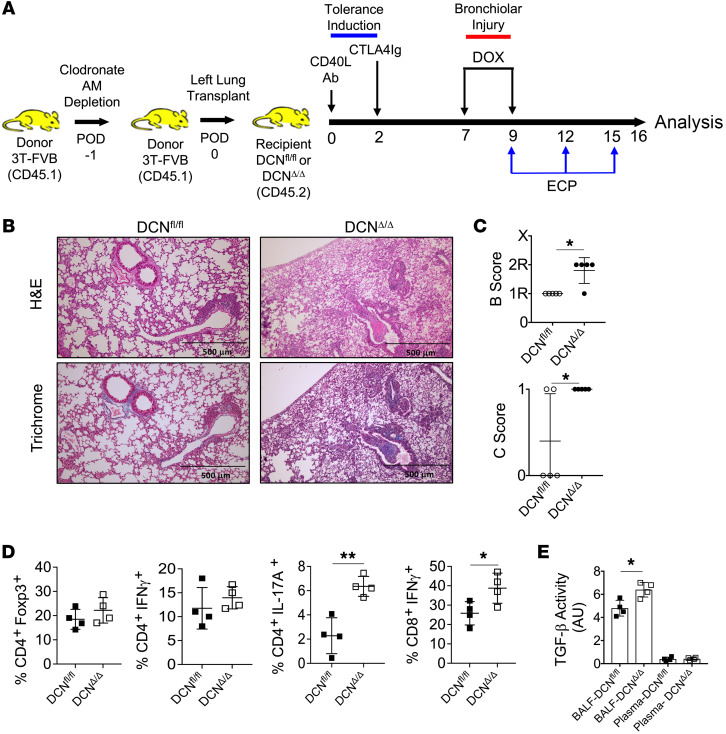
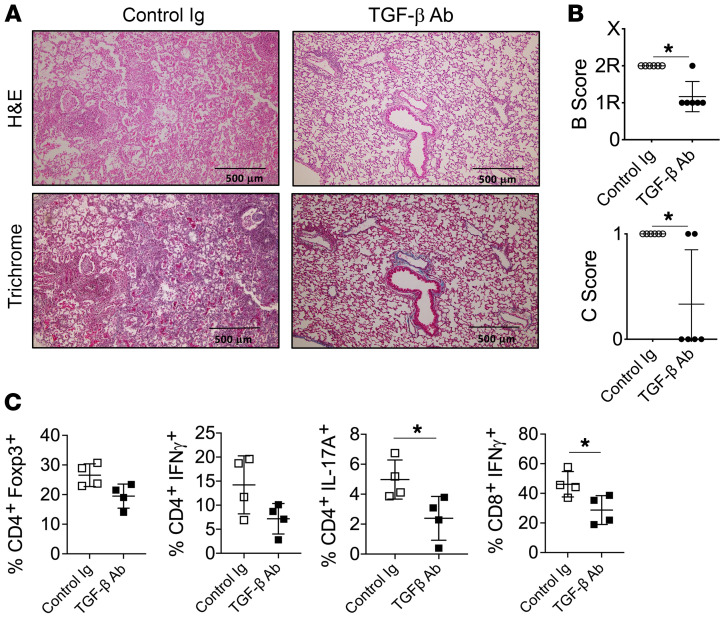
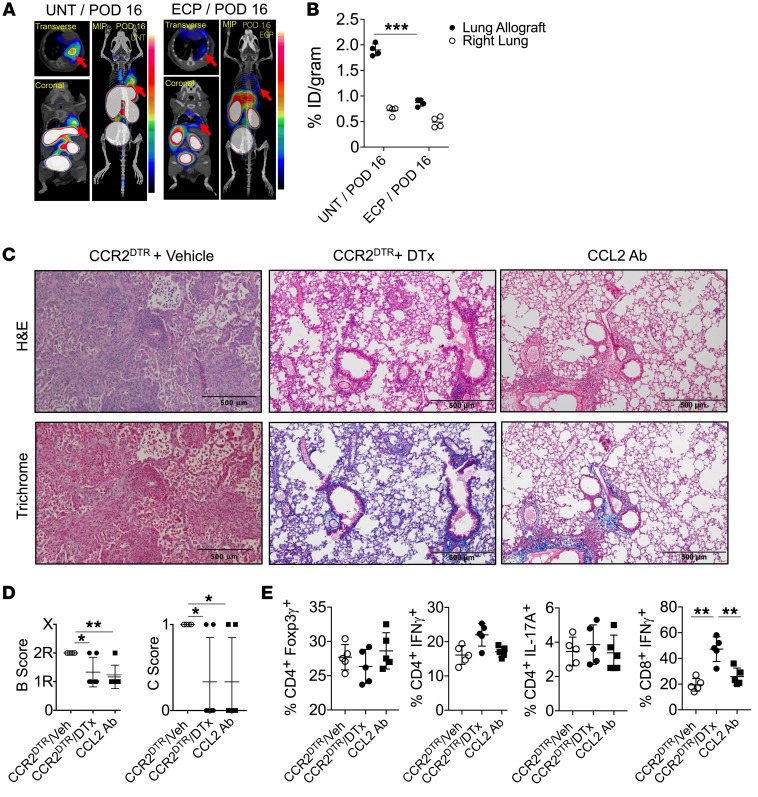
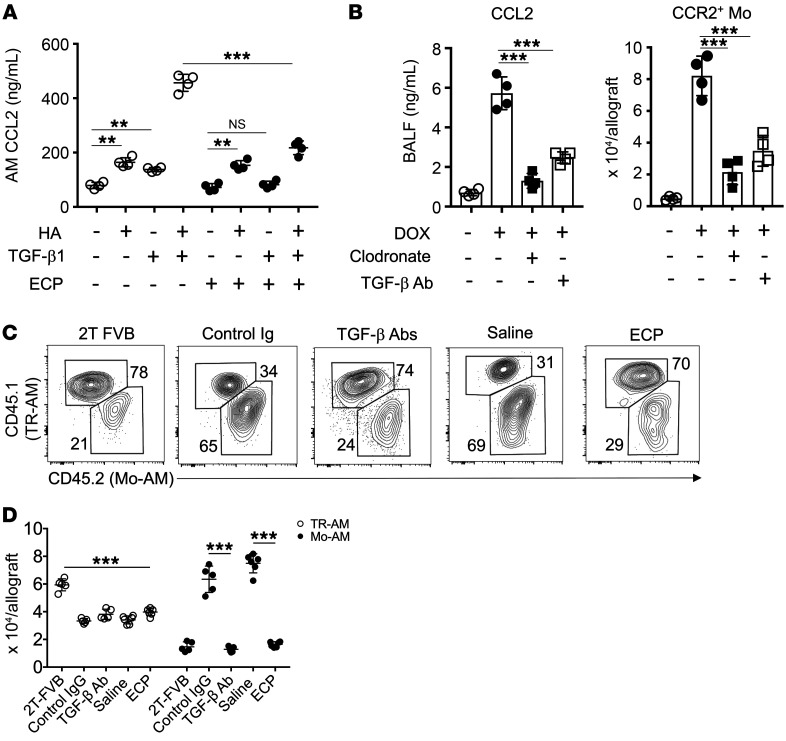
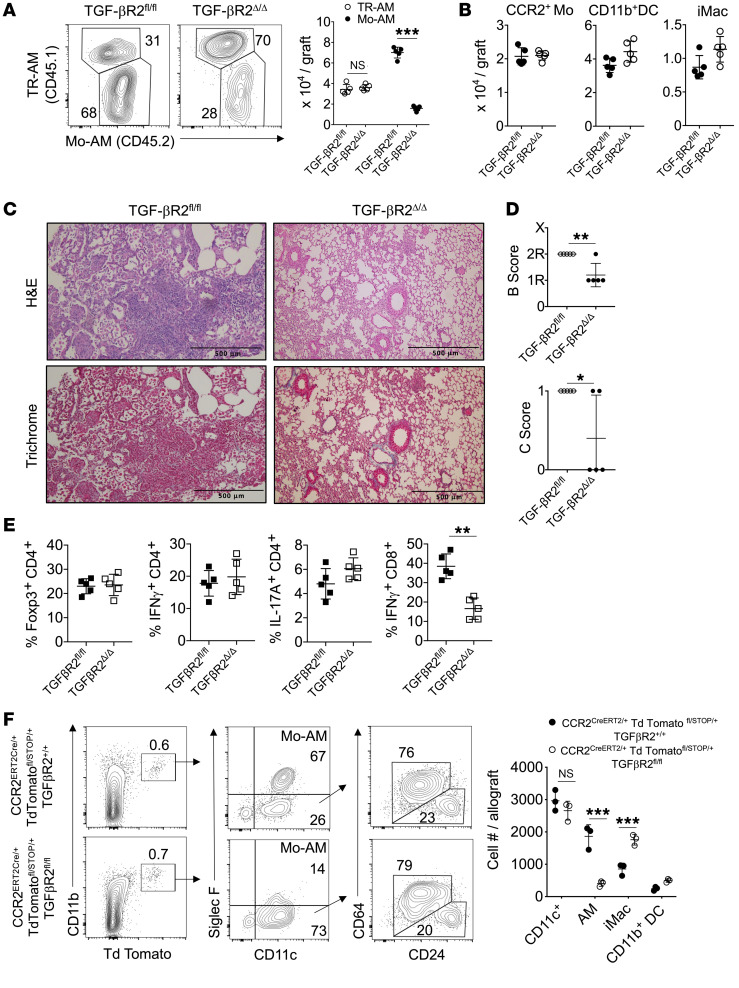
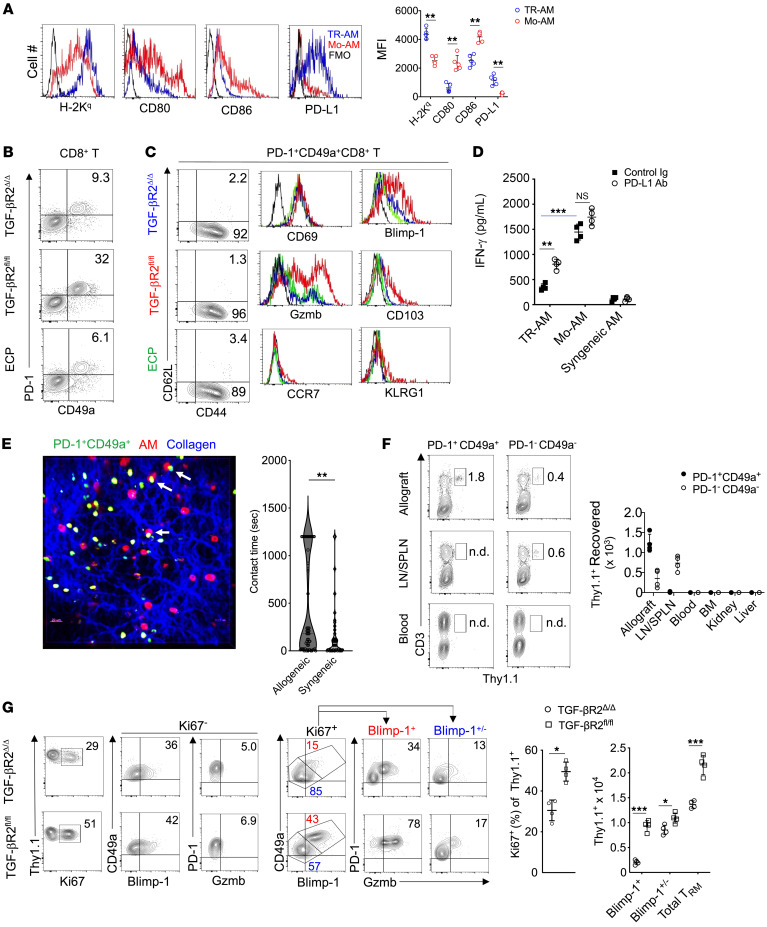
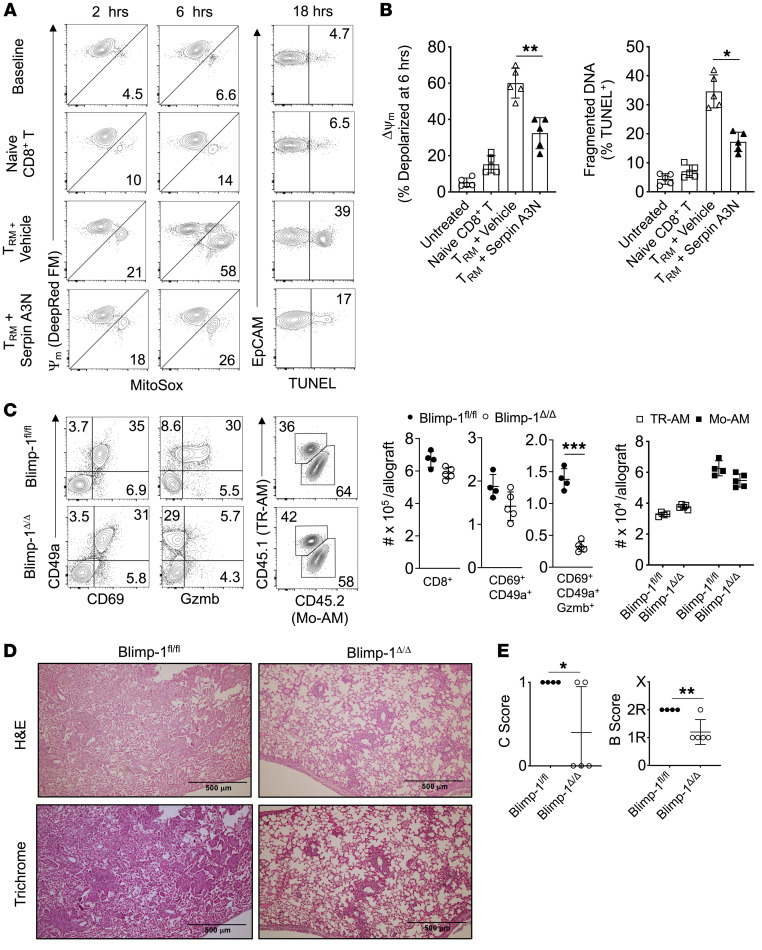
Bronchiolitis obliterans syndrome (BOS) is a major impediment to lung transplant survival and is generally resistant to medical therapy. Extracorporeal photophoresis (ECP) is an immunomodulatory therapy that shows promise in stabilizing BOS patients, but its mechanisms of action are unclear. In a mouse lung transplant model, we show that ECP blunts alloimmune responses and inhibits BOS through lowering airway TGF-β bioavailability without altering its expression. Surprisingly, ECP-treated leukocytes were primarily engulfed by alveolar macrophages (AMs), which were reprogrammed to become less responsive to TGF-β and reduce TGF-β bioavailability through secretion of the TGF-β antagonist decorin. In untreated recipients, high airway TGF-β activity stimulated AMs to express CCL2, leading to CCR2+ monocyte-driven BOS development. Moreover, we found TGF-β receptor 2-dependent differentiation of CCR2+ monocytes was required for the generation of monocyte-derived AMs, which in turn promoted BOS by expanding tissue-resident memory CD8+ T cells that inflicted airway injury through Blimp-1-mediated granzyme B expression. Thus, through studying the effects of ECP, we have identified an AM functional plasticity that controls a TGF-β-dependent network that couples CCR2+ monocyte recruitment and differentiation to alloimmunity and BOS.

Keywords: Adaptive immunity; Immunology; Inflammation; Monocytes; Organ transplantation.


Figures

Figure 1
Figure 1. ECP prevents BOS and lymphocyte recognition of transplant antigens.
(A) 3T-FVB left lungs were transplanted into C57BL/6 (B6) mice and treated with CD40L Abs (POD0) and CTLA4 Ig (POD2) to establish allograft tolerance. Between POD7 and POD9, recipients ingested DOX. They received saline or ECP-treated B6 leukocytes on POD9, POD12, and POD15 and were euthanized on POD16. (B) Representative allograft H&E, trichrome, and CCSP/Ac-tubulin Ab staining. Images shown are representative of n = 10/group. Allografts scored for airway inflammation (C) (B score) and (D) the presence (designated 1) or absence (designated 0) of OB lesions (C score) (n = 10/group). Intragraft (E) total (n = 5/group) and (F) Ki67+ club cell numbers (n = 5/group) and (G) hydroxyproline content (n = 6/group). (H) Intragraft neutrophil numbers (n = 6/group). (I) Representative FACS plots of the intragraft percentage of abundance for indicated T lymphocyte lineages (n = 5/group). (JL) T cell antigen specificity measured by IFN-γ and IL-17A production following stimulation with splenocytes isolated from B6 (syngeneic antigens), FVB (donor antigens), or B6 mice pulsed with lung self-antigens Col V and Kα1T (n = 5/group). (M) DSA (IgM) serum reactivity against FVB CD19+ cells at indicated dilutions (n = 10/group). Assay data shown for G and JL are representative of at least 2 independent evaluations. Data are represented as mean ± SD. Two-sided Mann Whitney U test (CH and JM). *P < 0.05; **P < 0.01; ***P < 0.001.
Figure 2
Figure 2. ECP reprograms AMs to antagonize TGF-β bioavailability.
POD16 2T-FVB and 3T-FVB allograft (A) BALF and plasma analyzed for TGF-β isoform protein content by ELISA (n = 6/group) or (B) activity with a HEK293 SMAD 2/3 luciferase reporter cell line (n = 5/group). AU, arbitrary luciferase units. Data shown for A and B are representative results from 2 experiments. (C) CellTrace633-labeled ECP-treated leukocytes injected into 3T-FVB allograft and analyzed for uptake by intragraft CD11b+ phagocytes. Data shown are representative results from 4 experiments. (D) Heatmap of saline- and ECP-treated POD16 3T-FVB allografts, AM transcript levels of TGF-β signaling, and fibrosis-related gene targets normalized to the macrophage housekeeping gene Stx5a. (n = 4/group) (E) Fold accumulation of TGF-β–induced AM Serpine1 mRNA accumulation in the presence or absence of 10 μM SB43152 or vehicle (DMSO) (n = 4/group). Data shown are normalized to baseline levels (non–TGF-β–treated DMSO-pretreated controls). (F) Saline- and ECP-treated AMs were cultured overnight and analyzed by ELISA for DCN secretion (n = 7/group). (G) TGF-β activity measurements of enriched supernatants from saline- or ECP-treated DCNΔ/Δ and DCNfl/fl AMs cultured with or without 10 ng/ml TGF-β1 (n = 5/group). Data shown in F and G are representative results from 2 experiments. (H) Naive B6 CD4+ T cells were stimulated with plate-bound CD3ε and CD28 Abs in the presence or absence of indicated AM-conditioned supernatants added at a 1:1 v/v ratio to Th17 polarization medium that contained 10 ng/ml TGF-β1 (n = 5/group). Intracellular IL-17A expression was assessed 4 days later. Data are represented as mean ± SD. One-way ANOVA with Dunnett’s multiple-comparison test (A, B, G, and H); 2-sided Mann-Whitney U test (D and F). *P < 0.05; **P < 0.01; ***P < 0.001.
Figure 3
Figure 3. AM DCN expression is required for ECP-mediated inhibition of BOS.
(A) One day prior to transplantation (POD1) into DCNΔ/Δ and DCNfl/fl recipients, 3T-FVB lung donors were treated with intratracheal clodronate liposomes (100 μL) to deplete airway AMs. ECP treatment was conducted between POD9 and POD15, and on POD16, intragraft inflammation was evaluated and is shown by a (B) representative image of H&E and trichrome staining (n = 5/group) and graphs showing (C) airway inflammation and lesion grading (n = 5/group), (D) intragraft T cell activation (n = 4/group), and (E) BALF and circulating plasma TGF-β activity (n = 4/group). Data shown in E are representative results from 2 experiments. Data are represented as mean ± SD. Two-sided Mann-Whitney U test (CE). *P < 0.05; **P < 0.01.
Figure 4
Figure 4. TGF-β blockade prevents intragraft IFN-γ+CD8+ T cell accumulation and BOS.
B6 recipients of 3T-FVB allografts received intratracheal mouse IgG or TGF-β Abs (75 μg/100 μL PBS) on POD7 and on POD16 were analyzed for intragraft inflammation as shown by (A) a representative image of H&E and trichrome staining (n = 6/group), (B) airway inflammation and OB lesion scoring (n = 6/group), and (C) intragraft T cell activation (n = 4/group). Data are represented as mean ± SD. Two-sided Mann-Whitney U test (B and C). *P < 0.05.
Figure 5
Figure 5. Targeting CCR2 expression inhibits BOS.
(A) Dynamic 64Cu-DOTA-ECL1i PET/CT image scans of untreated and ECP-treated 3T-FVB allografts (red arrows) with (B) right native lung and allograft probe uptake quantitation shown as percentage of injected dose per gram (%/ID/gram) of tissue (n = 4/group). Images shown are representative results from 4 scans. (C) 3T-FVB allografts of CCR2DTR recipients that received 10 ng/g i.v. of diphtheria toxin on POD6 and POD11 and B6 recipients of 3T-FVB allografts that received 200 μg i.v. of CCL2-neutralizing Abs on POD6, POD9, and POD12. Both recipients were euthanized on POD16 and assessed for intragraft inflammation by (C) representative H&E and trichrome staining (n = 5/group), (D) airway inflammation and lesion grading (n = 5/group), and (E) intragraft T cell activation (n = 5/group). Data are represented as mean ± SD. One-way ANOVA with Dunnett’s multiple-comparison test (B, D, and E). *P < 0.05; **P < 0.01; ***P < 0.001.
Figure 6
Figure 6. A TGF-β-AM-CCL2 expression circuit promotes Mo-AM allograft accumulation.
(A) Untreated and ECP-treated AMs were stimulated with 10 ng/ml TGF-β1 and/or 1 μg/ml HA for 18 hours and assessed for CCL2 expression by ELISA. Data shown are representative results of 3 experiments with n = 4/stimulation. (B) POD6 3T-FVB allograft recipients were treated with intratracheal TGF-β Abs (75 μg/100 μL PBS) or clodronate liposomes (100 μL), induced to undergo bronchiolar injury (DOX) on POD7, and assessed for BALF CCL2 expression and CCR2+ monocyte recruitment on POD8 (n = 4/treatment). 2T-FVB and 3T-FVB allograft recipients underwent indicated treatments and were quantitated for Mo-AMs and TR-AMs, as shown by a representative contour plot of (C) percentage of abundance (n ≥ 5/group) and (D) cell counts (n ≥ 5/group). Data are represented as mean ± SD. One-way ANOVA with Dunnett’s multiple-comparison test (A, B, and D). **P < 0.01; ***P < 0.001.
Figure 7
Figure 7. CCR2+ monocyte differentiation into Mo-AMs requires TGF-β leading to BOS.
TGF-βR2fl/fl and TGF-βR2Δ/Δ recipients of 3T-FVB allografts received tamoxifen i.p. every other day for 10 days, rested for 5 days, and then ingested DOX for 2 days. Eight days later, allograft recipients were analyzed for intragraft inflammation (A), as shown by representative FACS plots of the relative percentage of abundance of Mo-AMs and TR-AMs with cell counts (n = 5/group), (B) CCR2+ monocytes (Mo), CD11c+ DCs, and iMac cell counts (n = 5/group), (C) representative H&E and trichrome staining (n = 5/group), (D) airway inflammation and lesion grading (n =5/group), and (E) intragraft T cell activation (n = 5/group). (F) 3 × 10⁶ FACS-purified CCR2+ bone marrow monocytes were isolated from indicated Td Tomato reporter mice that received tamoxifen as in A and were injected into POD7 3T-FVB recipients undergoing BOS pathogenesis. On POD16, allograft tissues were quantified for Td Tomato+ Mo-AMs, CD11b+ DCs, and iMacs, as shown by representative FACS plots and cell counts. FACS plots shown are a representative result of 3 experiments. Data are represented as mean ± SD. Two-sided Mann-Whitney U test (A, B, and DF). *P < 0.05; **P < 0.01; ***P < 0.001.
Figure 8
Figure 8. Mo-AM generation promotes TRM cell activation and expansion.
(A) A representative FACS plot set from 4 transplants where MFI is shown for TR-AM and Mo-AM MHC I H-2Kq, CD80, CD86, and PD-L1 expression levels. FMO, fluorescence-minus-one control. (B and C) Representative FACS plots and histograms for n = 4/group for the expression of TRM cell markers with FMO (black lines). (D) FACS-sorted 3T-FVB TR-AMs, Mo-AMs, and B6 AMs were cultured with FACS-sorted 3T-FVB allograft PD-1+CD49a+CD8+ T cells with 10 μg/ml control rat Ig or PD-L1–neutralizing Abs and then assessed for IFN-γ production by ELISA 72 hours later. Data shown are representative results from 2 experiments. (E) FACS-sorted, CFSE-labeled 3T-FVB allograft PD-1+CD49a+CD8+ T cells (green) were intratracheally administered to FVB (allogeneic) or B6 (syngeneic) lung transplants of B6 recipients. Eighteen hours later, transplants were imaged by 2-photon intravital microscopy immediately following the administration of Siglec F Abs to identify AMs (red). Representative intravital image from 1 of 4 FVB-transplanted lung studies. Arrows denote long-lasting contacts between TRM cells and AMs. Right panel shows violin plot of individual AM-TRM cell contact times from pooled data from 4 FVB (allogeneic) or B6 (syngeneic) transplanted lungs. (F) 2T-FVB allografts of B6 Thy1.1+ recipients were FACS-sorted for PD-1+CD49a+ and PD-1CD49a CD8+ T cells and intratracheally delivered into B6 Thy1.2+ recipients of 2T-FVB allografts and euthanized 1 month later. Shown are representative FACS plot results of Thy1.1+ cell percentage of abundance and cell count for indicated tissues (n = 4 per adoptive transfer). (G) 2T-FVB allograft FACS-sorted Thy1.1 PD-1+CD49a+CD8+ T cells were intratracheally administered into tamoxifen-treated TGF-βR2fl/fl and TGF-βR2Δ/Δ recipients of 3T-FVB allografts 3 days after DOX ingestion. Seventy-two hours later, recipients were euthanized. Data shown are representative FACS plots from n = 4/group for allograft percentage of abundance and cell counts. Data are represented as mean ± SD. Two-sided Mann-Whitney U test (A and G); 1-way ANOVA with Dunnett’s multiple-comparison test (D). *P < 0.05; **P < 0.01; ***P < 0.001.
Figure 9
Figure 9. Gzmb+ TRM cells promote airway epithelial cell apoptosis and BOS through Blimp-1.
FVB lung epithelial cells were cocultured in a 1:2 EpCAM+ cell–to–CD8+ T cell ratio for up to 18 hours with or without Serpin A3N pretreatment (25 nM) and assessed for mitochondrial membrane potential (MitoTracker Deep Red FM), mitochondrial superoxide production (MitoSOX), and DNA fragmentation (TUNEL). Data are shown as (A) a representative FACS plot result from 5 experiments and (B) 6-hour epithelial cell mitochondrial depolarization and TUNEL activity (n = 5/condition). Blimp-1fl/fl and Blimp-1Δ/Δ recipients of 3T-FVB allografts were analyzed for intragraft inflammation as shown by (C) representative FACS plot data of TRM cell markers, Gzmb expression, and AM abundance, with cell counts n ≥ 4/group. (D) Representative H&E and trichrome staining results for n ≥ 4/group and (E) airway inflammation and lesion grading (n ≥ 4 /group). Data are represented as mean ± SD. One-way ANOVA with Dunnett’s multiple-comparison test (B); 2-sided Mann-Whitney U test (C and E).*P < 0.05; **P < 0.01.

References

    1. Yusen RD, et al. The registry of the International Society for Heart and Lung Transplantation: thirty-third adult lung and heart-lung transplant report-2016; focus theme: primary diagnostic indications for transplant. J Heart Lung Transplant. 2016;35(10):1170–1184. - PubMed
    1. Verleden SE, et al. Advances in understanding bronchiolitis obliterans after lung transplantation. Chest. 2016;150(1):219–225. doi: 10.1016/j.chest.2016.04.014. - DOI - PubMed
    1. Barker AF, et al. Obliterative bronchiolitis. N Engl J Med. 2014;370(19):1820–1828. doi: 10.1056/NEJMra1204664. - DOI - PubMed
    1. Montoro DT, et al. A revised airway epithelial hierarchy includes CFTR-expressing ionocytes. Nature. 2018;560(7718):319–324. doi: 10.1038/s41586-018-0393-7. - DOI - PMC - PubMed
    1. Itabashi Y, et al. Decline in club cell secretory proteins, exosomes induction and immune responses to lung self-antigens, Kα1 tubulin and collagen V, leading to chronic rejection after human lung transplantation. Transplantation. 2021;105(6):1337–1346. doi: 10.1097/TP.0000000000003428. - DOI - PMC - PubMed

Publication types